Free Statistics

of Irreproducible Research!

Author's title

Author*Unverified author*
R Software Modulerwasp_multipleregression.wasp
Title produced by softwareMultiple Regression
Date of computationThu, 29 May 2014 03:13:33 -0400
Cite this page as followsStatistical Computations at FreeStatistics.org, Office for Research Development and Education, URL https://freestatistics.org/blog/index.php?v=date/2014/May/29/t1401347738rbwt8b7s6caqy64.htm/, Retrieved Sun, 19 May 2024 21:15:39 +0000
Statistical Computations at FreeStatistics.org, Office for Research Development and Education, URL https://freestatistics.org/blog/index.php?pk=235216, Retrieved Sun, 19 May 2024 21:15:39 +0000
QR Codes:

Original text written by user:
IsPrivate?No (this computation is public)
User-defined keywordsrevenue, cpi
Estimated Impact173
Family? (F = Feedback message, R = changed R code, M = changed R Module, P = changed Parameters, D = changed Data)
-       [Multiple Regression] [Multiple Regressi...] [2014-05-29 07:13:33] [d41d8cd98f00b204e9800998ecf8427e] [Current]
Feedback Forum

Post a new message
Dataseries X:
3485	221.66
3386	225.53
3312	226.06
3015	226.51
3440	227.9
3474	229.79
3720	226.65
3563	230.98
3861	228.17
3714	229.45
3716	230.33
3501	229.35


Summary of computational transaction
Raw Inputview raw input (R code)
Raw Outputview raw output of R engine
Computing time6 seconds
R Server'Gwilym Jenkins' @ jenkins.wessa.net

\begin{tabular}{lllllllll}
\hline
Summary of computational transaction \tabularnewline
Raw Input & view raw input (R code)  \tabularnewline
Raw Output & view raw output of R engine  \tabularnewline
Computing time & 6 seconds \tabularnewline
R Server & 'Gwilym Jenkins' @ jenkins.wessa.net \tabularnewline
\hline
\end{tabular}
%Source: https://freestatistics.org/blog/index.php?pk=235216&T=0

[TABLE]
[ROW][C]Summary of computational transaction[/C][/ROW]
[ROW][C]Raw Input[/C][C]view raw input (R code) [/C][/ROW]
[ROW][C]Raw Output[/C][C]view raw output of R engine [/C][/ROW]
[ROW][C]Computing time[/C][C]6 seconds[/C][/ROW]
[ROW][C]R Server[/C][C]'Gwilym Jenkins' @ jenkins.wessa.net[/C][/ROW]
[/TABLE]
Source: https://freestatistics.org/blog/index.php?pk=235216&T=0

Globally Unique Identifier (entire table): ba.freestatistics.org/blog/index.php?pk=235216&T=0

As an alternative you can also use a QR Code:  

The GUIDs for individual cells are displayed in the table below:

Summary of computational transaction
Raw Inputview raw input (R code)
Raw Outputview raw output of R engine
Computing time6 seconds
R Server'Gwilym Jenkins' @ jenkins.wessa.net


Multiple Linear Regression - Estimated Regression Equation
V1[t] = -9180.94 + 54.7752V2[t] + 402.001Q1[t] + 202.795Q2[t] + 292.382Q3[t] + e[t]

\begin{tabular}{lllllllll}
\hline
Multiple Linear Regression - Estimated Regression Equation \tabularnewline
V1[t] =  -9180.94 +  54.7752V2[t] +  402.001Q1[t] +  202.795Q2[t] +  292.382Q3[t]  + e[t] \tabularnewline
\hline
\end{tabular}
%Source: https://freestatistics.org/blog/index.php?pk=235216&T=1

[TABLE]
[ROW][C]Multiple Linear Regression - Estimated Regression Equation[/C][/ROW]
[ROW][C]V1[t] =  -9180.94 +  54.7752V2[t] +  402.001Q1[t] +  202.795Q2[t] +  292.382Q3[t]  + e[t][/C][/ROW]
[/TABLE]
Source: https://freestatistics.org/blog/index.php?pk=235216&T=1

Globally Unique Identifier (entire table): ba.freestatistics.org/blog/index.php?pk=235216&T=1

As an alternative you can also use a QR Code:  

The GUIDs for individual cells are displayed in the table below:

Multiple Linear Regression - Estimated Regression Equation
V1[t] = -9180.94 + 54.7752V2[t] + 402.001Q1[t] + 202.795Q2[t] + 292.382Q3[t] + e[t]


Multiple Linear Regression - Ordinary Least Squares
VariableParameterS.D.T-STATH0: parameter = 02-tail p-value1-tail p-value
(Intercept)-9180.945912.7-1.5530.1644260.082213
V254.775225.82082.1210.07157750.0357888
Q1402.001180.2712.230.06097240.0304862
Q2202.795163.31.2420.2542830.127142
Q3292.382165.5881.7660.1207890.0603943

\begin{tabular}{lllllllll}
\hline
Multiple Linear Regression - Ordinary Least Squares \tabularnewline
Variable & Parameter & S.D. & T-STATH0: parameter = 0 & 2-tail p-value & 1-tail p-value \tabularnewline
(Intercept) & -9180.94 & 5912.7 & -1.553 & 0.164426 & 0.082213 \tabularnewline
V2 & 54.7752 & 25.8208 & 2.121 & 0.0715775 & 0.0357888 \tabularnewline
Q1 & 402.001 & 180.271 & 2.23 & 0.0609724 & 0.0304862 \tabularnewline
Q2 & 202.795 & 163.3 & 1.242 & 0.254283 & 0.127142 \tabularnewline
Q3 & 292.382 & 165.588 & 1.766 & 0.120789 & 0.0603943 \tabularnewline
\hline
\end{tabular}
%Source: https://freestatistics.org/blog/index.php?pk=235216&T=2

[TABLE]
[ROW][C]Multiple Linear Regression - Ordinary Least Squares[/C][/ROW]
[ROW][C]Variable[/C][C]Parameter[/C][C]S.D.[/C][C]T-STATH0: parameter = 0[/C][C]2-tail p-value[/C][C]1-tail p-value[/C][/ROW]
[ROW][C](Intercept)[/C][C]-9180.94[/C][C]5912.7[/C][C]-1.553[/C][C]0.164426[/C][C]0.082213[/C][/ROW]
[ROW][C]V2[/C][C]54.7752[/C][C]25.8208[/C][C]2.121[/C][C]0.0715775[/C][C]0.0357888[/C][/ROW]
[ROW][C]Q1[/C][C]402.001[/C][C]180.271[/C][C]2.23[/C][C]0.0609724[/C][C]0.0304862[/C][/ROW]
[ROW][C]Q2[/C][C]202.795[/C][C]163.3[/C][C]1.242[/C][C]0.254283[/C][C]0.127142[/C][/ROW]
[ROW][C]Q3[/C][C]292.382[/C][C]165.588[/C][C]1.766[/C][C]0.120789[/C][C]0.0603943[/C][/ROW]
[/TABLE]
Source: https://freestatistics.org/blog/index.php?pk=235216&T=2

Globally Unique Identifier (entire table): ba.freestatistics.org/blog/index.php?pk=235216&T=2

As an alternative you can also use a QR Code:  

The GUIDs for individual cells are displayed in the table below:

Multiple Linear Regression - Ordinary Least Squares
VariableParameterS.D.T-STATH0: parameter = 02-tail p-value1-tail p-value
(Intercept)-9180.945912.7-1.5530.1644260.082213
V254.775225.82082.1210.07157750.0357888
Q1402.001180.2712.230.06097240.0304862
Q2202.795163.31.2420.2542830.127142
Q3292.382165.5881.7660.1207890.0603943


Multiple Linear Regression - Regression Statistics
Multiple R0.711481
R-squared0.506206
Adjusted R-squared0.224038
F-TEST (value)1.79399
F-TEST (DF numerator)4
F-TEST (DF denominator)7
p-value0.234509
Multiple Linear Regression - Residual Statistics
Residual Standard Deviation198.807
Sum Squared Residuals276670

\begin{tabular}{lllllllll}
\hline
Multiple Linear Regression - Regression Statistics \tabularnewline
Multiple R & 0.711481 \tabularnewline
R-squared & 0.506206 \tabularnewline
Adjusted R-squared & 0.224038 \tabularnewline
F-TEST (value) & 1.79399 \tabularnewline
F-TEST (DF numerator) & 4 \tabularnewline
F-TEST (DF denominator) & 7 \tabularnewline
p-value & 0.234509 \tabularnewline
Multiple Linear Regression - Residual Statistics \tabularnewline
Residual Standard Deviation & 198.807 \tabularnewline
Sum Squared Residuals & 276670 \tabularnewline
\hline
\end{tabular}
%Source: https://freestatistics.org/blog/index.php?pk=235216&T=3

[TABLE]
[ROW][C]Multiple Linear Regression - Regression Statistics[/C][/ROW]
[ROW][C]Multiple R[/C][C]0.711481[/C][/ROW]
[ROW][C]R-squared[/C][C]0.506206[/C][/ROW]
[ROW][C]Adjusted R-squared[/C][C]0.224038[/C][/ROW]
[ROW][C]F-TEST (value)[/C][C]1.79399[/C][/ROW]
[ROW][C]F-TEST (DF numerator)[/C][C]4[/C][/ROW]
[ROW][C]F-TEST (DF denominator)[/C][C]7[/C][/ROW]
[ROW][C]p-value[/C][C]0.234509[/C][/ROW]
[ROW][C]Multiple Linear Regression - Residual Statistics[/C][/ROW]
[ROW][C]Residual Standard Deviation[/C][C]198.807[/C][/ROW]
[ROW][C]Sum Squared Residuals[/C][C]276670[/C][/ROW]
[/TABLE]
Source: https://freestatistics.org/blog/index.php?pk=235216&T=3

Globally Unique Identifier (entire table): ba.freestatistics.org/blog/index.php?pk=235216&T=3

As an alternative you can also use a QR Code:  

The GUIDs for individual cells are displayed in the table below:

Multiple Linear Regression - Regression Statistics
Multiple R0.711481
R-squared0.506206
Adjusted R-squared0.224038
F-TEST (value)1.79399
F-TEST (DF numerator)4
F-TEST (DF denominator)7
p-value0.234509
Multiple Linear Regression - Residual Statistics
Residual Standard Deviation198.807
Sum Squared Residuals276670


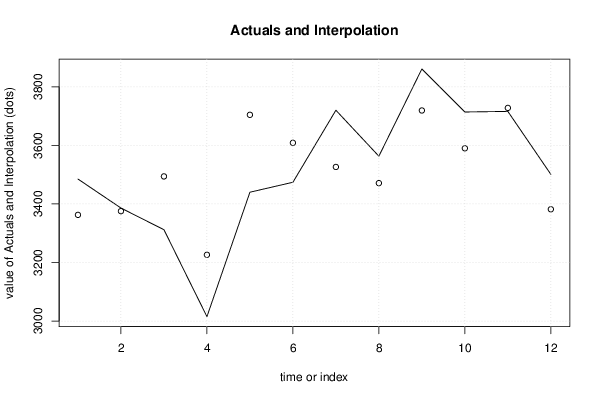
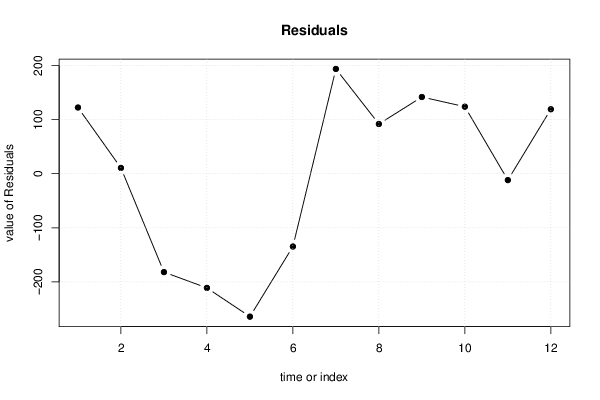
Multiple Linear Regression - Actuals, Interpolation, and Residuals
Time or IndexActualsInterpolationForecastResidualsPrediction Error
134853362.54122.461
233863375.3110.6871
333123493.93-181.931
430153226.2-211.198
534403704.34-264.336
634743608.66-134.655
737203526.25193.752
835633471.0491.957
938613719.13141.875
1037143590.03123.968
1137163727.82-11.821
1235013381.76119.241

\begin{tabular}{lllllllll}
\hline
Multiple Linear Regression - Actuals, Interpolation, and Residuals \tabularnewline
Time or Index & Actuals & InterpolationForecast & ResidualsPrediction Error \tabularnewline
1 & 3485 & 3362.54 & 122.461 \tabularnewline
2 & 3386 & 3375.31 & 10.6871 \tabularnewline
3 & 3312 & 3493.93 & -181.931 \tabularnewline
4 & 3015 & 3226.2 & -211.198 \tabularnewline
5 & 3440 & 3704.34 & -264.336 \tabularnewline
6 & 3474 & 3608.66 & -134.655 \tabularnewline
7 & 3720 & 3526.25 & 193.752 \tabularnewline
8 & 3563 & 3471.04 & 91.957 \tabularnewline
9 & 3861 & 3719.13 & 141.875 \tabularnewline
10 & 3714 & 3590.03 & 123.968 \tabularnewline
11 & 3716 & 3727.82 & -11.821 \tabularnewline
12 & 3501 & 3381.76 & 119.241 \tabularnewline
\hline
\end{tabular}
%Source: https://freestatistics.org/blog/index.php?pk=235216&T=4

[TABLE]
[ROW][C]Multiple Linear Regression - Actuals, Interpolation, and Residuals[/C][/ROW]
[ROW][C]Time or Index[/C][C]Actuals[/C][C]InterpolationForecast[/C][C]ResidualsPrediction Error[/C][/ROW]
[ROW][C]1[/C][C]3485[/C][C]3362.54[/C][C]122.461[/C][/ROW]
[ROW][C]2[/C][C]3386[/C][C]3375.31[/C][C]10.6871[/C][/ROW]
[ROW][C]3[/C][C]3312[/C][C]3493.93[/C][C]-181.931[/C][/ROW]
[ROW][C]4[/C][C]3015[/C][C]3226.2[/C][C]-211.198[/C][/ROW]
[ROW][C]5[/C][C]3440[/C][C]3704.34[/C][C]-264.336[/C][/ROW]
[ROW][C]6[/C][C]3474[/C][C]3608.66[/C][C]-134.655[/C][/ROW]
[ROW][C]7[/C][C]3720[/C][C]3526.25[/C][C]193.752[/C][/ROW]
[ROW][C]8[/C][C]3563[/C][C]3471.04[/C][C]91.957[/C][/ROW]
[ROW][C]9[/C][C]3861[/C][C]3719.13[/C][C]141.875[/C][/ROW]
[ROW][C]10[/C][C]3714[/C][C]3590.03[/C][C]123.968[/C][/ROW]
[ROW][C]11[/C][C]3716[/C][C]3727.82[/C][C]-11.821[/C][/ROW]
[ROW][C]12[/C][C]3501[/C][C]3381.76[/C][C]119.241[/C][/ROW]
[/TABLE]
Source: https://freestatistics.org/blog/index.php?pk=235216&T=4

Globally Unique Identifier (entire table): ba.freestatistics.org/blog/index.php?pk=235216&T=4

As an alternative you can also use a QR Code:  

The GUIDs for individual cells are displayed in the table below:

Multiple Linear Regression - Actuals, Interpolation, and Residuals
Time or IndexActualsInterpolationForecastResidualsPrediction Error
134853362.54122.461
233863375.3110.6871
333123493.93-181.931
430153226.2-211.198
534403704.34-264.336
634743608.66-134.655
737203526.25193.752
835633471.0491.957
938613719.13141.875
1037143590.03123.968
1137163727.82-11.821
1235013381.76119.241


Parameters (Session):
par1 = 1 ; par2 = Include Quarterly Dummies ; par3 = No Linear Trend ;
Parameters (R input):
par1 = 1 ; par2 = Include Quarterly Dummies ; par3 = No Linear Trend ;
R code (references can be found in the software module):
par3 <- 'No Linear Trend'
par2 <- 'Do not include Seasonal Dummies'
par1 <- '1'
library(lattice)
library(lmtest)
n25 <- 25 #minimum number of obs. for Goldfeld-Quandt test
par1 <- as.numeric(par1)
x <- t(y)
k <- length(x[1,])
n <- length(x[,1])
x1 <- cbind(x[,par1], x[,1:k!=par1])
mycolnames <- c(colnames(x)[par1], colnames(x)[1:k!=par1])
colnames(x1) <- mycolnames #colnames(x)[par1]
x <- x1
if (par3 == 'First Differences'){
x2 <- array(0, dim=c(n-1,k), dimnames=list(1:(n-1), paste('(1-B)',colnames(x),sep='')))
for (i in 1:n-1) {
for (j in 1:k) {
x2[i,j] <- x[i+1,j] - x[i,j]
}
}
x <- x2
}
if (par2 == 'Include Monthly Dummies'){
x2 <- array(0, dim=c(n,11), dimnames=list(1:n, paste('M', seq(1:11), sep ='')))
for (i in 1:11){
x2[seq(i,n,12),i] <- 1
}
x <- cbind(x, x2)
}
if (par2 == 'Include Quarterly Dummies'){
x2 <- array(0, dim=c(n,3), dimnames=list(1:n, paste('Q', seq(1:3), sep ='')))
for (i in 1:3){
x2[seq(i,n,4),i] <- 1
}
x <- cbind(x, x2)
}
k <- length(x[1,])
if (par3 == 'Linear Trend'){
x <- cbind(x, c(1:n))
colnames(x)[k+1] <- 't'
}
x
k <- length(x[1,])
df <- as.data.frame(x)
(mylm <- lm(df))
(mysum <- summary(mylm))
if (n > n25) {
kp3 <- k + 3
nmkm3 <- n - k - 3
gqarr <- array(NA, dim=c(nmkm3-kp3+1,3))
numgqtests <- 0
numsignificant1 <- 0
numsignificant5 <- 0
numsignificant10 <- 0
for (mypoint in kp3:nmkm3) {
j <- 0
numgqtests <- numgqtests + 1
for (myalt in c('greater', 'two.sided', 'less')) {
j <- j + 1
gqarr[mypoint-kp3+1,j] <- gqtest(mylm, point=mypoint, alternative=myalt)$p.value
}
if (gqarr[mypoint-kp3+1,2] < 0.01) numsignificant1 <- numsignificant1 + 1
if (gqarr[mypoint-kp3+1,2] < 0.05) numsignificant5 <- numsignificant5 + 1
if (gqarr[mypoint-kp3+1,2] < 0.10) numsignificant10 <- numsignificant10 + 1
}
gqarr
}
bitmap(file='test0.png')
plot(x[,1], type='l', main='Actuals and Interpolation', ylab='value of Actuals and Interpolation (dots)', xlab='time or index')
points(x[,1]-mysum$resid)
grid()
dev.off()
bitmap(file='test1.png')
plot(mysum$resid, type='b', pch=19, main='Residuals', ylab='value of Residuals', xlab='time or index')
grid()
dev.off()
bitmap(file='test2.png')
hist(mysum$resid, main='Residual Histogram', xlab='values of Residuals')
grid()
dev.off()
bitmap(file='test3.png')
densityplot(~mysum$resid,col='black',main='Residual Density Plot', xlab='values of Residuals')
dev.off()
bitmap(file='test4.png')
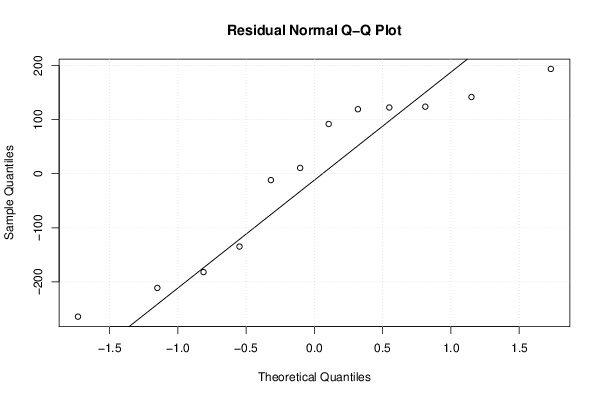
qqnorm(mysum$resid, main='Residual Normal Q-Q Plot')
qqline(mysum$resid)
grid()
dev.off()
(myerror <- as.ts(mysum$resid))
bitmap(file='test5.png')
dum <- cbind(lag(myerror,k=1),myerror)
dum
dum1 <- dum[2:length(myerror),]
dum1
z <- as.data.frame(dum1)
z
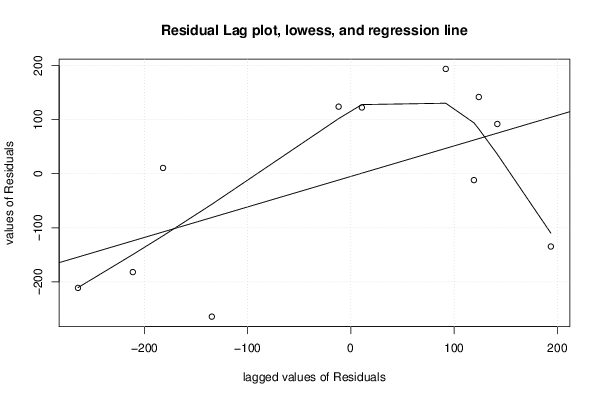
plot(z,main=paste('Residual Lag plot, lowess, and regression line'), ylab='values of Residuals', xlab='lagged values of Residuals')
lines(lowess(z))
abline(lm(z))
grid()
dev.off()
bitmap(file='test6.png')
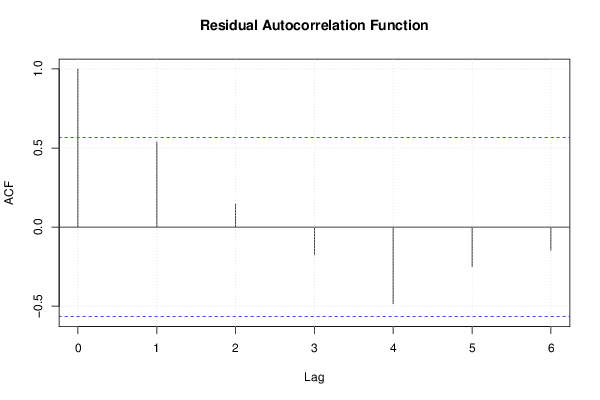
acf(mysum$resid, lag.max=length(mysum$resid)/2, main='Residual Autocorrelation Function')
grid()
dev.off()
bitmap(file='test7.png')
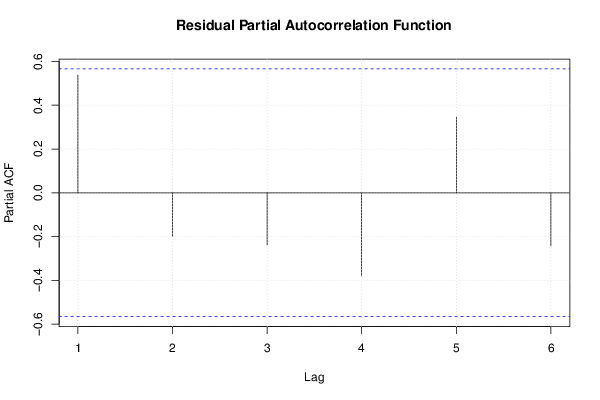
pacf(mysum$resid, lag.max=length(mysum$resid)/2, main='Residual Partial Autocorrelation Function')
grid()
dev.off()
bitmap(file='test8.png')
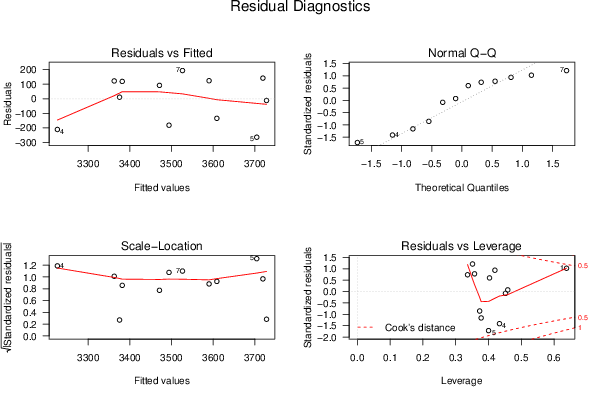
opar <- par(mfrow = c(2,2), oma = c(0, 0, 1.1, 0))
plot(mylm, las = 1, sub='Residual Diagnostics')
par(opar)
dev.off()
if (n > n25) {
bitmap(file='test9.png')
plot(kp3:nmkm3,gqarr[,2], main='Goldfeld-Quandt test',ylab='2-sided p-value',xlab='breakpoint')
grid()
dev.off()
}
load(file='createtable')
a<-table.start()
a<-table.row.start(a)
a<-table.element(a, 'Multiple Linear Regression - Estimated Regression Equation', 1, TRUE)
a<-table.row.end(a)
myeq <- colnames(x)[1]
myeq <- paste(myeq, '[t] = ', sep='')
for (i in 1:k){
if (mysum$coefficients[i,1] > 0) myeq <- paste(myeq, '+', '')
myeq <- paste(myeq, signif(mysum$coefficients[i,1],6), sep=' ')
if (rownames(mysum$coefficients)[i] != '(Intercept)') {
myeq <- paste(myeq, rownames(mysum$coefficients)[i], sep='')
if (rownames(mysum$coefficients)[i] != 't') myeq <- paste(myeq, '[t]', sep='')
}
}
myeq <- paste(myeq, ' + e[t]')
a<-table.row.start(a)
a<-table.element(a, myeq)
a<-table.row.end(a)
a<-table.end(a)
table.save(a,file='mytable1.tab')
a<-table.start()
a<-table.row.start(a)
a<-table.element(a,hyperlink('ols1.htm','Multiple Linear Regression - Ordinary Least Squares',''), 6, TRUE)
a<-table.row.end(a)
a<-table.row.start(a)
a<-table.element(a,'Variable',header=TRUE)
a<-table.element(a,'Parameter',header=TRUE)
a<-table.element(a,'S.D.',header=TRUE)
a<-table.element(a,'T-STAT
H0: parameter = 0',header=TRUE)
a<-table.element(a,'2-tail p-value',header=TRUE)
a<-table.element(a,'1-tail p-value',header=TRUE)
a<-table.row.end(a)
for (i in 1:k){
a<-table.row.start(a)
a<-table.element(a,rownames(mysum$coefficients)[i],header=TRUE)
a<-table.element(a,signif(mysum$coefficients[i,1],6))
a<-table.element(a, signif(mysum$coefficients[i,2],6))
a<-table.element(a, signif(mysum$coefficients[i,3],4))
a<-table.element(a, signif(mysum$coefficients[i,4],6))
a<-table.element(a, signif(mysum$coefficients[i,4]/2,6))
a<-table.row.end(a)
}
a<-table.end(a)
table.save(a,file='mytable2.tab')
a<-table.start()
a<-table.row.start(a)
a<-table.element(a, 'Multiple Linear Regression - Regression Statistics', 2, TRUE)
a<-table.row.end(a)
a<-table.row.start(a)
a<-table.element(a, 'Multiple R',1,TRUE)
a<-table.element(a, signif(sqrt(mysum$r.squared),6))
a<-table.row.end(a)
a<-table.row.start(a)
a<-table.element(a, 'R-squared',1,TRUE)
a<-table.element(a, signif(mysum$r.squared,6))
a<-table.row.end(a)
a<-table.row.start(a)
a<-table.element(a, 'Adjusted R-squared',1,TRUE)
a<-table.element(a, signif(mysum$adj.r.squared,6))
a<-table.row.end(a)
a<-table.row.start(a)
a<-table.element(a, 'F-TEST (value)',1,TRUE)
a<-table.element(a, signif(mysum$fstatistic[1],6))
a<-table.row.end(a)
a<-table.row.start(a)
a<-table.element(a, 'F-TEST (DF numerator)',1,TRUE)
a<-table.element(a, signif(mysum$fstatistic[2],6))
a<-table.row.end(a)
a<-table.row.start(a)
a<-table.element(a, 'F-TEST (DF denominator)',1,TRUE)
a<-table.element(a, signif(mysum$fstatistic[3],6))
a<-table.row.end(a)
a<-table.row.start(a)
a<-table.element(a, 'p-value',1,TRUE)
a<-table.element(a, signif(1-pf(mysum$fstatistic[1],mysum$fstatistic[2],mysum$fstatistic[3]),6))
a<-table.row.end(a)
a<-table.row.start(a)
a<-table.element(a, 'Multiple Linear Regression - Residual Statistics', 2, TRUE)
a<-table.row.end(a)
a<-table.row.start(a)
a<-table.element(a, 'Residual Standard Deviation',1,TRUE)
a<-table.element(a, signif(mysum$sigma,6))
a<-table.row.end(a)
a<-table.row.start(a)
a<-table.element(a, 'Sum Squared Residuals',1,TRUE)
a<-table.element(a, signif(sum(myerror*myerror),6))
a<-table.row.end(a)
a<-table.end(a)
table.save(a,file='mytable3.tab')
a<-table.start()
a<-table.row.start(a)
a<-table.element(a, 'Multiple Linear Regression - Actuals, Interpolation, and Residuals', 4, TRUE)
a<-table.row.end(a)
a<-table.row.start(a)
a<-table.element(a, 'Time or Index', 1, TRUE)
a<-table.element(a, 'Actuals', 1, TRUE)
a<-table.element(a, 'Interpolation
Forecast', 1, TRUE)
a<-table.element(a, 'Residuals
Prediction Error', 1, TRUE)
a<-table.row.end(a)
for (i in 1:n) {
a<-table.row.start(a)
a<-table.element(a,i, 1, TRUE)
a<-table.element(a,signif(x[i],6))
a<-table.element(a,signif(x[i]-mysum$resid[i],6))
a<-table.element(a,signif(mysum$resid[i],6))
a<-table.row.end(a)
}
a<-table.end(a)
table.save(a,file='mytable4.tab')
if (n > n25) {
a<-table.start()
a<-table.row.start(a)
a<-table.element(a,'Goldfeld-Quandt test for Heteroskedasticity',4,TRUE)
a<-table.row.end(a)
a<-table.row.start(a)
a<-table.element(a,'p-values',header=TRUE)
a<-table.element(a,'Alternative Hypothesis',3,header=TRUE)
a<-table.row.end(a)
a<-table.row.start(a)
a<-table.element(a,'breakpoint index',header=TRUE)
a<-table.element(a,'greater',header=TRUE)
a<-table.element(a,'2-sided',header=TRUE)
a<-table.element(a,'less',header=TRUE)
a<-table.row.end(a)
for (mypoint in kp3:nmkm3) {
a<-table.row.start(a)
a<-table.element(a,mypoint,header=TRUE)
a<-table.element(a,signif(gqarr[mypoint-kp3+1,1],6))
a<-table.element(a,signif(gqarr[mypoint-kp3+1,2],6))
a<-table.element(a,signif(gqarr[mypoint-kp3+1,3],6))
a<-table.row.end(a)
}
a<-table.end(a)
table.save(a,file='mytable5.tab')
a<-table.start()
a<-table.row.start(a)
a<-table.element(a,'Meta Analysis of Goldfeld-Quandt test for Heteroskedasticity',4,TRUE)
a<-table.row.end(a)
a<-table.row.start(a)
a<-table.element(a,'Description',header=TRUE)
a<-table.element(a,'# significant tests',header=TRUE)
a<-table.element(a,'% significant tests',header=TRUE)
a<-table.element(a,'OK/NOK',header=TRUE)
a<-table.row.end(a)
a<-table.row.start(a)
a<-table.element(a,'1% type I error level',header=TRUE)
a<-table.element(a,signif(numsignificant1,6))
a<-table.element(a,signif(numsignificant1/numgqtests,6))
if (numsignificant1/numgqtests < 0.01) dum <- 'OK' else dum <- 'NOK'
a<-table.element(a,dum)
a<-table.row.end(a)
a<-table.row.start(a)
a<-table.element(a,'5% type I error level',header=TRUE)
a<-table.element(a,signif(numsignificant5,6))
a<-table.element(a,signif(numsignificant5/numgqtests,6))
if (numsignificant5/numgqtests < 0.05) dum <- 'OK' else dum <- 'NOK'
a<-table.element(a,dum)
a<-table.row.end(a)
a<-table.row.start(a)
a<-table.element(a,'10% type I error level',header=TRUE)
a<-table.element(a,signif(numsignificant10,6))
a<-table.element(a,signif(numsignificant10/numgqtests,6))
if (numsignificant10/numgqtests < 0.1) dum <- 'OK' else dum <- 'NOK'
a<-table.element(a,dum)
a<-table.row.end(a)
a<-table.end(a)
table.save(a,file='mytable6.tab')
}