Free Statistics

of Irreproducible Research!

Author's title

Author*Unverified author*
R Software Modulerwasp_autocorrelation.wasp
Title produced by software(Partial) Autocorrelation Function
Date of computationTue, 29 Jul 2014 10:01:24 +0100
Cite this page as followsStatistical Computations at FreeStatistics.org, Office for Research Development and Education, URL https://freestatistics.org/blog/index.php?v=date/2014/Jul/29/t1406624589lrakvy1xdkf21p5.htm/, Retrieved Wed, 15 May 2024 17:43:17 +0000
Statistical Computations at FreeStatistics.org, Office for Research Development and Education, URL https://freestatistics.org/blog/index.php?pk=235356, Retrieved Wed, 15 May 2024 17:43:17 +0000
QR Codes:

Original text written by user:
IsPrivate?No (this computation is public)
User-defined keywords
Estimated Impact176
Family? (F = Feedback message, R = changed R code, M = changed R Module, P = changed Parameters, D = changed Data)
-       [(Partial) Autocorrelation Function] [] [2014-07-29 09:01:24] [d41d8cd98f00b204e9800998ecf8427e] [Current]
Feedback Forum

Post a new message
Dataseries X:
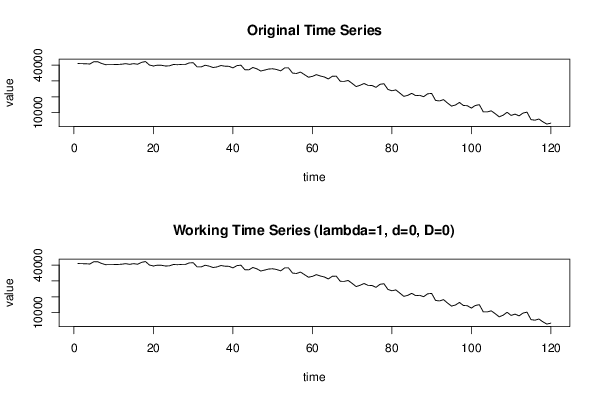
40927
40856
40778
40635
42103
42032
40927
40194
40265
40265
40336
40486
40856
40414
40856
40486
41661
42181
39973
39381
39894
39823
39381
39453
40336
40194
40336
40336
41298
41440
38790
38790
39823
39310
38427
38790
39674
39232
39161
38206
39602
39894
37023
36952
38427
37615
36218
36810
37465
37615
37173
36290
38128
38128
34893
34673
35556
33939
32314
32835
33939
33055
32464
31210
32906
32977
29743
29664
30256
28418
26430
27235
28339
27164
27093
25910
27826
28197
24585
23780
24293
22305
20246
20909
22156
20688
20909
20026
21864
22084
17668
17375
18180
16050
14134
14797
16414
14504
14355
12880
14504
15017
10451
10451
11113
9347
7359
8392
10230
8242
9055
7950
9717
10308
5592
5229
5963
4196
2800
3384


Summary of computational transaction
Raw Inputview raw input (R code)
Raw Outputview raw output of R engine
Computing time2 seconds
R Server'George Udny Yule' @ yule.wessa.net

\begin{tabular}{lllllllll}
\hline
Summary of computational transaction \tabularnewline
Raw Input & view raw input (R code)  \tabularnewline
Raw Output & view raw output of R engine  \tabularnewline
Computing time & 2 seconds \tabularnewline
R Server & 'George Udny Yule' @ yule.wessa.net \tabularnewline
\hline
\end{tabular}
%Source: https://freestatistics.org/blog/index.php?pk=235356&T=0

[TABLE]
[ROW][C]Summary of computational transaction[/C][/ROW]
[ROW][C]Raw Input[/C][C]view raw input (R code) [/C][/ROW]
[ROW][C]Raw Output[/C][C]view raw output of R engine [/C][/ROW]
[ROW][C]Computing time[/C][C]2 seconds[/C][/ROW]
[ROW][C]R Server[/C][C]'George Udny Yule' @ yule.wessa.net[/C][/ROW]
[/TABLE]
Source: https://freestatistics.org/blog/index.php?pk=235356&T=0

Globally Unique Identifier (entire table): ba.freestatistics.org/blog/index.php?pk=235356&T=0

As an alternative you can also use a QR Code:  

The GUIDs for individual cells are displayed in the table below:

Summary of computational transaction
Raw Inputview raw input (R code)
Raw Outputview raw output of R engine
Computing time2 seconds
R Server'George Udny Yule' @ yule.wessa.net


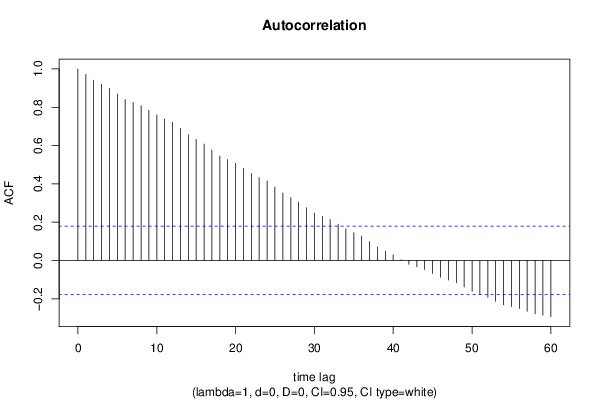
Autocorrelation Function
Time lag kACF(k)T-STATP-value
10.97050410.63130
20.9410710.30890
30.91991910.07720
40.8979529.83660
50.8689759.51910
60.840669.2090
70.8246359.03340
80.8082428.85380
90.7843928.59260
100.7591978.31660
110.7384798.08960
120.7209887.8980
130.6887817.54520
140.6562187.18850
150.632146.92470
160.607476.65450
170.5762686.31270
180.5452265.97270
190.5264115.76650
200.5070285.55420
210.4805325.2640
220.4538764.9721e-06
230.4326544.73953e-06
240.4143544.5397e-06
250.3830474.19612.6e-05
260.3516363.8529.5e-05
270.328223.59550.000236
280.3046483.33730.000563
290.2751493.01410.001573
300.246912.70480.003915
310.2304512.52450.006446
320.213332.33690.010551
330.189152.0720.020202
340.1649171.80660.036667
350.1451291.58980.057255
360.1272981.39450.082874
370.0987671.08190.140725
380.0703480.77060.221221
390.0495120.54240.294284
400.0292740.32070.374506
410.0037930.04160.483462
42-0.019539-0.2140.415441
43-0.032628-0.35740.360704
44-0.04678-0.51250.304638
45-0.067602-0.74050.23021
46-0.087303-0.95640.170407
47-0.102399-1.12170.132108
48-0.116014-1.27090.103116
49-0.138291-1.51490.066214
50-0.161145-1.76530.040032
51-0.177126-1.94030.027343
52-0.192336-2.10690.018603
53-0.212531-2.32820.010789
54-0.231227-2.5330.0063
55-0.24054-2.6350.004762
56-0.250493-2.7440.003501
57-0.265647-2.910.002154
58-0.278443-3.05020.001408
59-0.286413-3.13750.001072
60-0.29332-3.21320.000843

\begin{tabular}{lllllllll}
\hline
Autocorrelation Function \tabularnewline
Time lag k & ACF(k) & T-STAT & P-value \tabularnewline
1 & 0.970504 & 10.6313 & 0 \tabularnewline
2 & 0.94107 & 10.3089 & 0 \tabularnewline
3 & 0.919919 & 10.0772 & 0 \tabularnewline
4 & 0.897952 & 9.8366 & 0 \tabularnewline
5 & 0.868975 & 9.5191 & 0 \tabularnewline
6 & 0.84066 & 9.209 & 0 \tabularnewline
7 & 0.824635 & 9.0334 & 0 \tabularnewline
8 & 0.808242 & 8.8538 & 0 \tabularnewline
9 & 0.784392 & 8.5926 & 0 \tabularnewline
10 & 0.759197 & 8.3166 & 0 \tabularnewline
11 & 0.738479 & 8.0896 & 0 \tabularnewline
12 & 0.720988 & 7.898 & 0 \tabularnewline
13 & 0.688781 & 7.5452 & 0 \tabularnewline
14 & 0.656218 & 7.1885 & 0 \tabularnewline
15 & 0.63214 & 6.9247 & 0 \tabularnewline
16 & 0.60747 & 6.6545 & 0 \tabularnewline
17 & 0.576268 & 6.3127 & 0 \tabularnewline
18 & 0.545226 & 5.9727 & 0 \tabularnewline
19 & 0.526411 & 5.7665 & 0 \tabularnewline
20 & 0.507028 & 5.5542 & 0 \tabularnewline
21 & 0.480532 & 5.264 & 0 \tabularnewline
22 & 0.453876 & 4.972 & 1e-06 \tabularnewline
23 & 0.432654 & 4.7395 & 3e-06 \tabularnewline
24 & 0.414354 & 4.539 & 7e-06 \tabularnewline
25 & 0.383047 & 4.1961 & 2.6e-05 \tabularnewline
26 & 0.351636 & 3.852 & 9.5e-05 \tabularnewline
27 & 0.32822 & 3.5955 & 0.000236 \tabularnewline
28 & 0.304648 & 3.3373 & 0.000563 \tabularnewline
29 & 0.275149 & 3.0141 & 0.001573 \tabularnewline
30 & 0.24691 & 2.7048 & 0.003915 \tabularnewline
31 & 0.230451 & 2.5245 & 0.006446 \tabularnewline
32 & 0.21333 & 2.3369 & 0.010551 \tabularnewline
33 & 0.18915 & 2.072 & 0.020202 \tabularnewline
34 & 0.164917 & 1.8066 & 0.036667 \tabularnewline
35 & 0.145129 & 1.5898 & 0.057255 \tabularnewline
36 & 0.127298 & 1.3945 & 0.082874 \tabularnewline
37 & 0.098767 & 1.0819 & 0.140725 \tabularnewline
38 & 0.070348 & 0.7706 & 0.221221 \tabularnewline
39 & 0.049512 & 0.5424 & 0.294284 \tabularnewline
40 & 0.029274 & 0.3207 & 0.374506 \tabularnewline
41 & 0.003793 & 0.0416 & 0.483462 \tabularnewline
42 & -0.019539 & -0.214 & 0.415441 \tabularnewline
43 & -0.032628 & -0.3574 & 0.360704 \tabularnewline
44 & -0.04678 & -0.5125 & 0.304638 \tabularnewline
45 & -0.067602 & -0.7405 & 0.23021 \tabularnewline
46 & -0.087303 & -0.9564 & 0.170407 \tabularnewline
47 & -0.102399 & -1.1217 & 0.132108 \tabularnewline
48 & -0.116014 & -1.2709 & 0.103116 \tabularnewline
49 & -0.138291 & -1.5149 & 0.066214 \tabularnewline
50 & -0.161145 & -1.7653 & 0.040032 \tabularnewline
51 & -0.177126 & -1.9403 & 0.027343 \tabularnewline
52 & -0.192336 & -2.1069 & 0.018603 \tabularnewline
53 & -0.212531 & -2.3282 & 0.010789 \tabularnewline
54 & -0.231227 & -2.533 & 0.0063 \tabularnewline
55 & -0.24054 & -2.635 & 0.004762 \tabularnewline
56 & -0.250493 & -2.744 & 0.003501 \tabularnewline
57 & -0.265647 & -2.91 & 0.002154 \tabularnewline
58 & -0.278443 & -3.0502 & 0.001408 \tabularnewline
59 & -0.286413 & -3.1375 & 0.001072 \tabularnewline
60 & -0.29332 & -3.2132 & 0.000843 \tabularnewline
\hline
\end{tabular}
%Source: https://freestatistics.org/blog/index.php?pk=235356&T=1

[TABLE]
[ROW][C]Autocorrelation Function[/C][/ROW]
[ROW][C]Time lag k[/C][C]ACF(k)[/C][C]T-STAT[/C][C]P-value[/C][/ROW]
[ROW][C]1[/C][C]0.970504[/C][C]10.6313[/C][C]0[/C][/ROW]
[ROW][C]2[/C][C]0.94107[/C][C]10.3089[/C][C]0[/C][/ROW]
[ROW][C]3[/C][C]0.919919[/C][C]10.0772[/C][C]0[/C][/ROW]
[ROW][C]4[/C][C]0.897952[/C][C]9.8366[/C][C]0[/C][/ROW]
[ROW][C]5[/C][C]0.868975[/C][C]9.5191[/C][C]0[/C][/ROW]
[ROW][C]6[/C][C]0.84066[/C][C]9.209[/C][C]0[/C][/ROW]
[ROW][C]7[/C][C]0.824635[/C][C]9.0334[/C][C]0[/C][/ROW]
[ROW][C]8[/C][C]0.808242[/C][C]8.8538[/C][C]0[/C][/ROW]
[ROW][C]9[/C][C]0.784392[/C][C]8.5926[/C][C]0[/C][/ROW]
[ROW][C]10[/C][C]0.759197[/C][C]8.3166[/C][C]0[/C][/ROW]
[ROW][C]11[/C][C]0.738479[/C][C]8.0896[/C][C]0[/C][/ROW]
[ROW][C]12[/C][C]0.720988[/C][C]7.898[/C][C]0[/C][/ROW]
[ROW][C]13[/C][C]0.688781[/C][C]7.5452[/C][C]0[/C][/ROW]
[ROW][C]14[/C][C]0.656218[/C][C]7.1885[/C][C]0[/C][/ROW]
[ROW][C]15[/C][C]0.63214[/C][C]6.9247[/C][C]0[/C][/ROW]
[ROW][C]16[/C][C]0.60747[/C][C]6.6545[/C][C]0[/C][/ROW]
[ROW][C]17[/C][C]0.576268[/C][C]6.3127[/C][C]0[/C][/ROW]
[ROW][C]18[/C][C]0.545226[/C][C]5.9727[/C][C]0[/C][/ROW]
[ROW][C]19[/C][C]0.526411[/C][C]5.7665[/C][C]0[/C][/ROW]
[ROW][C]20[/C][C]0.507028[/C][C]5.5542[/C][C]0[/C][/ROW]
[ROW][C]21[/C][C]0.480532[/C][C]5.264[/C][C]0[/C][/ROW]
[ROW][C]22[/C][C]0.453876[/C][C]4.972[/C][C]1e-06[/C][/ROW]
[ROW][C]23[/C][C]0.432654[/C][C]4.7395[/C][C]3e-06[/C][/ROW]
[ROW][C]24[/C][C]0.414354[/C][C]4.539[/C][C]7e-06[/C][/ROW]
[ROW][C]25[/C][C]0.383047[/C][C]4.1961[/C][C]2.6e-05[/C][/ROW]
[ROW][C]26[/C][C]0.351636[/C][C]3.852[/C][C]9.5e-05[/C][/ROW]
[ROW][C]27[/C][C]0.32822[/C][C]3.5955[/C][C]0.000236[/C][/ROW]
[ROW][C]28[/C][C]0.304648[/C][C]3.3373[/C][C]0.000563[/C][/ROW]
[ROW][C]29[/C][C]0.275149[/C][C]3.0141[/C][C]0.001573[/C][/ROW]
[ROW][C]30[/C][C]0.24691[/C][C]2.7048[/C][C]0.003915[/C][/ROW]
[ROW][C]31[/C][C]0.230451[/C][C]2.5245[/C][C]0.006446[/C][/ROW]
[ROW][C]32[/C][C]0.21333[/C][C]2.3369[/C][C]0.010551[/C][/ROW]
[ROW][C]33[/C][C]0.18915[/C][C]2.072[/C][C]0.020202[/C][/ROW]
[ROW][C]34[/C][C]0.164917[/C][C]1.8066[/C][C]0.036667[/C][/ROW]
[ROW][C]35[/C][C]0.145129[/C][C]1.5898[/C][C]0.057255[/C][/ROW]
[ROW][C]36[/C][C]0.127298[/C][C]1.3945[/C][C]0.082874[/C][/ROW]
[ROW][C]37[/C][C]0.098767[/C][C]1.0819[/C][C]0.140725[/C][/ROW]
[ROW][C]38[/C][C]0.070348[/C][C]0.7706[/C][C]0.221221[/C][/ROW]
[ROW][C]39[/C][C]0.049512[/C][C]0.5424[/C][C]0.294284[/C][/ROW]
[ROW][C]40[/C][C]0.029274[/C][C]0.3207[/C][C]0.374506[/C][/ROW]
[ROW][C]41[/C][C]0.003793[/C][C]0.0416[/C][C]0.483462[/C][/ROW]
[ROW][C]42[/C][C]-0.019539[/C][C]-0.214[/C][C]0.415441[/C][/ROW]
[ROW][C]43[/C][C]-0.032628[/C][C]-0.3574[/C][C]0.360704[/C][/ROW]
[ROW][C]44[/C][C]-0.04678[/C][C]-0.5125[/C][C]0.304638[/C][/ROW]
[ROW][C]45[/C][C]-0.067602[/C][C]-0.7405[/C][C]0.23021[/C][/ROW]
[ROW][C]46[/C][C]-0.087303[/C][C]-0.9564[/C][C]0.170407[/C][/ROW]
[ROW][C]47[/C][C]-0.102399[/C][C]-1.1217[/C][C]0.132108[/C][/ROW]
[ROW][C]48[/C][C]-0.116014[/C][C]-1.2709[/C][C]0.103116[/C][/ROW]
[ROW][C]49[/C][C]-0.138291[/C][C]-1.5149[/C][C]0.066214[/C][/ROW]
[ROW][C]50[/C][C]-0.161145[/C][C]-1.7653[/C][C]0.040032[/C][/ROW]
[ROW][C]51[/C][C]-0.177126[/C][C]-1.9403[/C][C]0.027343[/C][/ROW]
[ROW][C]52[/C][C]-0.192336[/C][C]-2.1069[/C][C]0.018603[/C][/ROW]
[ROW][C]53[/C][C]-0.212531[/C][C]-2.3282[/C][C]0.010789[/C][/ROW]
[ROW][C]54[/C][C]-0.231227[/C][C]-2.533[/C][C]0.0063[/C][/ROW]
[ROW][C]55[/C][C]-0.24054[/C][C]-2.635[/C][C]0.004762[/C][/ROW]
[ROW][C]56[/C][C]-0.250493[/C][C]-2.744[/C][C]0.003501[/C][/ROW]
[ROW][C]57[/C][C]-0.265647[/C][C]-2.91[/C][C]0.002154[/C][/ROW]
[ROW][C]58[/C][C]-0.278443[/C][C]-3.0502[/C][C]0.001408[/C][/ROW]
[ROW][C]59[/C][C]-0.286413[/C][C]-3.1375[/C][C]0.001072[/C][/ROW]
[ROW][C]60[/C][C]-0.29332[/C][C]-3.2132[/C][C]0.000843[/C][/ROW]
[/TABLE]
Source: https://freestatistics.org/blog/index.php?pk=235356&T=1

Globally Unique Identifier (entire table): ba.freestatistics.org/blog/index.php?pk=235356&T=1

As an alternative you can also use a QR Code:  

The GUIDs for individual cells are displayed in the table below:

Autocorrelation Function
Time lag kACF(k)T-STATP-value
10.97050410.63130
20.9410710.30890
30.91991910.07720
40.8979529.83660
50.8689759.51910
60.840669.2090
70.8246359.03340
80.8082428.85380
90.7843928.59260
100.7591978.31660
110.7384798.08960
120.7209887.8980
130.6887817.54520
140.6562187.18850
150.632146.92470
160.607476.65450
170.5762686.31270
180.5452265.97270
190.5264115.76650
200.5070285.55420
210.4805325.2640
220.4538764.9721e-06
230.4326544.73953e-06
240.4143544.5397e-06
250.3830474.19612.6e-05
260.3516363.8529.5e-05
270.328223.59550.000236
280.3046483.33730.000563
290.2751493.01410.001573
300.246912.70480.003915
310.2304512.52450.006446
320.213332.33690.010551
330.189152.0720.020202
340.1649171.80660.036667
350.1451291.58980.057255
360.1272981.39450.082874
370.0987671.08190.140725
380.0703480.77060.221221
390.0495120.54240.294284
400.0292740.32070.374506
410.0037930.04160.483462
42-0.019539-0.2140.415441
43-0.032628-0.35740.360704
44-0.04678-0.51250.304638
45-0.067602-0.74050.23021
46-0.087303-0.95640.170407
47-0.102399-1.12170.132108
48-0.116014-1.27090.103116
49-0.138291-1.51490.066214
50-0.161145-1.76530.040032
51-0.177126-1.94030.027343
52-0.192336-2.10690.018603
53-0.212531-2.32820.010789
54-0.231227-2.5330.0063
55-0.24054-2.6350.004762
56-0.250493-2.7440.003501
57-0.265647-2.910.002154
58-0.278443-3.05020.001408
59-0.286413-3.13750.001072
60-0.29332-3.21320.000843


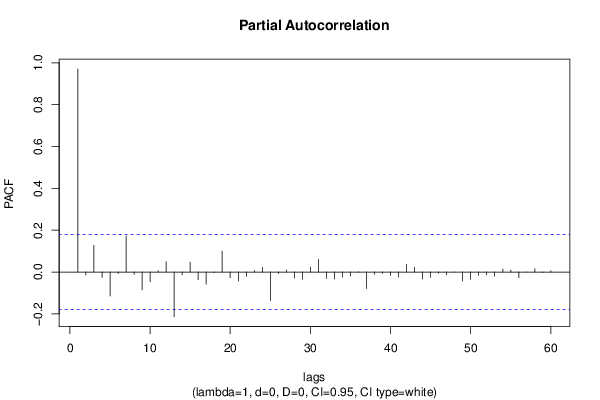
Partial Autocorrelation Function
Time lag kPACF(k)T-STATP-value
10.97050410.63130
2-0.013905-0.15230.439594
30.1273721.39530.082752
4-0.025519-0.27950.390154
5-0.114357-1.25270.106372
6-0.007263-0.07960.468361
70.1726931.89180.030467
8-0.011069-0.12130.451844
9-0.085068-0.93190.176637
10-0.046297-0.50720.306485
110.0059070.06470.474255
120.0491740.53870.295554
13-0.213136-2.33480.010608
14-0.01308-0.14330.443152
150.0472990.51810.302659
16-0.037036-0.40570.342838
17-0.057735-0.63250.264147
18-0.002977-0.03260.487019
190.0993651.08850.13928
20-0.027602-0.30240.381449
21-0.043225-0.47350.318356
22-0.020599-0.22560.41093
230.0073980.0810.467772
240.0224580.2460.403044
25-0.136898-1.49960.068167
26-0.007155-0.07840.46883
270.0099710.10920.456601
28-0.028791-0.31540.376507
29-0.034903-0.38230.35144
300.02350.25740.398644
310.0611950.67040.251959
32-0.030091-0.32960.371128
33-0.032593-0.3570.360845
34-0.023979-0.26270.396624
35-0.019315-0.21160.416395
36-0.001055-0.01160.4954
37-0.078659-0.86170.195294
38-0.010701-0.11720.453438
39-0.006315-0.06920.472484
40-0.016418-0.17980.428787
41-0.023249-0.25470.399702
420.0368770.4040.343479
430.0225840.24740.402515
44-0.033431-0.36620.357423
45-0.02503-0.27420.392204
46-0.005398-0.05910.476471
47-0.012919-0.14150.443846
480.0002220.00240.499033
49-0.042874-0.46970.319725
50-0.035357-0.38730.349605
51-0.015484-0.16960.432799
52-0.013318-0.14590.442127
53-0.019511-0.21370.415559
540.0140290.15370.439061
550.0088720.09720.46137
56-0.026632-0.29170.385497
570.0001390.00150.499394
580.015980.17510.430667
59-0.002549-0.02790.488883
600.0056440.06180.475403

\begin{tabular}{lllllllll}
\hline
Partial Autocorrelation Function \tabularnewline
Time lag k & PACF(k) & T-STAT & P-value \tabularnewline
1 & 0.970504 & 10.6313 & 0 \tabularnewline
2 & -0.013905 & -0.1523 & 0.439594 \tabularnewline
3 & 0.127372 & 1.3953 & 0.082752 \tabularnewline
4 & -0.025519 & -0.2795 & 0.390154 \tabularnewline
5 & -0.114357 & -1.2527 & 0.106372 \tabularnewline
6 & -0.007263 & -0.0796 & 0.468361 \tabularnewline
7 & 0.172693 & 1.8918 & 0.030467 \tabularnewline
8 & -0.011069 & -0.1213 & 0.451844 \tabularnewline
9 & -0.085068 & -0.9319 & 0.176637 \tabularnewline
10 & -0.046297 & -0.5072 & 0.306485 \tabularnewline
11 & 0.005907 & 0.0647 & 0.474255 \tabularnewline
12 & 0.049174 & 0.5387 & 0.295554 \tabularnewline
13 & -0.213136 & -2.3348 & 0.010608 \tabularnewline
14 & -0.01308 & -0.1433 & 0.443152 \tabularnewline
15 & 0.047299 & 0.5181 & 0.302659 \tabularnewline
16 & -0.037036 & -0.4057 & 0.342838 \tabularnewline
17 & -0.057735 & -0.6325 & 0.264147 \tabularnewline
18 & -0.002977 & -0.0326 & 0.487019 \tabularnewline
19 & 0.099365 & 1.0885 & 0.13928 \tabularnewline
20 & -0.027602 & -0.3024 & 0.381449 \tabularnewline
21 & -0.043225 & -0.4735 & 0.318356 \tabularnewline
22 & -0.020599 & -0.2256 & 0.41093 \tabularnewline
23 & 0.007398 & 0.081 & 0.467772 \tabularnewline
24 & 0.022458 & 0.246 & 0.403044 \tabularnewline
25 & -0.136898 & -1.4996 & 0.068167 \tabularnewline
26 & -0.007155 & -0.0784 & 0.46883 \tabularnewline
27 & 0.009971 & 0.1092 & 0.456601 \tabularnewline
28 & -0.028791 & -0.3154 & 0.376507 \tabularnewline
29 & -0.034903 & -0.3823 & 0.35144 \tabularnewline
30 & 0.0235 & 0.2574 & 0.398644 \tabularnewline
31 & 0.061195 & 0.6704 & 0.251959 \tabularnewline
32 & -0.030091 & -0.3296 & 0.371128 \tabularnewline
33 & -0.032593 & -0.357 & 0.360845 \tabularnewline
34 & -0.023979 & -0.2627 & 0.396624 \tabularnewline
35 & -0.019315 & -0.2116 & 0.416395 \tabularnewline
36 & -0.001055 & -0.0116 & 0.4954 \tabularnewline
37 & -0.078659 & -0.8617 & 0.195294 \tabularnewline
38 & -0.010701 & -0.1172 & 0.453438 \tabularnewline
39 & -0.006315 & -0.0692 & 0.472484 \tabularnewline
40 & -0.016418 & -0.1798 & 0.428787 \tabularnewline
41 & -0.023249 & -0.2547 & 0.399702 \tabularnewline
42 & 0.036877 & 0.404 & 0.343479 \tabularnewline
43 & 0.022584 & 0.2474 & 0.402515 \tabularnewline
44 & -0.033431 & -0.3662 & 0.357423 \tabularnewline
45 & -0.02503 & -0.2742 & 0.392204 \tabularnewline
46 & -0.005398 & -0.0591 & 0.476471 \tabularnewline
47 & -0.012919 & -0.1415 & 0.443846 \tabularnewline
48 & 0.000222 & 0.0024 & 0.499033 \tabularnewline
49 & -0.042874 & -0.4697 & 0.319725 \tabularnewline
50 & -0.035357 & -0.3873 & 0.349605 \tabularnewline
51 & -0.015484 & -0.1696 & 0.432799 \tabularnewline
52 & -0.013318 & -0.1459 & 0.442127 \tabularnewline
53 & -0.019511 & -0.2137 & 0.415559 \tabularnewline
54 & 0.014029 & 0.1537 & 0.439061 \tabularnewline
55 & 0.008872 & 0.0972 & 0.46137 \tabularnewline
56 & -0.026632 & -0.2917 & 0.385497 \tabularnewline
57 & 0.000139 & 0.0015 & 0.499394 \tabularnewline
58 & 0.01598 & 0.1751 & 0.430667 \tabularnewline
59 & -0.002549 & -0.0279 & 0.488883 \tabularnewline
60 & 0.005644 & 0.0618 & 0.475403 \tabularnewline
\hline
\end{tabular}
%Source: https://freestatistics.org/blog/index.php?pk=235356&T=2

[TABLE]
[ROW][C]Partial Autocorrelation Function[/C][/ROW]
[ROW][C]Time lag k[/C][C]PACF(k)[/C][C]T-STAT[/C][C]P-value[/C][/ROW]
[ROW][C]1[/C][C]0.970504[/C][C]10.6313[/C][C]0[/C][/ROW]
[ROW][C]2[/C][C]-0.013905[/C][C]-0.1523[/C][C]0.439594[/C][/ROW]
[ROW][C]3[/C][C]0.127372[/C][C]1.3953[/C][C]0.082752[/C][/ROW]
[ROW][C]4[/C][C]-0.025519[/C][C]-0.2795[/C][C]0.390154[/C][/ROW]
[ROW][C]5[/C][C]-0.114357[/C][C]-1.2527[/C][C]0.106372[/C][/ROW]
[ROW][C]6[/C][C]-0.007263[/C][C]-0.0796[/C][C]0.468361[/C][/ROW]
[ROW][C]7[/C][C]0.172693[/C][C]1.8918[/C][C]0.030467[/C][/ROW]
[ROW][C]8[/C][C]-0.011069[/C][C]-0.1213[/C][C]0.451844[/C][/ROW]
[ROW][C]9[/C][C]-0.085068[/C][C]-0.9319[/C][C]0.176637[/C][/ROW]
[ROW][C]10[/C][C]-0.046297[/C][C]-0.5072[/C][C]0.306485[/C][/ROW]
[ROW][C]11[/C][C]0.005907[/C][C]0.0647[/C][C]0.474255[/C][/ROW]
[ROW][C]12[/C][C]0.049174[/C][C]0.5387[/C][C]0.295554[/C][/ROW]
[ROW][C]13[/C][C]-0.213136[/C][C]-2.3348[/C][C]0.010608[/C][/ROW]
[ROW][C]14[/C][C]-0.01308[/C][C]-0.1433[/C][C]0.443152[/C][/ROW]
[ROW][C]15[/C][C]0.047299[/C][C]0.5181[/C][C]0.302659[/C][/ROW]
[ROW][C]16[/C][C]-0.037036[/C][C]-0.4057[/C][C]0.342838[/C][/ROW]
[ROW][C]17[/C][C]-0.057735[/C][C]-0.6325[/C][C]0.264147[/C][/ROW]
[ROW][C]18[/C][C]-0.002977[/C][C]-0.0326[/C][C]0.487019[/C][/ROW]
[ROW][C]19[/C][C]0.099365[/C][C]1.0885[/C][C]0.13928[/C][/ROW]
[ROW][C]20[/C][C]-0.027602[/C][C]-0.3024[/C][C]0.381449[/C][/ROW]
[ROW][C]21[/C][C]-0.043225[/C][C]-0.4735[/C][C]0.318356[/C][/ROW]
[ROW][C]22[/C][C]-0.020599[/C][C]-0.2256[/C][C]0.41093[/C][/ROW]
[ROW][C]23[/C][C]0.007398[/C][C]0.081[/C][C]0.467772[/C][/ROW]
[ROW][C]24[/C][C]0.022458[/C][C]0.246[/C][C]0.403044[/C][/ROW]
[ROW][C]25[/C][C]-0.136898[/C][C]-1.4996[/C][C]0.068167[/C][/ROW]
[ROW][C]26[/C][C]-0.007155[/C][C]-0.0784[/C][C]0.46883[/C][/ROW]
[ROW][C]27[/C][C]0.009971[/C][C]0.1092[/C][C]0.456601[/C][/ROW]
[ROW][C]28[/C][C]-0.028791[/C][C]-0.3154[/C][C]0.376507[/C][/ROW]
[ROW][C]29[/C][C]-0.034903[/C][C]-0.3823[/C][C]0.35144[/C][/ROW]
[ROW][C]30[/C][C]0.0235[/C][C]0.2574[/C][C]0.398644[/C][/ROW]
[ROW][C]31[/C][C]0.061195[/C][C]0.6704[/C][C]0.251959[/C][/ROW]
[ROW][C]32[/C][C]-0.030091[/C][C]-0.3296[/C][C]0.371128[/C][/ROW]
[ROW][C]33[/C][C]-0.032593[/C][C]-0.357[/C][C]0.360845[/C][/ROW]
[ROW][C]34[/C][C]-0.023979[/C][C]-0.2627[/C][C]0.396624[/C][/ROW]
[ROW][C]35[/C][C]-0.019315[/C][C]-0.2116[/C][C]0.416395[/C][/ROW]
[ROW][C]36[/C][C]-0.001055[/C][C]-0.0116[/C][C]0.4954[/C][/ROW]
[ROW][C]37[/C][C]-0.078659[/C][C]-0.8617[/C][C]0.195294[/C][/ROW]
[ROW][C]38[/C][C]-0.010701[/C][C]-0.1172[/C][C]0.453438[/C][/ROW]
[ROW][C]39[/C][C]-0.006315[/C][C]-0.0692[/C][C]0.472484[/C][/ROW]
[ROW][C]40[/C][C]-0.016418[/C][C]-0.1798[/C][C]0.428787[/C][/ROW]
[ROW][C]41[/C][C]-0.023249[/C][C]-0.2547[/C][C]0.399702[/C][/ROW]
[ROW][C]42[/C][C]0.036877[/C][C]0.404[/C][C]0.343479[/C][/ROW]
[ROW][C]43[/C][C]0.022584[/C][C]0.2474[/C][C]0.402515[/C][/ROW]
[ROW][C]44[/C][C]-0.033431[/C][C]-0.3662[/C][C]0.357423[/C][/ROW]
[ROW][C]45[/C][C]-0.02503[/C][C]-0.2742[/C][C]0.392204[/C][/ROW]
[ROW][C]46[/C][C]-0.005398[/C][C]-0.0591[/C][C]0.476471[/C][/ROW]
[ROW][C]47[/C][C]-0.012919[/C][C]-0.1415[/C][C]0.443846[/C][/ROW]
[ROW][C]48[/C][C]0.000222[/C][C]0.0024[/C][C]0.499033[/C][/ROW]
[ROW][C]49[/C][C]-0.042874[/C][C]-0.4697[/C][C]0.319725[/C][/ROW]
[ROW][C]50[/C][C]-0.035357[/C][C]-0.3873[/C][C]0.349605[/C][/ROW]
[ROW][C]51[/C][C]-0.015484[/C][C]-0.1696[/C][C]0.432799[/C][/ROW]
[ROW][C]52[/C][C]-0.013318[/C][C]-0.1459[/C][C]0.442127[/C][/ROW]
[ROW][C]53[/C][C]-0.019511[/C][C]-0.2137[/C][C]0.415559[/C][/ROW]
[ROW][C]54[/C][C]0.014029[/C][C]0.1537[/C][C]0.439061[/C][/ROW]
[ROW][C]55[/C][C]0.008872[/C][C]0.0972[/C][C]0.46137[/C][/ROW]
[ROW][C]56[/C][C]-0.026632[/C][C]-0.2917[/C][C]0.385497[/C][/ROW]
[ROW][C]57[/C][C]0.000139[/C][C]0.0015[/C][C]0.499394[/C][/ROW]
[ROW][C]58[/C][C]0.01598[/C][C]0.1751[/C][C]0.430667[/C][/ROW]
[ROW][C]59[/C][C]-0.002549[/C][C]-0.0279[/C][C]0.488883[/C][/ROW]
[ROW][C]60[/C][C]0.005644[/C][C]0.0618[/C][C]0.475403[/C][/ROW]
[/TABLE]
Source: https://freestatistics.org/blog/index.php?pk=235356&T=2

Globally Unique Identifier (entire table): ba.freestatistics.org/blog/index.php?pk=235356&T=2

As an alternative you can also use a QR Code:  

The GUIDs for individual cells are displayed in the table below:

Partial Autocorrelation Function
Time lag kPACF(k)T-STATP-value
10.97050410.63130
2-0.013905-0.15230.439594
30.1273721.39530.082752
4-0.025519-0.27950.390154
5-0.114357-1.25270.106372
6-0.007263-0.07960.468361
70.1726931.89180.030467
8-0.011069-0.12130.451844
9-0.085068-0.93190.176637
10-0.046297-0.50720.306485
110.0059070.06470.474255
120.0491740.53870.295554
13-0.213136-2.33480.010608
14-0.01308-0.14330.443152
150.0472990.51810.302659
16-0.037036-0.40570.342838
17-0.057735-0.63250.264147
18-0.002977-0.03260.487019
190.0993651.08850.13928
20-0.027602-0.30240.381449
21-0.043225-0.47350.318356
22-0.020599-0.22560.41093
230.0073980.0810.467772
240.0224580.2460.403044
25-0.136898-1.49960.068167
26-0.007155-0.07840.46883
270.0099710.10920.456601
28-0.028791-0.31540.376507
29-0.034903-0.38230.35144
300.02350.25740.398644
310.0611950.67040.251959
32-0.030091-0.32960.371128
33-0.032593-0.3570.360845
34-0.023979-0.26270.396624
35-0.019315-0.21160.416395
36-0.001055-0.01160.4954
37-0.078659-0.86170.195294
38-0.010701-0.11720.453438
39-0.006315-0.06920.472484
40-0.016418-0.17980.428787
41-0.023249-0.25470.399702
420.0368770.4040.343479
430.0225840.24740.402515
44-0.033431-0.36620.357423
45-0.02503-0.27420.392204
46-0.005398-0.05910.476471
47-0.012919-0.14150.443846
480.0002220.00240.499033
49-0.042874-0.46970.319725
50-0.035357-0.38730.349605
51-0.015484-0.16960.432799
52-0.013318-0.14590.442127
53-0.019511-0.21370.415559
540.0140290.15370.439061
550.0088720.09720.46137
56-0.026632-0.29170.385497
570.0001390.00150.499394
580.015980.17510.430667
59-0.002549-0.02790.488883
600.0056440.06180.475403


Parameters (Session):
par1 = 60 ; par2 = 1 ; par3 = 0 ; par4 = 0 ; par5 = 12 ; par6 = White Noise ; par7 = 0.95 ;
Parameters (R input):
par1 = 60 ; par2 = 1 ; par3 = 0 ; par4 = 0 ; par5 = 12 ; par6 = White Noise ; par7 = 0.95 ; par8 = ;
R code (references can be found in the software module):
if (par1 == 'Default') {
par1 = 10*log10(length(x))
} else {
par1 <- as.numeric(par1)
}
par2 <- as.numeric(par2)
par3 <- as.numeric(par3)
par4 <- as.numeric(par4)
par5 <- as.numeric(par5)
if (par6 == 'White Noise') par6 <- 'white' else par6 <- 'ma'
par7 <- as.numeric(par7)
if (par8 != '') par8 <- as.numeric(par8)
ox <- x
if (par8 == '') {
if (par2 == 0) {
x <- log(x)
} else {
x <- (x ^ par2 - 1) / par2
}
} else {
x <- log(x,base=par8)
}
if (par3 > 0) x <- diff(x,lag=1,difference=par3)
if (par4 > 0) x <- diff(x,lag=par5,difference=par4)
bitmap(file='picts.png')
op <- par(mfrow=c(2,1))
plot(ox,type='l',main='Original Time Series',xlab='time',ylab='value')
if (par8=='') {
mytitle <- paste('Working Time Series (lambda=',par2,', d=',par3,', D=',par4,')',sep='')
mysub <- paste('(lambda=',par2,', d=',par3,', D=',par4,', CI=', par7, ', CI type=',par6,')',sep='')
} else {
mytitle <- paste('Working Time Series (base=',par8,', d=',par3,', D=',par4,')',sep='')
mysub <- paste('(base=',par8,', d=',par3,', D=',par4,', CI=', par7, ', CI type=',par6,')',sep='')
}
plot(x,type='l', main=mytitle,xlab='time',ylab='value')
par(op)
dev.off()
bitmap(file='pic1.png')
racf <- acf(x, par1, main='Autocorrelation', xlab='time lag', ylab='ACF', ci.type=par6, ci=par7, sub=mysub)
dev.off()
bitmap(file='pic2.png')
rpacf <- pacf(x,par1,main='Partial Autocorrelation',xlab='lags',ylab='PACF',sub=mysub)
dev.off()
(myacf <- c(racf$acf))
(mypacf <- c(rpacf$acf))
lengthx <- length(x)
sqrtn <- sqrt(lengthx)
load(file='createtable')
a<-table.start()
a<-table.row.start(a)
a<-table.element(a,'Autocorrelation Function',4,TRUE)
a<-table.row.end(a)
a<-table.row.start(a)
a<-table.element(a,'Time lag k',header=TRUE)
a<-table.element(a,hyperlink('basics.htm','ACF(k)','click here for more information about the Autocorrelation Function'),header=TRUE)
a<-table.element(a,'T-STAT',header=TRUE)
a<-table.element(a,'P-value',header=TRUE)
a<-table.row.end(a)
for (i in 2:(par1+1)) {
a<-table.row.start(a)
a<-table.element(a,i-1,header=TRUE)
a<-table.element(a,round(myacf[i],6))
mytstat <- myacf[i]*sqrtn
a<-table.element(a,round(mytstat,4))
a<-table.element(a,round(1-pt(abs(mytstat),lengthx),6))
a<-table.row.end(a)
}
a<-table.end(a)
table.save(a,file='mytable.tab')
a<-table.start()
a<-table.row.start(a)
a<-table.element(a,'Partial Autocorrelation Function',4,TRUE)
a<-table.row.end(a)
a<-table.row.start(a)
a<-table.element(a,'Time lag k',header=TRUE)
a<-table.element(a,hyperlink('basics.htm','PACF(k)','click here for more information about the Partial Autocorrelation Function'),header=TRUE)
a<-table.element(a,'T-STAT',header=TRUE)
a<-table.element(a,'P-value',header=TRUE)
a<-table.row.end(a)
for (i in 1:par1) {
a<-table.row.start(a)
a<-table.element(a,i,header=TRUE)
a<-table.element(a,round(mypacf[i],6))
mytstat <- mypacf[i]*sqrtn
a<-table.element(a,round(mytstat,4))
a<-table.element(a,round(1-pt(abs(mytstat),lengthx),6))
a<-table.row.end(a)
}
a<-table.end(a)
table.save(a,file='mytable1.tab')