Free Statistics

of Irreproducible Research!

Author's title

Author*Unverified author*
R Software Modulerwasp_autocorrelation.wasp
Title produced by software(Partial) Autocorrelation Function
Date of computationMon, 28 Jul 2014 12:59:39 +0100
Cite this page as followsStatistical Computations at FreeStatistics.org, Office for Research Development and Education, URL https://freestatistics.org/blog/index.php?v=date/2014/Jul/28/t1406548864exrihhse1orywqj.htm/, Retrieved Mon, 13 May 2024 22:34:17 +0000
Statistical Computations at FreeStatistics.org, Office for Research Development and Education, URL https://freestatistics.org/blog/index.php?pk=235354, Retrieved Mon, 13 May 2024 22:34:17 +0000
QR Codes:

Original text written by user:
IsPrivate?No (this computation is public)
User-defined keywords
Estimated Impact208
Family? (F = Feedback message, R = changed R code, M = changed R Module, P = changed Parameters, D = changed Data)
-       [(Partial) Autocorrelation Function] [] [2014-07-28 11:59:39] [d41d8cd98f00b204e9800998ecf8427e] [Current]
Feedback Forum

Post a new message
Dataseries X:
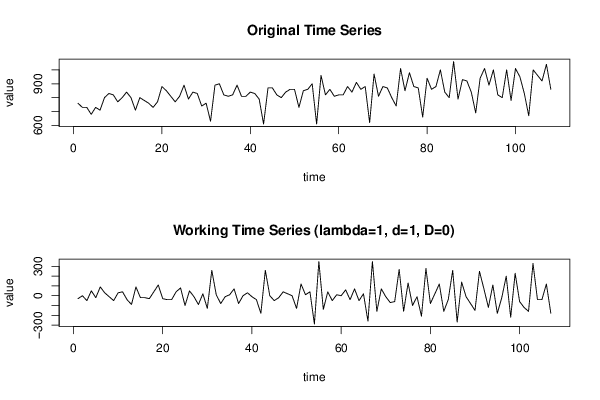
760
730
730
680
730
710
800
830
820
770
800
840
800
710
800
780
760
730
770
880
850
810
770
810
890
790
840
830
740
760
630
890
900
820
810
820
890
810
810
840
830
790
610
870
870
820
800
840
860
860
730
850
860
900
610
960
820
860
810
820
820
880
840
910
860
880
620
970
810
880
870
800
740
1010
850
980
880
870
660
940
860
880
1000
840
800
1060
790
930
920
840
690
940
1010
890
1000
820
800
1000
780
1010
950
830
670
1000
960
920
1040
860


Summary of computational transaction
Raw Inputview raw input (R code)
Raw Outputview raw output of R engine
Computing time1 seconds
R Server'Herman Ole Andreas Wold' @ wold.wessa.net

\begin{tabular}{lllllllll}
\hline
Summary of computational transaction \tabularnewline
Raw Input & view raw input (R code)  \tabularnewline
Raw Output & view raw output of R engine  \tabularnewline
Computing time & 1 seconds \tabularnewline
R Server & 'Herman Ole Andreas Wold' @ wold.wessa.net \tabularnewline
\hline
\end{tabular}
%Source: https://freestatistics.org/blog/index.php?pk=235354&T=0

[TABLE]
[ROW][C]Summary of computational transaction[/C][/ROW]
[ROW][C]Raw Input[/C][C]view raw input (R code) [/C][/ROW]
[ROW][C]Raw Output[/C][C]view raw output of R engine [/C][/ROW]
[ROW][C]Computing time[/C][C]1 seconds[/C][/ROW]
[ROW][C]R Server[/C][C]'Herman Ole Andreas Wold' @ wold.wessa.net[/C][/ROW]
[/TABLE]
Source: https://freestatistics.org/blog/index.php?pk=235354&T=0

Globally Unique Identifier (entire table): ba.freestatistics.org/blog/index.php?pk=235354&T=0

As an alternative you can also use a QR Code:  

The GUIDs for individual cells are displayed in the table below:

Summary of computational transaction
Raw Inputview raw input (R code)
Raw Outputview raw output of R engine
Computing time1 seconds
R Server'Herman Ole Andreas Wold' @ wold.wessa.net


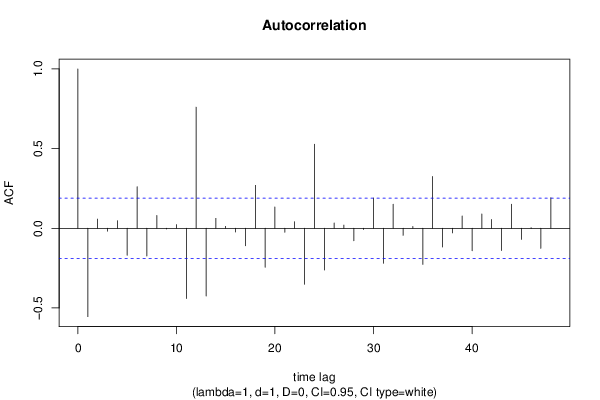
Autocorrelation Function
Time lag kACF(k)T-STATP-value
1-0.554676-5.73760
20.0576810.59670.275999
3-0.017838-0.18450.426979
40.0476850.49330.311422
5-0.168951-1.74760.041698
60.2611412.70130.004017
7-0.173985-1.79970.037362
80.0799150.82660.205138
9-0.005128-0.0530.478896
100.0230360.23830.406057
11-0.440749-4.55917e-06
120.7602047.86360
13-0.424717-4.39331.3e-05
140.0621640.6430.26079
150.0122120.12630.449858
16-0.023535-0.24350.404061
17-0.109411-1.13180.130134
180.2693612.78630.003154
19-0.244527-2.52940.006441
200.1332011.37780.085564
21-0.024683-0.25530.399483
220.0411820.4260.335487
23-0.351196-3.63280.000216
240.5269995.45130
25-0.262081-2.7110.003908
260.0335780.34730.364513
270.0198760.20560.418747
28-0.078719-0.81430.208649
29-0.007639-0.0790.468582
300.1900411.96580.025957
31-0.219312-2.26860.01265
320.1504841.55660.061257
33-0.044393-0.45920.323509
340.0116490.12050.452155
35-0.226727-2.34530.010428
360.3252863.36480.000532
37-0.117152-1.21180.114124
38-0.028891-0.29880.382818
390.0771160.79770.213407
40-0.140741-1.45580.074183
410.0891330.9220.179302
420.0547180.5660.286287
43-0.139867-1.44680.075439
440.1509541.56150.060681
45-0.069702-0.7210.236239
460.0039160.04050.483883
47-0.125986-1.30320.09765
480.1920571.98670.024759

\begin{tabular}{lllllllll}
\hline
Autocorrelation Function \tabularnewline
Time lag k & ACF(k) & T-STAT & P-value \tabularnewline
1 & -0.554676 & -5.7376 & 0 \tabularnewline
2 & 0.057681 & 0.5967 & 0.275999 \tabularnewline
3 & -0.017838 & -0.1845 & 0.426979 \tabularnewline
4 & 0.047685 & 0.4933 & 0.311422 \tabularnewline
5 & -0.168951 & -1.7476 & 0.041698 \tabularnewline
6 & 0.261141 & 2.7013 & 0.004017 \tabularnewline
7 & -0.173985 & -1.7997 & 0.037362 \tabularnewline
8 & 0.079915 & 0.8266 & 0.205138 \tabularnewline
9 & -0.005128 & -0.053 & 0.478896 \tabularnewline
10 & 0.023036 & 0.2383 & 0.406057 \tabularnewline
11 & -0.440749 & -4.5591 & 7e-06 \tabularnewline
12 & 0.760204 & 7.8636 & 0 \tabularnewline
13 & -0.424717 & -4.3933 & 1.3e-05 \tabularnewline
14 & 0.062164 & 0.643 & 0.26079 \tabularnewline
15 & 0.012212 & 0.1263 & 0.449858 \tabularnewline
16 & -0.023535 & -0.2435 & 0.404061 \tabularnewline
17 & -0.109411 & -1.1318 & 0.130134 \tabularnewline
18 & 0.269361 & 2.7863 & 0.003154 \tabularnewline
19 & -0.244527 & -2.5294 & 0.006441 \tabularnewline
20 & 0.133201 & 1.3778 & 0.085564 \tabularnewline
21 & -0.024683 & -0.2553 & 0.399483 \tabularnewline
22 & 0.041182 & 0.426 & 0.335487 \tabularnewline
23 & -0.351196 & -3.6328 & 0.000216 \tabularnewline
24 & 0.526999 & 5.4513 & 0 \tabularnewline
25 & -0.262081 & -2.711 & 0.003908 \tabularnewline
26 & 0.033578 & 0.3473 & 0.364513 \tabularnewline
27 & 0.019876 & 0.2056 & 0.418747 \tabularnewline
28 & -0.078719 & -0.8143 & 0.208649 \tabularnewline
29 & -0.007639 & -0.079 & 0.468582 \tabularnewline
30 & 0.190041 & 1.9658 & 0.025957 \tabularnewline
31 & -0.219312 & -2.2686 & 0.01265 \tabularnewline
32 & 0.150484 & 1.5566 & 0.061257 \tabularnewline
33 & -0.044393 & -0.4592 & 0.323509 \tabularnewline
34 & 0.011649 & 0.1205 & 0.452155 \tabularnewline
35 & -0.226727 & -2.3453 & 0.010428 \tabularnewline
36 & 0.325286 & 3.3648 & 0.000532 \tabularnewline
37 & -0.117152 & -1.2118 & 0.114124 \tabularnewline
38 & -0.028891 & -0.2988 & 0.382818 \tabularnewline
39 & 0.077116 & 0.7977 & 0.213407 \tabularnewline
40 & -0.140741 & -1.4558 & 0.074183 \tabularnewline
41 & 0.089133 & 0.922 & 0.179302 \tabularnewline
42 & 0.054718 & 0.566 & 0.286287 \tabularnewline
43 & -0.139867 & -1.4468 & 0.075439 \tabularnewline
44 & 0.150954 & 1.5615 & 0.060681 \tabularnewline
45 & -0.069702 & -0.721 & 0.236239 \tabularnewline
46 & 0.003916 & 0.0405 & 0.483883 \tabularnewline
47 & -0.125986 & -1.3032 & 0.09765 \tabularnewline
48 & 0.192057 & 1.9867 & 0.024759 \tabularnewline
\hline
\end{tabular}
%Source: https://freestatistics.org/blog/index.php?pk=235354&T=1

[TABLE]
[ROW][C]Autocorrelation Function[/C][/ROW]
[ROW][C]Time lag k[/C][C]ACF(k)[/C][C]T-STAT[/C][C]P-value[/C][/ROW]
[ROW][C]1[/C][C]-0.554676[/C][C]-5.7376[/C][C]0[/C][/ROW]
[ROW][C]2[/C][C]0.057681[/C][C]0.5967[/C][C]0.275999[/C][/ROW]
[ROW][C]3[/C][C]-0.017838[/C][C]-0.1845[/C][C]0.426979[/C][/ROW]
[ROW][C]4[/C][C]0.047685[/C][C]0.4933[/C][C]0.311422[/C][/ROW]
[ROW][C]5[/C][C]-0.168951[/C][C]-1.7476[/C][C]0.041698[/C][/ROW]
[ROW][C]6[/C][C]0.261141[/C][C]2.7013[/C][C]0.004017[/C][/ROW]
[ROW][C]7[/C][C]-0.173985[/C][C]-1.7997[/C][C]0.037362[/C][/ROW]
[ROW][C]8[/C][C]0.079915[/C][C]0.8266[/C][C]0.205138[/C][/ROW]
[ROW][C]9[/C][C]-0.005128[/C][C]-0.053[/C][C]0.478896[/C][/ROW]
[ROW][C]10[/C][C]0.023036[/C][C]0.2383[/C][C]0.406057[/C][/ROW]
[ROW][C]11[/C][C]-0.440749[/C][C]-4.5591[/C][C]7e-06[/C][/ROW]
[ROW][C]12[/C][C]0.760204[/C][C]7.8636[/C][C]0[/C][/ROW]
[ROW][C]13[/C][C]-0.424717[/C][C]-4.3933[/C][C]1.3e-05[/C][/ROW]
[ROW][C]14[/C][C]0.062164[/C][C]0.643[/C][C]0.26079[/C][/ROW]
[ROW][C]15[/C][C]0.012212[/C][C]0.1263[/C][C]0.449858[/C][/ROW]
[ROW][C]16[/C][C]-0.023535[/C][C]-0.2435[/C][C]0.404061[/C][/ROW]
[ROW][C]17[/C][C]-0.109411[/C][C]-1.1318[/C][C]0.130134[/C][/ROW]
[ROW][C]18[/C][C]0.269361[/C][C]2.7863[/C][C]0.003154[/C][/ROW]
[ROW][C]19[/C][C]-0.244527[/C][C]-2.5294[/C][C]0.006441[/C][/ROW]
[ROW][C]20[/C][C]0.133201[/C][C]1.3778[/C][C]0.085564[/C][/ROW]
[ROW][C]21[/C][C]-0.024683[/C][C]-0.2553[/C][C]0.399483[/C][/ROW]
[ROW][C]22[/C][C]0.041182[/C][C]0.426[/C][C]0.335487[/C][/ROW]
[ROW][C]23[/C][C]-0.351196[/C][C]-3.6328[/C][C]0.000216[/C][/ROW]
[ROW][C]24[/C][C]0.526999[/C][C]5.4513[/C][C]0[/C][/ROW]
[ROW][C]25[/C][C]-0.262081[/C][C]-2.711[/C][C]0.003908[/C][/ROW]
[ROW][C]26[/C][C]0.033578[/C][C]0.3473[/C][C]0.364513[/C][/ROW]
[ROW][C]27[/C][C]0.019876[/C][C]0.2056[/C][C]0.418747[/C][/ROW]
[ROW][C]28[/C][C]-0.078719[/C][C]-0.8143[/C][C]0.208649[/C][/ROW]
[ROW][C]29[/C][C]-0.007639[/C][C]-0.079[/C][C]0.468582[/C][/ROW]
[ROW][C]30[/C][C]0.190041[/C][C]1.9658[/C][C]0.025957[/C][/ROW]
[ROW][C]31[/C][C]-0.219312[/C][C]-2.2686[/C][C]0.01265[/C][/ROW]
[ROW][C]32[/C][C]0.150484[/C][C]1.5566[/C][C]0.061257[/C][/ROW]
[ROW][C]33[/C][C]-0.044393[/C][C]-0.4592[/C][C]0.323509[/C][/ROW]
[ROW][C]34[/C][C]0.011649[/C][C]0.1205[/C][C]0.452155[/C][/ROW]
[ROW][C]35[/C][C]-0.226727[/C][C]-2.3453[/C][C]0.010428[/C][/ROW]
[ROW][C]36[/C][C]0.325286[/C][C]3.3648[/C][C]0.000532[/C][/ROW]
[ROW][C]37[/C][C]-0.117152[/C][C]-1.2118[/C][C]0.114124[/C][/ROW]
[ROW][C]38[/C][C]-0.028891[/C][C]-0.2988[/C][C]0.382818[/C][/ROW]
[ROW][C]39[/C][C]0.077116[/C][C]0.7977[/C][C]0.213407[/C][/ROW]
[ROW][C]40[/C][C]-0.140741[/C][C]-1.4558[/C][C]0.074183[/C][/ROW]
[ROW][C]41[/C][C]0.089133[/C][C]0.922[/C][C]0.179302[/C][/ROW]
[ROW][C]42[/C][C]0.054718[/C][C]0.566[/C][C]0.286287[/C][/ROW]
[ROW][C]43[/C][C]-0.139867[/C][C]-1.4468[/C][C]0.075439[/C][/ROW]
[ROW][C]44[/C][C]0.150954[/C][C]1.5615[/C][C]0.060681[/C][/ROW]
[ROW][C]45[/C][C]-0.069702[/C][C]-0.721[/C][C]0.236239[/C][/ROW]
[ROW][C]46[/C][C]0.003916[/C][C]0.0405[/C][C]0.483883[/C][/ROW]
[ROW][C]47[/C][C]-0.125986[/C][C]-1.3032[/C][C]0.09765[/C][/ROW]
[ROW][C]48[/C][C]0.192057[/C][C]1.9867[/C][C]0.024759[/C][/ROW]
[/TABLE]
Source: https://freestatistics.org/blog/index.php?pk=235354&T=1

Globally Unique Identifier (entire table): ba.freestatistics.org/blog/index.php?pk=235354&T=1

As an alternative you can also use a QR Code:  

The GUIDs for individual cells are displayed in the table below:

Autocorrelation Function
Time lag kACF(k)T-STATP-value
1-0.554676-5.73760
20.0576810.59670.275999
3-0.017838-0.18450.426979
40.0476850.49330.311422
5-0.168951-1.74760.041698
60.2611412.70130.004017
7-0.173985-1.79970.037362
80.0799150.82660.205138
9-0.005128-0.0530.478896
100.0230360.23830.406057
11-0.440749-4.55917e-06
120.7602047.86360
13-0.424717-4.39331.3e-05
140.0621640.6430.26079
150.0122120.12630.449858
16-0.023535-0.24350.404061
17-0.109411-1.13180.130134
180.2693612.78630.003154
19-0.244527-2.52940.006441
200.1332011.37780.085564
21-0.024683-0.25530.399483
220.0411820.4260.335487
23-0.351196-3.63280.000216
240.5269995.45130
25-0.262081-2.7110.003908
260.0335780.34730.364513
270.0198760.20560.418747
28-0.078719-0.81430.208649
29-0.007639-0.0790.468582
300.1900411.96580.025957
31-0.219312-2.26860.01265
320.1504841.55660.061257
33-0.044393-0.45920.323509
340.0116490.12050.452155
35-0.226727-2.34530.010428
360.3252863.36480.000532
37-0.117152-1.21180.114124
38-0.028891-0.29880.382818
390.0771160.79770.213407
40-0.140741-1.45580.074183
410.0891330.9220.179302
420.0547180.5660.286287
43-0.139867-1.44680.075439
440.1509541.56150.060681
45-0.069702-0.7210.236239
460.0039160.04050.483883
47-0.125986-1.30320.09765
480.1920571.98670.024759


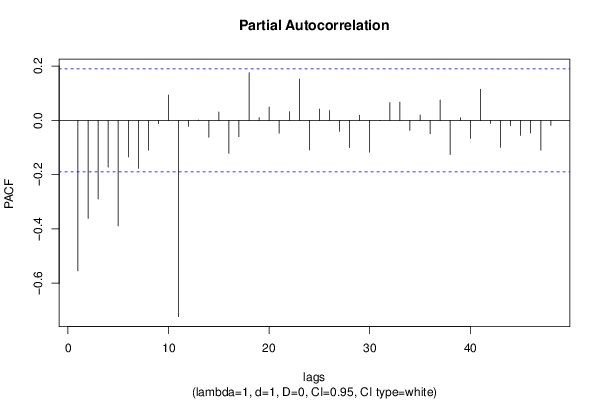
Partial Autocorrelation Function
Time lag kPACF(k)T-STATP-value
1-0.554676-5.73760
2-0.361075-3.7350.000151
3-0.289951-2.99930.001683
4-0.172317-1.78250.038755
5-0.388756-4.02135.4e-05
6-0.134607-1.39240.083347
7-0.177073-1.83170.034892
8-0.109608-1.13380.129707
9-0.012169-0.12590.450033
100.0935930.96810.16758
11-0.723276-7.48160
12-0.021447-0.22180.412428
130.0009510.00980.496086
14-0.061962-0.64090.261466
150.0310640.32130.374296
16-0.121669-1.25860.105465
17-0.05997-0.62030.268178
180.1753241.81360.036273
190.010160.10510.458248
200.0487610.50440.307515
21-0.047749-0.49390.311186
220.0316460.32730.372022
230.1524241.57670.05891
24-0.108841-1.12590.131372
250.0417620.4320.333309
260.035940.37180.355401
27-0.040632-0.42030.337555
28-0.100042-1.03480.151538
290.0191820.19840.421548
30-0.117098-1.21130.11423
31-0.001086-0.01120.495529
320.0654560.67710.249909
330.0672720.69590.244009
34-0.036904-0.38170.351705
350.0201050.2080.417826
36-0.049175-0.50870.306015
370.0748920.77470.220117
38-0.126069-1.30410.097504
390.0091610.09480.462339
40-0.067034-0.69340.244779
410.1147641.18710.118903
42-0.011293-0.11680.453613
43-0.099481-1.0290.152891
44-0.019459-0.20130.42043
45-0.055391-0.5730.283935
46-0.046431-0.48030.316004
47-0.109964-1.13750.12894
48-0.018615-0.19260.423835

\begin{tabular}{lllllllll}
\hline
Partial Autocorrelation Function \tabularnewline
Time lag k & PACF(k) & T-STAT & P-value \tabularnewline
1 & -0.554676 & -5.7376 & 0 \tabularnewline
2 & -0.361075 & -3.735 & 0.000151 \tabularnewline
3 & -0.289951 & -2.9993 & 0.001683 \tabularnewline
4 & -0.172317 & -1.7825 & 0.038755 \tabularnewline
5 & -0.388756 & -4.0213 & 5.4e-05 \tabularnewline
6 & -0.134607 & -1.3924 & 0.083347 \tabularnewline
7 & -0.177073 & -1.8317 & 0.034892 \tabularnewline
8 & -0.109608 & -1.1338 & 0.129707 \tabularnewline
9 & -0.012169 & -0.1259 & 0.450033 \tabularnewline
10 & 0.093593 & 0.9681 & 0.16758 \tabularnewline
11 & -0.723276 & -7.4816 & 0 \tabularnewline
12 & -0.021447 & -0.2218 & 0.412428 \tabularnewline
13 & 0.000951 & 0.0098 & 0.496086 \tabularnewline
14 & -0.061962 & -0.6409 & 0.261466 \tabularnewline
15 & 0.031064 & 0.3213 & 0.374296 \tabularnewline
16 & -0.121669 & -1.2586 & 0.105465 \tabularnewline
17 & -0.05997 & -0.6203 & 0.268178 \tabularnewline
18 & 0.175324 & 1.8136 & 0.036273 \tabularnewline
19 & 0.01016 & 0.1051 & 0.458248 \tabularnewline
20 & 0.048761 & 0.5044 & 0.307515 \tabularnewline
21 & -0.047749 & -0.4939 & 0.311186 \tabularnewline
22 & 0.031646 & 0.3273 & 0.372022 \tabularnewline
23 & 0.152424 & 1.5767 & 0.05891 \tabularnewline
24 & -0.108841 & -1.1259 & 0.131372 \tabularnewline
25 & 0.041762 & 0.432 & 0.333309 \tabularnewline
26 & 0.03594 & 0.3718 & 0.355401 \tabularnewline
27 & -0.040632 & -0.4203 & 0.337555 \tabularnewline
28 & -0.100042 & -1.0348 & 0.151538 \tabularnewline
29 & 0.019182 & 0.1984 & 0.421548 \tabularnewline
30 & -0.117098 & -1.2113 & 0.11423 \tabularnewline
31 & -0.001086 & -0.0112 & 0.495529 \tabularnewline
32 & 0.065456 & 0.6771 & 0.249909 \tabularnewline
33 & 0.067272 & 0.6959 & 0.244009 \tabularnewline
34 & -0.036904 & -0.3817 & 0.351705 \tabularnewline
35 & 0.020105 & 0.208 & 0.417826 \tabularnewline
36 & -0.049175 & -0.5087 & 0.306015 \tabularnewline
37 & 0.074892 & 0.7747 & 0.220117 \tabularnewline
38 & -0.126069 & -1.3041 & 0.097504 \tabularnewline
39 & 0.009161 & 0.0948 & 0.462339 \tabularnewline
40 & -0.067034 & -0.6934 & 0.244779 \tabularnewline
41 & 0.114764 & 1.1871 & 0.118903 \tabularnewline
42 & -0.011293 & -0.1168 & 0.453613 \tabularnewline
43 & -0.099481 & -1.029 & 0.152891 \tabularnewline
44 & -0.019459 & -0.2013 & 0.42043 \tabularnewline
45 & -0.055391 & -0.573 & 0.283935 \tabularnewline
46 & -0.046431 & -0.4803 & 0.316004 \tabularnewline
47 & -0.109964 & -1.1375 & 0.12894 \tabularnewline
48 & -0.018615 & -0.1926 & 0.423835 \tabularnewline
\hline
\end{tabular}
%Source: https://freestatistics.org/blog/index.php?pk=235354&T=2

[TABLE]
[ROW][C]Partial Autocorrelation Function[/C][/ROW]
[ROW][C]Time lag k[/C][C]PACF(k)[/C][C]T-STAT[/C][C]P-value[/C][/ROW]
[ROW][C]1[/C][C]-0.554676[/C][C]-5.7376[/C][C]0[/C][/ROW]
[ROW][C]2[/C][C]-0.361075[/C][C]-3.735[/C][C]0.000151[/C][/ROW]
[ROW][C]3[/C][C]-0.289951[/C][C]-2.9993[/C][C]0.001683[/C][/ROW]
[ROW][C]4[/C][C]-0.172317[/C][C]-1.7825[/C][C]0.038755[/C][/ROW]
[ROW][C]5[/C][C]-0.388756[/C][C]-4.0213[/C][C]5.4e-05[/C][/ROW]
[ROW][C]6[/C][C]-0.134607[/C][C]-1.3924[/C][C]0.083347[/C][/ROW]
[ROW][C]7[/C][C]-0.177073[/C][C]-1.8317[/C][C]0.034892[/C][/ROW]
[ROW][C]8[/C][C]-0.109608[/C][C]-1.1338[/C][C]0.129707[/C][/ROW]
[ROW][C]9[/C][C]-0.012169[/C][C]-0.1259[/C][C]0.450033[/C][/ROW]
[ROW][C]10[/C][C]0.093593[/C][C]0.9681[/C][C]0.16758[/C][/ROW]
[ROW][C]11[/C][C]-0.723276[/C][C]-7.4816[/C][C]0[/C][/ROW]
[ROW][C]12[/C][C]-0.021447[/C][C]-0.2218[/C][C]0.412428[/C][/ROW]
[ROW][C]13[/C][C]0.000951[/C][C]0.0098[/C][C]0.496086[/C][/ROW]
[ROW][C]14[/C][C]-0.061962[/C][C]-0.6409[/C][C]0.261466[/C][/ROW]
[ROW][C]15[/C][C]0.031064[/C][C]0.3213[/C][C]0.374296[/C][/ROW]
[ROW][C]16[/C][C]-0.121669[/C][C]-1.2586[/C][C]0.105465[/C][/ROW]
[ROW][C]17[/C][C]-0.05997[/C][C]-0.6203[/C][C]0.268178[/C][/ROW]
[ROW][C]18[/C][C]0.175324[/C][C]1.8136[/C][C]0.036273[/C][/ROW]
[ROW][C]19[/C][C]0.01016[/C][C]0.1051[/C][C]0.458248[/C][/ROW]
[ROW][C]20[/C][C]0.048761[/C][C]0.5044[/C][C]0.307515[/C][/ROW]
[ROW][C]21[/C][C]-0.047749[/C][C]-0.4939[/C][C]0.311186[/C][/ROW]
[ROW][C]22[/C][C]0.031646[/C][C]0.3273[/C][C]0.372022[/C][/ROW]
[ROW][C]23[/C][C]0.152424[/C][C]1.5767[/C][C]0.05891[/C][/ROW]
[ROW][C]24[/C][C]-0.108841[/C][C]-1.1259[/C][C]0.131372[/C][/ROW]
[ROW][C]25[/C][C]0.041762[/C][C]0.432[/C][C]0.333309[/C][/ROW]
[ROW][C]26[/C][C]0.03594[/C][C]0.3718[/C][C]0.355401[/C][/ROW]
[ROW][C]27[/C][C]-0.040632[/C][C]-0.4203[/C][C]0.337555[/C][/ROW]
[ROW][C]28[/C][C]-0.100042[/C][C]-1.0348[/C][C]0.151538[/C][/ROW]
[ROW][C]29[/C][C]0.019182[/C][C]0.1984[/C][C]0.421548[/C][/ROW]
[ROW][C]30[/C][C]-0.117098[/C][C]-1.2113[/C][C]0.11423[/C][/ROW]
[ROW][C]31[/C][C]-0.001086[/C][C]-0.0112[/C][C]0.495529[/C][/ROW]
[ROW][C]32[/C][C]0.065456[/C][C]0.6771[/C][C]0.249909[/C][/ROW]
[ROW][C]33[/C][C]0.067272[/C][C]0.6959[/C][C]0.244009[/C][/ROW]
[ROW][C]34[/C][C]-0.036904[/C][C]-0.3817[/C][C]0.351705[/C][/ROW]
[ROW][C]35[/C][C]0.020105[/C][C]0.208[/C][C]0.417826[/C][/ROW]
[ROW][C]36[/C][C]-0.049175[/C][C]-0.5087[/C][C]0.306015[/C][/ROW]
[ROW][C]37[/C][C]0.074892[/C][C]0.7747[/C][C]0.220117[/C][/ROW]
[ROW][C]38[/C][C]-0.126069[/C][C]-1.3041[/C][C]0.097504[/C][/ROW]
[ROW][C]39[/C][C]0.009161[/C][C]0.0948[/C][C]0.462339[/C][/ROW]
[ROW][C]40[/C][C]-0.067034[/C][C]-0.6934[/C][C]0.244779[/C][/ROW]
[ROW][C]41[/C][C]0.114764[/C][C]1.1871[/C][C]0.118903[/C][/ROW]
[ROW][C]42[/C][C]-0.011293[/C][C]-0.1168[/C][C]0.453613[/C][/ROW]
[ROW][C]43[/C][C]-0.099481[/C][C]-1.029[/C][C]0.152891[/C][/ROW]
[ROW][C]44[/C][C]-0.019459[/C][C]-0.2013[/C][C]0.42043[/C][/ROW]
[ROW][C]45[/C][C]-0.055391[/C][C]-0.573[/C][C]0.283935[/C][/ROW]
[ROW][C]46[/C][C]-0.046431[/C][C]-0.4803[/C][C]0.316004[/C][/ROW]
[ROW][C]47[/C][C]-0.109964[/C][C]-1.1375[/C][C]0.12894[/C][/ROW]
[ROW][C]48[/C][C]-0.018615[/C][C]-0.1926[/C][C]0.423835[/C][/ROW]
[/TABLE]
Source: https://freestatistics.org/blog/index.php?pk=235354&T=2

Globally Unique Identifier (entire table): ba.freestatistics.org/blog/index.php?pk=235354&T=2

As an alternative you can also use a QR Code:  

The GUIDs for individual cells are displayed in the table below:

Partial Autocorrelation Function
Time lag kPACF(k)T-STATP-value
1-0.554676-5.73760
2-0.361075-3.7350.000151
3-0.289951-2.99930.001683
4-0.172317-1.78250.038755
5-0.388756-4.02135.4e-05
6-0.134607-1.39240.083347
7-0.177073-1.83170.034892
8-0.109608-1.13380.129707
9-0.012169-0.12590.450033
100.0935930.96810.16758
11-0.723276-7.48160
12-0.021447-0.22180.412428
130.0009510.00980.496086
14-0.061962-0.64090.261466
150.0310640.32130.374296
16-0.121669-1.25860.105465
17-0.05997-0.62030.268178
180.1753241.81360.036273
190.010160.10510.458248
200.0487610.50440.307515
21-0.047749-0.49390.311186
220.0316460.32730.372022
230.1524241.57670.05891
24-0.108841-1.12590.131372
250.0417620.4320.333309
260.035940.37180.355401
27-0.040632-0.42030.337555
28-0.100042-1.03480.151538
290.0191820.19840.421548
30-0.117098-1.21130.11423
31-0.001086-0.01120.495529
320.0654560.67710.249909
330.0672720.69590.244009
34-0.036904-0.38170.351705
350.0201050.2080.417826
36-0.049175-0.50870.306015
370.0748920.77470.220117
38-0.126069-1.30410.097504
390.0091610.09480.462339
40-0.067034-0.69340.244779
410.1147641.18710.118903
42-0.011293-0.11680.453613
43-0.099481-1.0290.152891
44-0.019459-0.20130.42043
45-0.055391-0.5730.283935
46-0.046431-0.48030.316004
47-0.109964-1.13750.12894
48-0.018615-0.19260.423835


Parameters (Session):
par1 = 48 ; par2 = 1 ; par3 = 1 ; par4 = 0 ; par5 = 12 ; par6 = White Noise ; par7 = 0.95 ;
Parameters (R input):
par1 = 48 ; par2 = 1 ; par3 = 1 ; par4 = 0 ; par5 = 12 ; par6 = White Noise ; par7 = 0.95 ; par8 = ;
R code (references can be found in the software module):
if (par1 == 'Default') {
par1 = 10*log10(length(x))
} else {
par1 <- as.numeric(par1)
}
par2 <- as.numeric(par2)
par3 <- as.numeric(par3)
par4 <- as.numeric(par4)
par5 <- as.numeric(par5)
if (par6 == 'White Noise') par6 <- 'white' else par6 <- 'ma'
par7 <- as.numeric(par7)
if (par8 != '') par8 <- as.numeric(par8)
ox <- x
if (par8 == '') {
if (par2 == 0) {
x <- log(x)
} else {
x <- (x ^ par2 - 1) / par2
}
} else {
x <- log(x,base=par8)
}
if (par3 > 0) x <- diff(x,lag=1,difference=par3)
if (par4 > 0) x <- diff(x,lag=par5,difference=par4)
bitmap(file='picts.png')
op <- par(mfrow=c(2,1))
plot(ox,type='l',main='Original Time Series',xlab='time',ylab='value')
if (par8=='') {
mytitle <- paste('Working Time Series (lambda=',par2,', d=',par3,', D=',par4,')',sep='')
mysub <- paste('(lambda=',par2,', d=',par3,', D=',par4,', CI=', par7, ', CI type=',par6,')',sep='')
} else {
mytitle <- paste('Working Time Series (base=',par8,', d=',par3,', D=',par4,')',sep='')
mysub <- paste('(base=',par8,', d=',par3,', D=',par4,', CI=', par7, ', CI type=',par6,')',sep='')
}
plot(x,type='l', main=mytitle,xlab='time',ylab='value')
par(op)
dev.off()
bitmap(file='pic1.png')
racf <- acf(x, par1, main='Autocorrelation', xlab='time lag', ylab='ACF', ci.type=par6, ci=par7, sub=mysub)
dev.off()
bitmap(file='pic2.png')
rpacf <- pacf(x,par1,main='Partial Autocorrelation',xlab='lags',ylab='PACF',sub=mysub)
dev.off()
(myacf <- c(racf$acf))
(mypacf <- c(rpacf$acf))
lengthx <- length(x)
sqrtn <- sqrt(lengthx)
load(file='createtable')
a<-table.start()
a<-table.row.start(a)
a<-table.element(a,'Autocorrelation Function',4,TRUE)
a<-table.row.end(a)
a<-table.row.start(a)
a<-table.element(a,'Time lag k',header=TRUE)
a<-table.element(a,hyperlink('basics.htm','ACF(k)','click here for more information about the Autocorrelation Function'),header=TRUE)
a<-table.element(a,'T-STAT',header=TRUE)
a<-table.element(a,'P-value',header=TRUE)
a<-table.row.end(a)
for (i in 2:(par1+1)) {
a<-table.row.start(a)
a<-table.element(a,i-1,header=TRUE)
a<-table.element(a,round(myacf[i],6))
mytstat <- myacf[i]*sqrtn
a<-table.element(a,round(mytstat,4))
a<-table.element(a,round(1-pt(abs(mytstat),lengthx),6))
a<-table.row.end(a)
}
a<-table.end(a)
table.save(a,file='mytable.tab')
a<-table.start()
a<-table.row.start(a)
a<-table.element(a,'Partial Autocorrelation Function',4,TRUE)
a<-table.row.end(a)
a<-table.row.start(a)
a<-table.element(a,'Time lag k',header=TRUE)
a<-table.element(a,hyperlink('basics.htm','PACF(k)','click here for more information about the Partial Autocorrelation Function'),header=TRUE)
a<-table.element(a,'T-STAT',header=TRUE)
a<-table.element(a,'P-value',header=TRUE)
a<-table.row.end(a)
for (i in 1:par1) {
a<-table.row.start(a)
a<-table.element(a,i,header=TRUE)
a<-table.element(a,round(mypacf[i],6))
mytstat <- mypacf[i]*sqrtn
a<-table.element(a,round(mytstat,4))
a<-table.element(a,round(1-pt(abs(mytstat),lengthx),6))
a<-table.row.end(a)
}
a<-table.end(a)
table.save(a,file='mytable1.tab')