Free Statistics
of Irreproducible Research!
Description of Statistical Computation | |||||||||||||||||||||||||||||||||||||||||
|---|---|---|---|---|---|---|---|---|---|---|---|---|---|---|---|---|---|---|---|---|---|---|---|---|---|---|---|---|---|---|---|---|---|---|---|---|---|---|---|---|---|
| Author's title | |||||||||||||||||||||||||||||||||||||||||
| Author | *Unverified author* | ||||||||||||||||||||||||||||||||||||||||
| R Software Module | rwasp_univariatedataseries.wasp | ||||||||||||||||||||||||||||||||||||||||
| Title produced by software | Univariate Data Series | ||||||||||||||||||||||||||||||||||||||||
| Date of computation | Fri, 31 Jan 2014 05:48:55 -0500 | ||||||||||||||||||||||||||||||||||||||||
| Cite this page as follows | Statistical Computations at FreeStatistics.org, Office for Research Development and Education, URL https://freestatistics.org/blog/index.php?v=date/2014/Jan/31/t1391165547vy5bomxe0uud0sn.htm/, Retrieved Sun, 19 May 2024 07:07:08 +0000 | ||||||||||||||||||||||||||||||||||||||||
| Statistical Computations at FreeStatistics.org, Office for Research Development and Education, URL https://freestatistics.org/blog/index.php?pk=233179, Retrieved Sun, 19 May 2024 07:07:08 +0000 | |||||||||||||||||||||||||||||||||||||||||
| QR Codes: | |||||||||||||||||||||||||||||||||||||||||
|
| |||||||||||||||||||||||||||||||||||||||||
| Original text written by user: | |||||||||||||||||||||||||||||||||||||||||
| IsPrivate? | No (this computation is public) | ||||||||||||||||||||||||||||||||||||||||
| User-defined keywords | |||||||||||||||||||||||||||||||||||||||||
| Estimated Impact | 181 | ||||||||||||||||||||||||||||||||||||||||
Tree of Dependent Computations | |||||||||||||||||||||||||||||||||||||||||
| Family? (F = Feedback message, R = changed R code, M = changed R Module, P = changed Parameters, D = changed Data) | |||||||||||||||||||||||||||||||||||||||||
| - [Univariate Data Series] [] [2014-01-31 10:48:55] [0a29af7e4d8d6424b8240e38ffd48a3a] [Current] - RMP [Histogram] [] [2014-02-09 16:43:08] [68b3e6320f252e1f50534bfc7f55de90] - RMP [Kernel Density Estimation] [] [2014-02-09 16:49:21] [68b3e6320f252e1f50534bfc7f55de90] - RMP [Histogram] [] [2014-02-09 16:50:47] [68b3e6320f252e1f50534bfc7f55de90] - RMP [Histogram] [] [2014-02-09 16:54:40] [68b3e6320f252e1f50534bfc7f55de90] - RMP [Quartiles] [] [2014-02-16 21:48:39] [68b3e6320f252e1f50534bfc7f55de90] - RMP [Notched Boxplots] [] [2014-02-16 21:52:54] [68b3e6320f252e1f50534bfc7f55de90] - RMPD [Harrell-Davis Quantiles] [] [2014-02-16 22:00:18] [68b3e6320f252e1f50534bfc7f55de90] - RMPD [Harrell-Davis Quantiles] [] [2014-02-16 22:03:48] [68b3e6320f252e1f50534bfc7f55de90] - RMPD [Harrell-Davis Quantiles] [] [2014-02-16 22:11:02] [68b3e6320f252e1f50534bfc7f55de90] - RMPD [Harrell-Davis Quantiles] [] [2014-02-16 22:13:43] [68b3e6320f252e1f50534bfc7f55de90] | |||||||||||||||||||||||||||||||||||||||||
| Feedback Forum | |||||||||||||||||||||||||||||||||||||||||
Post a new message | |||||||||||||||||||||||||||||||||||||||||
Dataset | |||||||||||||||||||||||||||||||||||||||||
| Dataseries X: | |||||||||||||||||||||||||||||||||||||||||
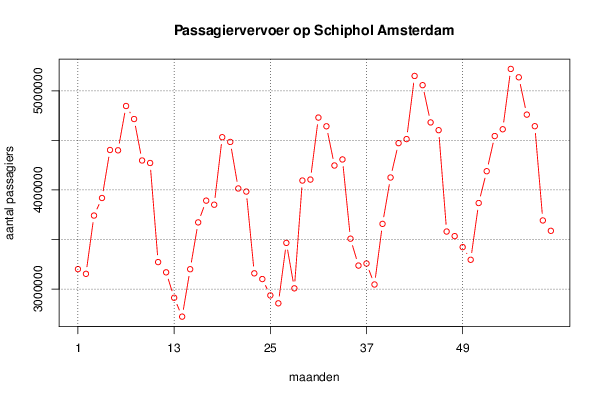
3200944 3153170 3741498 3918719 4403449 4400407 4847473 4716136 4297440 4272253 3271834 3168388 2911748 2720999 3199918 3672623 3892013 3850845 4532467 4484739 4014972 3983758 3158459 3100569 2935404 2855719 3465611 3006985 4095110 4104793 4730788 4642726 4246919 4308032 3508154 3236641 3257275 3045631 3657692 4125747 4472507 4513455 5150896 5057815 4681742 4603682 3580181 3534002 3422762 3295209 3868093 4189245 4544332 4612845 5221595 5137505 4760439 4643697 3692267 3587603 | |||||||||||||||||||||||||||||||||||||||||
Tables (Output of Computation) | |||||||||||||||||||||||||||||||||||||||||
| |||||||||||||||||||||||||||||||||||||||||
Figures (Output of Computation) | |||||||||||||||||||||||||||||||||||||||||
Input Parameters & R Code | |||||||||||||||||||||||||||||||||||||||||
| Parameters (Session): | |||||||||||||||||||||||||||||||||||||||||
| par1 = Passagiervervoer op Schiphol Amsterdam ; par2 = http://www.cbs.nl/nl-NL/menu/home/default.htm ; par3 = Passagiervervoer op Schiphol Amsterdam ; par4 = 12 ; | |||||||||||||||||||||||||||||||||||||||||
| Parameters (R input): | |||||||||||||||||||||||||||||||||||||||||
| par1 = Passagiervervoer op Schiphol Amsterdam ; par2 = http://www.cbs.nl/nl-NL/menu/home/default.htm ; par3 = Passagiervervoer op Schiphol Amsterdam ; par4 = 12 ; | |||||||||||||||||||||||||||||||||||||||||
| R code (references can be found in the software module): | |||||||||||||||||||||||||||||||||||||||||
if (par4 != 'No season') { | |||||||||||||||||||||||||||||||||||||||||