Free Statistics

of Irreproducible Research!

Author's title

Author*Unverified author*
R Software Modulerwasp_autocorrelation.wasp
Title produced by software(Partial) Autocorrelation Function
Date of computationSun, 12 Jan 2014 20:25:38 -0500
Cite this page as followsStatistical Computations at FreeStatistics.org, Office for Research Development and Education, URL https://freestatistics.org/blog/index.php?v=date/2014/Jan/12/t1389576448qmi2ss3c4fd95qv.htm/, Retrieved Sun, 19 May 2024 08:02:04 +0000
Statistical Computations at FreeStatistics.org, Office for Research Development and Education, URL https://freestatistics.org/blog/index.php?pk=233098, Retrieved Sun, 19 May 2024 08:02:04 +0000
QR Codes:

Original text written by user:
IsPrivate?No (this computation is public)
User-defined keywordsKarel De Grote-Hogeschool Valérie Weyts
Estimated Impact90
Family? (F = Feedback message, R = changed R code, M = changed R Module, P = changed Parameters, D = changed Data)
-     [Mean Plot] [Mean plot NWWZ Ma...] [2014-01-13 00:02:57] [ba0d20b2fbb0c8f9ef8b1828cc8a0bda]
- RMPD    [(Partial) Autocorrelation Function] [Autocorrelatie ge...] [2014-01-13 01:25:38] [feb2df3f24188fb89c42f3077ec68a56] [Current]
Feedback Forum

Post a new message
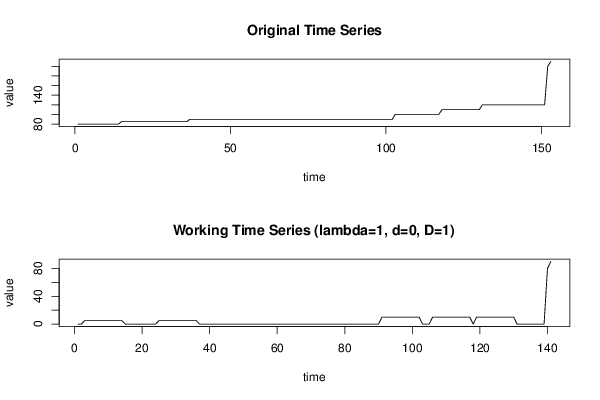
Dataseries X:
80
80
80
80
80
80
80
80
80
80
80
80
80
80
85
85
85
85
85
85
85
85
85
85
85
85
85
85
85
85
85
85
85
85
85
85
90
90
90
90
90
90
90
90
90
90
90
90
90
90
90
90
90
90
90
90
90
90
90
90
90
90
90
90
90
90
90
90
90
90
90
90
90
90
90
90
90
90
90
90
90
90
90
90
90
90
90
90
90
90
90
90
90
90
90
90
90
90
90
90
90
90
100
100
100
100
100
100
100
100
100
100
100
100
100
100
100
110
110
110
110
110
110
110
110
110
110
110
110
110
120
120
120
120
120
120
120
120
120
120
120
120
120
120
120
120
120
120
120
120
120
200
210


Summary of computational transaction
Raw Inputview raw input (R code)
Raw Outputview raw output of R engine
Computing time3 seconds
R Server'Herman Ole Andreas Wold' @ wold.wessa.net

\begin{tabular}{lllllllll}
\hline
Summary of computational transaction \tabularnewline
Raw Input & view raw input (R code)  \tabularnewline
Raw Output & view raw output of R engine  \tabularnewline
Computing time & 3 seconds \tabularnewline
R Server & 'Herman Ole Andreas Wold' @ wold.wessa.net \tabularnewline
\hline
\end{tabular}
%Source: https://freestatistics.org/blog/index.php?pk=233098&T=0

[TABLE]
[ROW][C]Summary of computational transaction[/C][/ROW]
[ROW][C]Raw Input[/C][C]view raw input (R code) [/C][/ROW]
[ROW][C]Raw Output[/C][C]view raw output of R engine [/C][/ROW]
[ROW][C]Computing time[/C][C]3 seconds[/C][/ROW]
[ROW][C]R Server[/C][C]'Herman Ole Andreas Wold' @ wold.wessa.net[/C][/ROW]
[/TABLE]
Source: https://freestatistics.org/blog/index.php?pk=233098&T=0

Globally Unique Identifier (entire table): ba.freestatistics.org/blog/index.php?pk=233098&T=0

As an alternative you can also use a QR Code:  

The GUIDs for individual cells are displayed in the table below:

Summary of computational transaction
Raw Inputview raw input (R code)
Raw Outputview raw output of R engine
Computing time3 seconds
R Server'Herman Ole Andreas Wold' @ wold.wessa.net


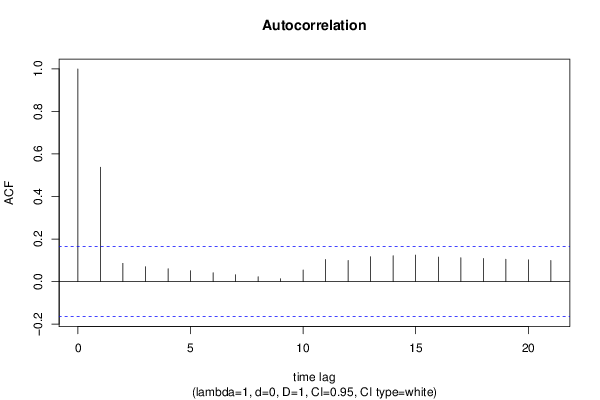
Autocorrelation Function
Time lag kACF(k)T-STATP-value
10.5379166.38740
20.0856321.01680.155489
30.0698270.82910.204211
40.0603890.71710.237254
50.0509520.6050.273069
60.0415140.4930.311405
70.0320770.38090.351928
80.0226390.26880.394227
90.0132020.15680.437827
100.0547080.64960.258495
110.1041751.2370.10907
120.0992651.17870.12025
130.1166431.38510.084111
140.1212851.44020.076016
150.1244591.47790.070836
160.1148981.36430.087318
170.1117041.32640.093424
180.108511.28850.099843
190.1053171.25060.106582
200.1021231.21260.113647
210.0989291.17470.121043

\begin{tabular}{lllllllll}
\hline
Autocorrelation Function \tabularnewline
Time lag k & ACF(k) & T-STAT & P-value \tabularnewline
1 & 0.537916 & 6.3874 & 0 \tabularnewline
2 & 0.085632 & 1.0168 & 0.155489 \tabularnewline
3 & 0.069827 & 0.8291 & 0.204211 \tabularnewline
4 & 0.060389 & 0.7171 & 0.237254 \tabularnewline
5 & 0.050952 & 0.605 & 0.273069 \tabularnewline
6 & 0.041514 & 0.493 & 0.311405 \tabularnewline
7 & 0.032077 & 0.3809 & 0.351928 \tabularnewline
8 & 0.022639 & 0.2688 & 0.394227 \tabularnewline
9 & 0.013202 & 0.1568 & 0.437827 \tabularnewline
10 & 0.054708 & 0.6496 & 0.258495 \tabularnewline
11 & 0.104175 & 1.237 & 0.10907 \tabularnewline
12 & 0.099265 & 1.1787 & 0.12025 \tabularnewline
13 & 0.116643 & 1.3851 & 0.084111 \tabularnewline
14 & 0.121285 & 1.4402 & 0.076016 \tabularnewline
15 & 0.124459 & 1.4779 & 0.070836 \tabularnewline
16 & 0.114898 & 1.3643 & 0.087318 \tabularnewline
17 & 0.111704 & 1.3264 & 0.093424 \tabularnewline
18 & 0.10851 & 1.2885 & 0.099843 \tabularnewline
19 & 0.105317 & 1.2506 & 0.106582 \tabularnewline
20 & 0.102123 & 1.2126 & 0.113647 \tabularnewline
21 & 0.098929 & 1.1747 & 0.121043 \tabularnewline
\hline
\end{tabular}
%Source: https://freestatistics.org/blog/index.php?pk=233098&T=1

[TABLE]
[ROW][C]Autocorrelation Function[/C][/ROW]
[ROW][C]Time lag k[/C][C]ACF(k)[/C][C]T-STAT[/C][C]P-value[/C][/ROW]
[ROW][C]1[/C][C]0.537916[/C][C]6.3874[/C][C]0[/C][/ROW]
[ROW][C]2[/C][C]0.085632[/C][C]1.0168[/C][C]0.155489[/C][/ROW]
[ROW][C]3[/C][C]0.069827[/C][C]0.8291[/C][C]0.204211[/C][/ROW]
[ROW][C]4[/C][C]0.060389[/C][C]0.7171[/C][C]0.237254[/C][/ROW]
[ROW][C]5[/C][C]0.050952[/C][C]0.605[/C][C]0.273069[/C][/ROW]
[ROW][C]6[/C][C]0.041514[/C][C]0.493[/C][C]0.311405[/C][/ROW]
[ROW][C]7[/C][C]0.032077[/C][C]0.3809[/C][C]0.351928[/C][/ROW]
[ROW][C]8[/C][C]0.022639[/C][C]0.2688[/C][C]0.394227[/C][/ROW]
[ROW][C]9[/C][C]0.013202[/C][C]0.1568[/C][C]0.437827[/C][/ROW]
[ROW][C]10[/C][C]0.054708[/C][C]0.6496[/C][C]0.258495[/C][/ROW]
[ROW][C]11[/C][C]0.104175[/C][C]1.237[/C][C]0.10907[/C][/ROW]
[ROW][C]12[/C][C]0.099265[/C][C]1.1787[/C][C]0.12025[/C][/ROW]
[ROW][C]13[/C][C]0.116643[/C][C]1.3851[/C][C]0.084111[/C][/ROW]
[ROW][C]14[/C][C]0.121285[/C][C]1.4402[/C][C]0.076016[/C][/ROW]
[ROW][C]15[/C][C]0.124459[/C][C]1.4779[/C][C]0.070836[/C][/ROW]
[ROW][C]16[/C][C]0.114898[/C][C]1.3643[/C][C]0.087318[/C][/ROW]
[ROW][C]17[/C][C]0.111704[/C][C]1.3264[/C][C]0.093424[/C][/ROW]
[ROW][C]18[/C][C]0.10851[/C][C]1.2885[/C][C]0.099843[/C][/ROW]
[ROW][C]19[/C][C]0.105317[/C][C]1.2506[/C][C]0.106582[/C][/ROW]
[ROW][C]20[/C][C]0.102123[/C][C]1.2126[/C][C]0.113647[/C][/ROW]
[ROW][C]21[/C][C]0.098929[/C][C]1.1747[/C][C]0.121043[/C][/ROW]
[/TABLE]
Source: https://freestatistics.org/blog/index.php?pk=233098&T=1

Globally Unique Identifier (entire table): ba.freestatistics.org/blog/index.php?pk=233098&T=1

As an alternative you can also use a QR Code:  

The GUIDs for individual cells are displayed in the table below:

Autocorrelation Function
Time lag kACF(k)T-STATP-value
10.5379166.38740
20.0856321.01680.155489
30.0698270.82910.204211
40.0603890.71710.237254
50.0509520.6050.273069
60.0415140.4930.311405
70.0320770.38090.351928
80.0226390.26880.394227
90.0132020.15680.437827
100.0547080.64960.258495
110.1041751.2370.10907
120.0992651.17870.12025
130.1166431.38510.084111
140.1212851.44020.076016
150.1244591.47790.070836
160.1148981.36430.087318
170.1117041.32640.093424
180.108511.28850.099843
190.1053171.25060.106582
200.1021231.21260.113647
210.0989291.17470.121043


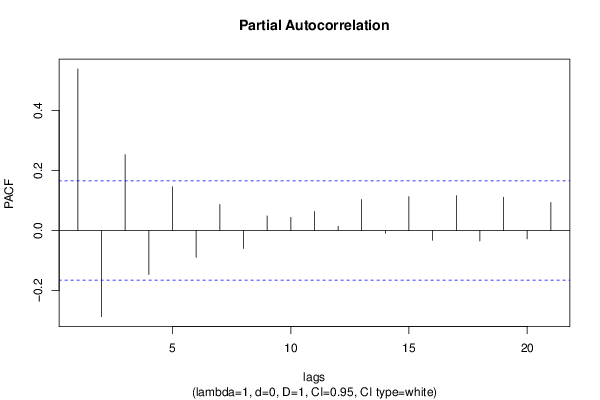
Partial Autocorrelation Function
Time lag kPACF(k)T-STATP-value
10.5379166.38740
2-0.28667-3.4040.000432
30.252612.99960.001599
4-0.14634-1.73770.042225
50.145591.72880.043018
6-0.088697-1.05320.147022
70.0864571.02660.153178
8-0.059905-0.71130.239027
90.0487080.57840.281965
100.0438570.52080.30167
110.0632030.75050.227104
120.0140660.1670.433795
130.1035471.22950.110457
14-0.008856-0.10520.458198
150.1127971.33940.0913
16-0.032303-0.38360.350935
170.1161941.37970.084927
18-0.034941-0.41490.339422
190.1106531.31390.095501
20-0.027756-0.32960.371101
210.0931981.10670.135162

\begin{tabular}{lllllllll}
\hline
Partial Autocorrelation Function \tabularnewline
Time lag k & PACF(k) & T-STAT & P-value \tabularnewline
1 & 0.537916 & 6.3874 & 0 \tabularnewline
2 & -0.28667 & -3.404 & 0.000432 \tabularnewline
3 & 0.25261 & 2.9996 & 0.001599 \tabularnewline
4 & -0.14634 & -1.7377 & 0.042225 \tabularnewline
5 & 0.14559 & 1.7288 & 0.043018 \tabularnewline
6 & -0.088697 & -1.0532 & 0.147022 \tabularnewline
7 & 0.086457 & 1.0266 & 0.153178 \tabularnewline
8 & -0.059905 & -0.7113 & 0.239027 \tabularnewline
9 & 0.048708 & 0.5784 & 0.281965 \tabularnewline
10 & 0.043857 & 0.5208 & 0.30167 \tabularnewline
11 & 0.063203 & 0.7505 & 0.227104 \tabularnewline
12 & 0.014066 & 0.167 & 0.433795 \tabularnewline
13 & 0.103547 & 1.2295 & 0.110457 \tabularnewline
14 & -0.008856 & -0.1052 & 0.458198 \tabularnewline
15 & 0.112797 & 1.3394 & 0.0913 \tabularnewline
16 & -0.032303 & -0.3836 & 0.350935 \tabularnewline
17 & 0.116194 & 1.3797 & 0.084927 \tabularnewline
18 & -0.034941 & -0.4149 & 0.339422 \tabularnewline
19 & 0.110653 & 1.3139 & 0.095501 \tabularnewline
20 & -0.027756 & -0.3296 & 0.371101 \tabularnewline
21 & 0.093198 & 1.1067 & 0.135162 \tabularnewline
\hline
\end{tabular}
%Source: https://freestatistics.org/blog/index.php?pk=233098&T=2

[TABLE]
[ROW][C]Partial Autocorrelation Function[/C][/ROW]
[ROW][C]Time lag k[/C][C]PACF(k)[/C][C]T-STAT[/C][C]P-value[/C][/ROW]
[ROW][C]1[/C][C]0.537916[/C][C]6.3874[/C][C]0[/C][/ROW]
[ROW][C]2[/C][C]-0.28667[/C][C]-3.404[/C][C]0.000432[/C][/ROW]
[ROW][C]3[/C][C]0.25261[/C][C]2.9996[/C][C]0.001599[/C][/ROW]
[ROW][C]4[/C][C]-0.14634[/C][C]-1.7377[/C][C]0.042225[/C][/ROW]
[ROW][C]5[/C][C]0.14559[/C][C]1.7288[/C][C]0.043018[/C][/ROW]
[ROW][C]6[/C][C]-0.088697[/C][C]-1.0532[/C][C]0.147022[/C][/ROW]
[ROW][C]7[/C][C]0.086457[/C][C]1.0266[/C][C]0.153178[/C][/ROW]
[ROW][C]8[/C][C]-0.059905[/C][C]-0.7113[/C][C]0.239027[/C][/ROW]
[ROW][C]9[/C][C]0.048708[/C][C]0.5784[/C][C]0.281965[/C][/ROW]
[ROW][C]10[/C][C]0.043857[/C][C]0.5208[/C][C]0.30167[/C][/ROW]
[ROW][C]11[/C][C]0.063203[/C][C]0.7505[/C][C]0.227104[/C][/ROW]
[ROW][C]12[/C][C]0.014066[/C][C]0.167[/C][C]0.433795[/C][/ROW]
[ROW][C]13[/C][C]0.103547[/C][C]1.2295[/C][C]0.110457[/C][/ROW]
[ROW][C]14[/C][C]-0.008856[/C][C]-0.1052[/C][C]0.458198[/C][/ROW]
[ROW][C]15[/C][C]0.112797[/C][C]1.3394[/C][C]0.0913[/C][/ROW]
[ROW][C]16[/C][C]-0.032303[/C][C]-0.3836[/C][C]0.350935[/C][/ROW]
[ROW][C]17[/C][C]0.116194[/C][C]1.3797[/C][C]0.084927[/C][/ROW]
[ROW][C]18[/C][C]-0.034941[/C][C]-0.4149[/C][C]0.339422[/C][/ROW]
[ROW][C]19[/C][C]0.110653[/C][C]1.3139[/C][C]0.095501[/C][/ROW]
[ROW][C]20[/C][C]-0.027756[/C][C]-0.3296[/C][C]0.371101[/C][/ROW]
[ROW][C]21[/C][C]0.093198[/C][C]1.1067[/C][C]0.135162[/C][/ROW]
[/TABLE]
Source: https://freestatistics.org/blog/index.php?pk=233098&T=2

Globally Unique Identifier (entire table): ba.freestatistics.org/blog/index.php?pk=233098&T=2

As an alternative you can also use a QR Code:  

The GUIDs for individual cells are displayed in the table below:

Partial Autocorrelation Function
Time lag kPACF(k)T-STATP-value
10.5379166.38740
2-0.28667-3.4040.000432
30.252612.99960.001599
4-0.14634-1.73770.042225
50.145591.72880.043018
6-0.088697-1.05320.147022
70.0864571.02660.153178
8-0.059905-0.71130.239027
90.0487080.57840.281965
100.0438570.52080.30167
110.0632030.75050.227104
120.0140660.1670.433795
130.1035471.22950.110457
14-0.008856-0.10520.458198
150.1127971.33940.0913
16-0.032303-0.38360.350935
170.1161941.37970.084927
18-0.034941-0.41490.339422
190.1106531.31390.095501
20-0.027756-0.32960.371101
210.0931981.10670.135162


Parameters (Session):
par1 = Default ; par2 = 1 ; par3 = 0 ; par4 = 1 ; par5 = 12 ; par6 = White Noise ; par7 = 0.95 ;
Parameters (R input):
par1 = Default ; par2 = 1 ; par3 = 0 ; par4 = 1 ; par5 = 12 ; par6 = White Noise ; par7 = 0.95 ; par8 = ;
R code (references can be found in the software module):
if (par1 == 'Default') {
par1 = 10*log10(length(x))
} else {
par1 <- as.numeric(par1)
}
par2 <- as.numeric(par2)
par3 <- as.numeric(par3)
par4 <- as.numeric(par4)
par5 <- as.numeric(par5)
if (par6 == 'White Noise') par6 <- 'white' else par6 <- 'ma'
par7 <- as.numeric(par7)
if (par8 != '') par8 <- as.numeric(par8)
ox <- x
if (par8 == '') {
if (par2 == 0) {
x <- log(x)
} else {
x <- (x ^ par2 - 1) / par2
}
} else {
x <- log(x,base=par8)
}
if (par3 > 0) x <- diff(x,lag=1,difference=par3)
if (par4 > 0) x <- diff(x,lag=par5,difference=par4)
bitmap(file='picts.png')
op <- par(mfrow=c(2,1))
plot(ox,type='l',main='Original Time Series',xlab='time',ylab='value')
if (par8=='') {
mytitle <- paste('Working Time Series (lambda=',par2,', d=',par3,', D=',par4,')',sep='')
mysub <- paste('(lambda=',par2,', d=',par3,', D=',par4,', CI=', par7, ', CI type=',par6,')',sep='')
} else {
mytitle <- paste('Working Time Series (base=',par8,', d=',par3,', D=',par4,')',sep='')
mysub <- paste('(base=',par8,', d=',par3,', D=',par4,', CI=', par7, ', CI type=',par6,')',sep='')
}
plot(x,type='l', main=mytitle,xlab='time',ylab='value')
par(op)
dev.off()
bitmap(file='pic1.png')
racf <- acf(x, par1, main='Autocorrelation', xlab='time lag', ylab='ACF', ci.type=par6, ci=par7, sub=mysub)
dev.off()
bitmap(file='pic2.png')
rpacf <- pacf(x,par1,main='Partial Autocorrelation',xlab='lags',ylab='PACF',sub=mysub)
dev.off()
(myacf <- c(racf$acf))
(mypacf <- c(rpacf$acf))
lengthx <- length(x)
sqrtn <- sqrt(lengthx)
load(file='createtable')
a<-table.start()
a<-table.row.start(a)
a<-table.element(a,'Autocorrelation Function',4,TRUE)
a<-table.row.end(a)
a<-table.row.start(a)
a<-table.element(a,'Time lag k',header=TRUE)
a<-table.element(a,hyperlink('basics.htm','ACF(k)','click here for more information about the Autocorrelation Function'),header=TRUE)
a<-table.element(a,'T-STAT',header=TRUE)
a<-table.element(a,'P-value',header=TRUE)
a<-table.row.end(a)
for (i in 2:(par1+1)) {
a<-table.row.start(a)
a<-table.element(a,i-1,header=TRUE)
a<-table.element(a,round(myacf[i],6))
mytstat <- myacf[i]*sqrtn
a<-table.element(a,round(mytstat,4))
a<-table.element(a,round(1-pt(abs(mytstat),lengthx),6))
a<-table.row.end(a)
}
a<-table.end(a)
table.save(a,file='mytable.tab')
a<-table.start()
a<-table.row.start(a)
a<-table.element(a,'Partial Autocorrelation Function',4,TRUE)
a<-table.row.end(a)
a<-table.row.start(a)
a<-table.element(a,'Time lag k',header=TRUE)
a<-table.element(a,hyperlink('basics.htm','PACF(k)','click here for more information about the Partial Autocorrelation Function'),header=TRUE)
a<-table.element(a,'T-STAT',header=TRUE)
a<-table.element(a,'P-value',header=TRUE)
a<-table.row.end(a)
for (i in 1:par1) {
a<-table.row.start(a)
a<-table.element(a,i,header=TRUE)
a<-table.element(a,round(mypacf[i],6))
mytstat <- mypacf[i]*sqrtn
a<-table.element(a,round(mytstat,4))
a<-table.element(a,round(1-pt(abs(mytstat),lengthx),6))
a<-table.row.end(a)
}
a<-table.end(a)
table.save(a,file='mytable1.tab')