Free Statistics

of Irreproducible Research!

Author's title

Author*Unverified author*
R Software Modulerwasp_autocorrelation.wasp
Title produced by software(Partial) Autocorrelation Function
Date of computationSun, 12 Jan 2014 09:48:55 -0500
Cite this page as followsStatistical Computations at FreeStatistics.org, Office for Research Development and Education, URL https://freestatistics.org/blog/index.php?v=date/2014/Jan/12/t13895381833c58cuuu4e8t1m3.htm/, Retrieved Sun, 19 May 2024 05:56:33 +0000
Statistical Computations at FreeStatistics.org, Office for Research Development and Education, URL https://freestatistics.org/blog/index.php?pk=233007, Retrieved Sun, 19 May 2024 05:56:33 +0000
QR Codes:

Original text written by user:
IsPrivate?No (this computation is public)
User-defined keywords
Estimated Impact82
Family? (F = Feedback message, R = changed R code, M = changed R Module, P = changed Parameters, D = changed Data)
-     [(Partial) Autocorrelation Function] [] [2013-11-21 15:51:25] [7693d6bd9b394a2eae1da409a7dd3216]
- R PD  [(Partial) Autocorrelation Function] [] [2014-01-12 14:35:40] [7693d6bd9b394a2eae1da409a7dd3216]
-   PD      [(Partial) Autocorrelation Function] [] [2014-01-12 14:48:55] [ffc6217b42a6800413892efb2ef7f057] [Current]
Feedback Forum

Post a new message
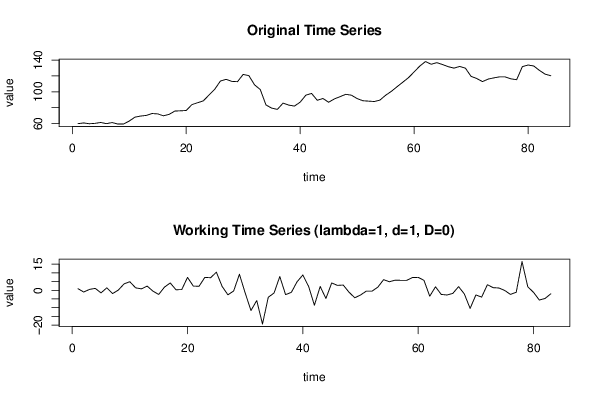
Dataseries X:
59.8
60.7
59.7
60.2
61.3
59.8
61.2
59.3
59.4
63.1
68
69.4
70.2
72.6
72.1
69.7
71.5
75.7
76
76.4
83.8
86.2
88.5
95.9
103.1
113.5
115.7
113.1
112.7
121.9
120.3
108.7
102.8
83.4
79.4
77.8
85.7
83.2
82
86.9
95.7
97.9
89.3
91.5
86.8
91
93.8
96.8
95.7
91.4
88.7
88.2
87.7
89.5
95.6
100.5
106.3
112
117.7
125
132.4
138.1
134.7
136.7
134.3
131.6
129.8
131.9
129.8
119.4
116.7
112.8
116
117.5
118.8
118.7
116.3
115.2
131.7
133.7
132.5
126.9
122.2
120.2


Summary of computational transaction
Raw Inputview raw input (R code)
Raw Outputview raw output of R engine
Computing time4 seconds
R Server'Gertrude Mary Cox' @ cox.wessa.net

\begin{tabular}{lllllllll}
\hline
Summary of computational transaction \tabularnewline
Raw Input & view raw input (R code)  \tabularnewline
Raw Output & view raw output of R engine  \tabularnewline
Computing time & 4 seconds \tabularnewline
R Server & 'Gertrude Mary Cox' @ cox.wessa.net \tabularnewline
\hline
\end{tabular}
%Source: https://freestatistics.org/blog/index.php?pk=233007&T=0

[TABLE]
[ROW][C]Summary of computational transaction[/C][/ROW]
[ROW][C]Raw Input[/C][C]view raw input (R code) [/C][/ROW]
[ROW][C]Raw Output[/C][C]view raw output of R engine [/C][/ROW]
[ROW][C]Computing time[/C][C]4 seconds[/C][/ROW]
[ROW][C]R Server[/C][C]'Gertrude Mary Cox' @ cox.wessa.net[/C][/ROW]
[/TABLE]
Source: https://freestatistics.org/blog/index.php?pk=233007&T=0

Globally Unique Identifier (entire table): ba.freestatistics.org/blog/index.php?pk=233007&T=0

As an alternative you can also use a QR Code:  

The GUIDs for individual cells are displayed in the table below:

Summary of computational transaction
Raw Inputview raw input (R code)
Raw Outputview raw output of R engine
Computing time4 seconds
R Server'Gertrude Mary Cox' @ cox.wessa.net


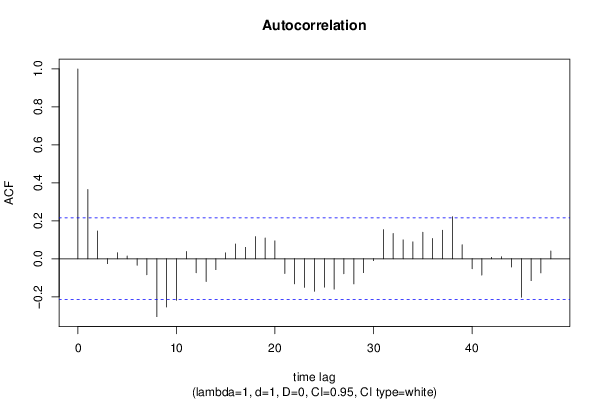
Autocorrelation Function
Time lag kACF(k)T-STATP-value
10.365413.3290.000651
20.1463521.33330.093036
3-0.025272-0.23020.409237
40.0320120.29160.385643
50.0144480.13160.4478
6-0.034239-0.31190.377937
7-0.084072-0.76590.222945
8-0.304609-2.77510.003408
9-0.253459-2.30910.011711
10-0.218506-1.99070.024903
110.0386250.35190.362907
12-0.073318-0.6680.253007
13-0.119251-1.08640.140217
14-0.056883-0.51820.302838
150.0314160.28620.387714
160.0776420.70740.240664
170.0604590.55080.291624
180.1170381.06630.144698
190.1094530.99720.160792
200.0946560.86240.195487
21-0.077583-0.70680.240832
22-0.131828-1.2010.116582
23-0.150493-1.37110.087027
24-0.170479-1.55310.062097
25-0.149306-1.36020.088718
26-0.159763-1.45550.07465
27-0.078458-0.71480.238375
28-0.132197-1.20440.115935
29-0.072915-0.66430.254172
30-0.009516-0.08670.465562
310.1539061.40210.0823
320.1330411.21210.114464
330.099880.90990.182742
340.0894350.81480.208762
350.1397241.27290.103295
360.1067670.97270.166765
370.1507211.37310.086705
380.2216252.01910.023352
390.0744430.67820.249763
40-0.052099-0.47460.318143
41-0.085764-0.78140.218409
420.0075460.06880.472676
430.010690.09740.461327
44-0.04353-0.39660.346347
45-0.202677-1.84650.034194
46-0.114777-1.04570.149375
47-0.073943-0.67370.251203
480.040970.37330.354955

\begin{tabular}{lllllllll}
\hline
Autocorrelation Function \tabularnewline
Time lag k & ACF(k) & T-STAT & P-value \tabularnewline
1 & 0.36541 & 3.329 & 0.000651 \tabularnewline
2 & 0.146352 & 1.3333 & 0.093036 \tabularnewline
3 & -0.025272 & -0.2302 & 0.409237 \tabularnewline
4 & 0.032012 & 0.2916 & 0.385643 \tabularnewline
5 & 0.014448 & 0.1316 & 0.4478 \tabularnewline
6 & -0.034239 & -0.3119 & 0.377937 \tabularnewline
7 & -0.084072 & -0.7659 & 0.222945 \tabularnewline
8 & -0.304609 & -2.7751 & 0.003408 \tabularnewline
9 & -0.253459 & -2.3091 & 0.011711 \tabularnewline
10 & -0.218506 & -1.9907 & 0.024903 \tabularnewline
11 & 0.038625 & 0.3519 & 0.362907 \tabularnewline
12 & -0.073318 & -0.668 & 0.253007 \tabularnewline
13 & -0.119251 & -1.0864 & 0.140217 \tabularnewline
14 & -0.056883 & -0.5182 & 0.302838 \tabularnewline
15 & 0.031416 & 0.2862 & 0.387714 \tabularnewline
16 & 0.077642 & 0.7074 & 0.240664 \tabularnewline
17 & 0.060459 & 0.5508 & 0.291624 \tabularnewline
18 & 0.117038 & 1.0663 & 0.144698 \tabularnewline
19 & 0.109453 & 0.9972 & 0.160792 \tabularnewline
20 & 0.094656 & 0.8624 & 0.195487 \tabularnewline
21 & -0.077583 & -0.7068 & 0.240832 \tabularnewline
22 & -0.131828 & -1.201 & 0.116582 \tabularnewline
23 & -0.150493 & -1.3711 & 0.087027 \tabularnewline
24 & -0.170479 & -1.5531 & 0.062097 \tabularnewline
25 & -0.149306 & -1.3602 & 0.088718 \tabularnewline
26 & -0.159763 & -1.4555 & 0.07465 \tabularnewline
27 & -0.078458 & -0.7148 & 0.238375 \tabularnewline
28 & -0.132197 & -1.2044 & 0.115935 \tabularnewline
29 & -0.072915 & -0.6643 & 0.254172 \tabularnewline
30 & -0.009516 & -0.0867 & 0.465562 \tabularnewline
31 & 0.153906 & 1.4021 & 0.0823 \tabularnewline
32 & 0.133041 & 1.2121 & 0.114464 \tabularnewline
33 & 0.09988 & 0.9099 & 0.182742 \tabularnewline
34 & 0.089435 & 0.8148 & 0.208762 \tabularnewline
35 & 0.139724 & 1.2729 & 0.103295 \tabularnewline
36 & 0.106767 & 0.9727 & 0.166765 \tabularnewline
37 & 0.150721 & 1.3731 & 0.086705 \tabularnewline
38 & 0.221625 & 2.0191 & 0.023352 \tabularnewline
39 & 0.074443 & 0.6782 & 0.249763 \tabularnewline
40 & -0.052099 & -0.4746 & 0.318143 \tabularnewline
41 & -0.085764 & -0.7814 & 0.218409 \tabularnewline
42 & 0.007546 & 0.0688 & 0.472676 \tabularnewline
43 & 0.01069 & 0.0974 & 0.461327 \tabularnewline
44 & -0.04353 & -0.3966 & 0.346347 \tabularnewline
45 & -0.202677 & -1.8465 & 0.034194 \tabularnewline
46 & -0.114777 & -1.0457 & 0.149375 \tabularnewline
47 & -0.073943 & -0.6737 & 0.251203 \tabularnewline
48 & 0.04097 & 0.3733 & 0.354955 \tabularnewline
\hline
\end{tabular}
%Source: https://freestatistics.org/blog/index.php?pk=233007&T=1

[TABLE]
[ROW][C]Autocorrelation Function[/C][/ROW]
[ROW][C]Time lag k[/C][C]ACF(k)[/C][C]T-STAT[/C][C]P-value[/C][/ROW]
[ROW][C]1[/C][C]0.36541[/C][C]3.329[/C][C]0.000651[/C][/ROW]
[ROW][C]2[/C][C]0.146352[/C][C]1.3333[/C][C]0.093036[/C][/ROW]
[ROW][C]3[/C][C]-0.025272[/C][C]-0.2302[/C][C]0.409237[/C][/ROW]
[ROW][C]4[/C][C]0.032012[/C][C]0.2916[/C][C]0.385643[/C][/ROW]
[ROW][C]5[/C][C]0.014448[/C][C]0.1316[/C][C]0.4478[/C][/ROW]
[ROW][C]6[/C][C]-0.034239[/C][C]-0.3119[/C][C]0.377937[/C][/ROW]
[ROW][C]7[/C][C]-0.084072[/C][C]-0.7659[/C][C]0.222945[/C][/ROW]
[ROW][C]8[/C][C]-0.304609[/C][C]-2.7751[/C][C]0.003408[/C][/ROW]
[ROW][C]9[/C][C]-0.253459[/C][C]-2.3091[/C][C]0.011711[/C][/ROW]
[ROW][C]10[/C][C]-0.218506[/C][C]-1.9907[/C][C]0.024903[/C][/ROW]
[ROW][C]11[/C][C]0.038625[/C][C]0.3519[/C][C]0.362907[/C][/ROW]
[ROW][C]12[/C][C]-0.073318[/C][C]-0.668[/C][C]0.253007[/C][/ROW]
[ROW][C]13[/C][C]-0.119251[/C][C]-1.0864[/C][C]0.140217[/C][/ROW]
[ROW][C]14[/C][C]-0.056883[/C][C]-0.5182[/C][C]0.302838[/C][/ROW]
[ROW][C]15[/C][C]0.031416[/C][C]0.2862[/C][C]0.387714[/C][/ROW]
[ROW][C]16[/C][C]0.077642[/C][C]0.7074[/C][C]0.240664[/C][/ROW]
[ROW][C]17[/C][C]0.060459[/C][C]0.5508[/C][C]0.291624[/C][/ROW]
[ROW][C]18[/C][C]0.117038[/C][C]1.0663[/C][C]0.144698[/C][/ROW]
[ROW][C]19[/C][C]0.109453[/C][C]0.9972[/C][C]0.160792[/C][/ROW]
[ROW][C]20[/C][C]0.094656[/C][C]0.8624[/C][C]0.195487[/C][/ROW]
[ROW][C]21[/C][C]-0.077583[/C][C]-0.7068[/C][C]0.240832[/C][/ROW]
[ROW][C]22[/C][C]-0.131828[/C][C]-1.201[/C][C]0.116582[/C][/ROW]
[ROW][C]23[/C][C]-0.150493[/C][C]-1.3711[/C][C]0.087027[/C][/ROW]
[ROW][C]24[/C][C]-0.170479[/C][C]-1.5531[/C][C]0.062097[/C][/ROW]
[ROW][C]25[/C][C]-0.149306[/C][C]-1.3602[/C][C]0.088718[/C][/ROW]
[ROW][C]26[/C][C]-0.159763[/C][C]-1.4555[/C][C]0.07465[/C][/ROW]
[ROW][C]27[/C][C]-0.078458[/C][C]-0.7148[/C][C]0.238375[/C][/ROW]
[ROW][C]28[/C][C]-0.132197[/C][C]-1.2044[/C][C]0.115935[/C][/ROW]
[ROW][C]29[/C][C]-0.072915[/C][C]-0.6643[/C][C]0.254172[/C][/ROW]
[ROW][C]30[/C][C]-0.009516[/C][C]-0.0867[/C][C]0.465562[/C][/ROW]
[ROW][C]31[/C][C]0.153906[/C][C]1.4021[/C][C]0.0823[/C][/ROW]
[ROW][C]32[/C][C]0.133041[/C][C]1.2121[/C][C]0.114464[/C][/ROW]
[ROW][C]33[/C][C]0.09988[/C][C]0.9099[/C][C]0.182742[/C][/ROW]
[ROW][C]34[/C][C]0.089435[/C][C]0.8148[/C][C]0.208762[/C][/ROW]
[ROW][C]35[/C][C]0.139724[/C][C]1.2729[/C][C]0.103295[/C][/ROW]
[ROW][C]36[/C][C]0.106767[/C][C]0.9727[/C][C]0.166765[/C][/ROW]
[ROW][C]37[/C][C]0.150721[/C][C]1.3731[/C][C]0.086705[/C][/ROW]
[ROW][C]38[/C][C]0.221625[/C][C]2.0191[/C][C]0.023352[/C][/ROW]
[ROW][C]39[/C][C]0.074443[/C][C]0.6782[/C][C]0.249763[/C][/ROW]
[ROW][C]40[/C][C]-0.052099[/C][C]-0.4746[/C][C]0.318143[/C][/ROW]
[ROW][C]41[/C][C]-0.085764[/C][C]-0.7814[/C][C]0.218409[/C][/ROW]
[ROW][C]42[/C][C]0.007546[/C][C]0.0688[/C][C]0.472676[/C][/ROW]
[ROW][C]43[/C][C]0.01069[/C][C]0.0974[/C][C]0.461327[/C][/ROW]
[ROW][C]44[/C][C]-0.04353[/C][C]-0.3966[/C][C]0.346347[/C][/ROW]
[ROW][C]45[/C][C]-0.202677[/C][C]-1.8465[/C][C]0.034194[/C][/ROW]
[ROW][C]46[/C][C]-0.114777[/C][C]-1.0457[/C][C]0.149375[/C][/ROW]
[ROW][C]47[/C][C]-0.073943[/C][C]-0.6737[/C][C]0.251203[/C][/ROW]
[ROW][C]48[/C][C]0.04097[/C][C]0.3733[/C][C]0.354955[/C][/ROW]
[/TABLE]
Source: https://freestatistics.org/blog/index.php?pk=233007&T=1

Globally Unique Identifier (entire table): ba.freestatistics.org/blog/index.php?pk=233007&T=1

As an alternative you can also use a QR Code:  

The GUIDs for individual cells are displayed in the table below:

Autocorrelation Function
Time lag kACF(k)T-STATP-value
10.365413.3290.000651
20.1463521.33330.093036
3-0.025272-0.23020.409237
40.0320120.29160.385643
50.0144480.13160.4478
6-0.034239-0.31190.377937
7-0.084072-0.76590.222945
8-0.304609-2.77510.003408
9-0.253459-2.30910.011711
10-0.218506-1.99070.024903
110.0386250.35190.362907
12-0.073318-0.6680.253007
13-0.119251-1.08640.140217
14-0.056883-0.51820.302838
150.0314160.28620.387714
160.0776420.70740.240664
170.0604590.55080.291624
180.1170381.06630.144698
190.1094530.99720.160792
200.0946560.86240.195487
21-0.077583-0.70680.240832
22-0.131828-1.2010.116582
23-0.150493-1.37110.087027
24-0.170479-1.55310.062097
25-0.149306-1.36020.088718
26-0.159763-1.45550.07465
27-0.078458-0.71480.238375
28-0.132197-1.20440.115935
29-0.072915-0.66430.254172
30-0.009516-0.08670.465562
310.1539061.40210.0823
320.1330411.21210.114464
330.099880.90990.182742
340.0894350.81480.208762
350.1397241.27290.103295
360.1067670.97270.166765
370.1507211.37310.086705
380.2216252.01910.023352
390.0744430.67820.249763
40-0.052099-0.47460.318143
41-0.085764-0.78140.218409
420.0075460.06880.472676
430.010690.09740.461327
44-0.04353-0.39660.346347
45-0.202677-1.84650.034194
46-0.114777-1.04570.149375
47-0.073943-0.67370.251203
480.040970.37330.354955


Partial Autocorrelation Function
Time lag kPACF(k)T-STATP-value
10.365413.3290.000651
20.0148040.13490.446521
3-0.096236-0.87680.191576
40.0804820.73320.232744
5-0.008548-0.07790.469058
6-0.062486-0.56930.285353
7-0.052994-0.48280.315255
8-0.291314-2.6540.004766
9-0.065352-0.59540.276603
10-0.081599-0.74340.229668
110.1481631.34980.09037
12-0.138802-1.26450.104787
13-0.104685-0.95370.171495
140.058860.53620.296615
150.0163640.14910.440924
16-0.042575-0.38790.349551
17-0.034245-0.3120.377917
180.0247080.22510.411228
190.1111331.01250.157128
20-0.011574-0.10540.45814
21-0.213921-1.94890.027342
22-0.172864-1.57490.059546
23-0.047113-0.42920.334437
24-0.077991-0.71050.239683
25-0.117915-1.07430.14291
26-0.139244-1.26860.104071
270.0575750.52450.300653
28-0.055872-0.5090.306046
29-0.117667-1.0720.143415
30-0.134089-1.22160.112657
310.0653210.59510.276697
320.0325770.29680.383684
33-0.066678-0.60750.272601
34-0.156663-1.42730.078627
350.0504740.45980.323416
36-0.029987-0.27320.392692
370.0628830.57290.284134
380.0264230.24070.40518
39-0.064724-0.58970.278508
40-0.003475-0.03170.487409
410.0592770.540.295307
42-0.010992-0.10010.460236
43-0.00359-0.03270.486995
44-0.029883-0.27220.393053
45-0.166782-1.51950.066224
460.0327060.2980.383237
47-0.021323-0.19430.423222
480.0342550.31210.377882

\begin{tabular}{lllllllll}
\hline
Partial Autocorrelation Function \tabularnewline
Time lag k & PACF(k) & T-STAT & P-value \tabularnewline
1 & 0.36541 & 3.329 & 0.000651 \tabularnewline
2 & 0.014804 & 0.1349 & 0.446521 \tabularnewline
3 & -0.096236 & -0.8768 & 0.191576 \tabularnewline
4 & 0.080482 & 0.7332 & 0.232744 \tabularnewline
5 & -0.008548 & -0.0779 & 0.469058 \tabularnewline
6 & -0.062486 & -0.5693 & 0.285353 \tabularnewline
7 & -0.052994 & -0.4828 & 0.315255 \tabularnewline
8 & -0.291314 & -2.654 & 0.004766 \tabularnewline
9 & -0.065352 & -0.5954 & 0.276603 \tabularnewline
10 & -0.081599 & -0.7434 & 0.229668 \tabularnewline
11 & 0.148163 & 1.3498 & 0.09037 \tabularnewline
12 & -0.138802 & -1.2645 & 0.104787 \tabularnewline
13 & -0.104685 & -0.9537 & 0.171495 \tabularnewline
14 & 0.05886 & 0.5362 & 0.296615 \tabularnewline
15 & 0.016364 & 0.1491 & 0.440924 \tabularnewline
16 & -0.042575 & -0.3879 & 0.349551 \tabularnewline
17 & -0.034245 & -0.312 & 0.377917 \tabularnewline
18 & 0.024708 & 0.2251 & 0.411228 \tabularnewline
19 & 0.111133 & 1.0125 & 0.157128 \tabularnewline
20 & -0.011574 & -0.1054 & 0.45814 \tabularnewline
21 & -0.213921 & -1.9489 & 0.027342 \tabularnewline
22 & -0.172864 & -1.5749 & 0.059546 \tabularnewline
23 & -0.047113 & -0.4292 & 0.334437 \tabularnewline
24 & -0.077991 & -0.7105 & 0.239683 \tabularnewline
25 & -0.117915 & -1.0743 & 0.14291 \tabularnewline
26 & -0.139244 & -1.2686 & 0.104071 \tabularnewline
27 & 0.057575 & 0.5245 & 0.300653 \tabularnewline
28 & -0.055872 & -0.509 & 0.306046 \tabularnewline
29 & -0.117667 & -1.072 & 0.143415 \tabularnewline
30 & -0.134089 & -1.2216 & 0.112657 \tabularnewline
31 & 0.065321 & 0.5951 & 0.276697 \tabularnewline
32 & 0.032577 & 0.2968 & 0.383684 \tabularnewline
33 & -0.066678 & -0.6075 & 0.272601 \tabularnewline
34 & -0.156663 & -1.4273 & 0.078627 \tabularnewline
35 & 0.050474 & 0.4598 & 0.323416 \tabularnewline
36 & -0.029987 & -0.2732 & 0.392692 \tabularnewline
37 & 0.062883 & 0.5729 & 0.284134 \tabularnewline
38 & 0.026423 & 0.2407 & 0.40518 \tabularnewline
39 & -0.064724 & -0.5897 & 0.278508 \tabularnewline
40 & -0.003475 & -0.0317 & 0.487409 \tabularnewline
41 & 0.059277 & 0.54 & 0.295307 \tabularnewline
42 & -0.010992 & -0.1001 & 0.460236 \tabularnewline
43 & -0.00359 & -0.0327 & 0.486995 \tabularnewline
44 & -0.029883 & -0.2722 & 0.393053 \tabularnewline
45 & -0.166782 & -1.5195 & 0.066224 \tabularnewline
46 & 0.032706 & 0.298 & 0.383237 \tabularnewline
47 & -0.021323 & -0.1943 & 0.423222 \tabularnewline
48 & 0.034255 & 0.3121 & 0.377882 \tabularnewline
\hline
\end{tabular}
%Source: https://freestatistics.org/blog/index.php?pk=233007&T=2

[TABLE]
[ROW][C]Partial Autocorrelation Function[/C][/ROW]
[ROW][C]Time lag k[/C][C]PACF(k)[/C][C]T-STAT[/C][C]P-value[/C][/ROW]
[ROW][C]1[/C][C]0.36541[/C][C]3.329[/C][C]0.000651[/C][/ROW]
[ROW][C]2[/C][C]0.014804[/C][C]0.1349[/C][C]0.446521[/C][/ROW]
[ROW][C]3[/C][C]-0.096236[/C][C]-0.8768[/C][C]0.191576[/C][/ROW]
[ROW][C]4[/C][C]0.080482[/C][C]0.7332[/C][C]0.232744[/C][/ROW]
[ROW][C]5[/C][C]-0.008548[/C][C]-0.0779[/C][C]0.469058[/C][/ROW]
[ROW][C]6[/C][C]-0.062486[/C][C]-0.5693[/C][C]0.285353[/C][/ROW]
[ROW][C]7[/C][C]-0.052994[/C][C]-0.4828[/C][C]0.315255[/C][/ROW]
[ROW][C]8[/C][C]-0.291314[/C][C]-2.654[/C][C]0.004766[/C][/ROW]
[ROW][C]9[/C][C]-0.065352[/C][C]-0.5954[/C][C]0.276603[/C][/ROW]
[ROW][C]10[/C][C]-0.081599[/C][C]-0.7434[/C][C]0.229668[/C][/ROW]
[ROW][C]11[/C][C]0.148163[/C][C]1.3498[/C][C]0.09037[/C][/ROW]
[ROW][C]12[/C][C]-0.138802[/C][C]-1.2645[/C][C]0.104787[/C][/ROW]
[ROW][C]13[/C][C]-0.104685[/C][C]-0.9537[/C][C]0.171495[/C][/ROW]
[ROW][C]14[/C][C]0.05886[/C][C]0.5362[/C][C]0.296615[/C][/ROW]
[ROW][C]15[/C][C]0.016364[/C][C]0.1491[/C][C]0.440924[/C][/ROW]
[ROW][C]16[/C][C]-0.042575[/C][C]-0.3879[/C][C]0.349551[/C][/ROW]
[ROW][C]17[/C][C]-0.034245[/C][C]-0.312[/C][C]0.377917[/C][/ROW]
[ROW][C]18[/C][C]0.024708[/C][C]0.2251[/C][C]0.411228[/C][/ROW]
[ROW][C]19[/C][C]0.111133[/C][C]1.0125[/C][C]0.157128[/C][/ROW]
[ROW][C]20[/C][C]-0.011574[/C][C]-0.1054[/C][C]0.45814[/C][/ROW]
[ROW][C]21[/C][C]-0.213921[/C][C]-1.9489[/C][C]0.027342[/C][/ROW]
[ROW][C]22[/C][C]-0.172864[/C][C]-1.5749[/C][C]0.059546[/C][/ROW]
[ROW][C]23[/C][C]-0.047113[/C][C]-0.4292[/C][C]0.334437[/C][/ROW]
[ROW][C]24[/C][C]-0.077991[/C][C]-0.7105[/C][C]0.239683[/C][/ROW]
[ROW][C]25[/C][C]-0.117915[/C][C]-1.0743[/C][C]0.14291[/C][/ROW]
[ROW][C]26[/C][C]-0.139244[/C][C]-1.2686[/C][C]0.104071[/C][/ROW]
[ROW][C]27[/C][C]0.057575[/C][C]0.5245[/C][C]0.300653[/C][/ROW]
[ROW][C]28[/C][C]-0.055872[/C][C]-0.509[/C][C]0.306046[/C][/ROW]
[ROW][C]29[/C][C]-0.117667[/C][C]-1.072[/C][C]0.143415[/C][/ROW]
[ROW][C]30[/C][C]-0.134089[/C][C]-1.2216[/C][C]0.112657[/C][/ROW]
[ROW][C]31[/C][C]0.065321[/C][C]0.5951[/C][C]0.276697[/C][/ROW]
[ROW][C]32[/C][C]0.032577[/C][C]0.2968[/C][C]0.383684[/C][/ROW]
[ROW][C]33[/C][C]-0.066678[/C][C]-0.6075[/C][C]0.272601[/C][/ROW]
[ROW][C]34[/C][C]-0.156663[/C][C]-1.4273[/C][C]0.078627[/C][/ROW]
[ROW][C]35[/C][C]0.050474[/C][C]0.4598[/C][C]0.323416[/C][/ROW]
[ROW][C]36[/C][C]-0.029987[/C][C]-0.2732[/C][C]0.392692[/C][/ROW]
[ROW][C]37[/C][C]0.062883[/C][C]0.5729[/C][C]0.284134[/C][/ROW]
[ROW][C]38[/C][C]0.026423[/C][C]0.2407[/C][C]0.40518[/C][/ROW]
[ROW][C]39[/C][C]-0.064724[/C][C]-0.5897[/C][C]0.278508[/C][/ROW]
[ROW][C]40[/C][C]-0.003475[/C][C]-0.0317[/C][C]0.487409[/C][/ROW]
[ROW][C]41[/C][C]0.059277[/C][C]0.54[/C][C]0.295307[/C][/ROW]
[ROW][C]42[/C][C]-0.010992[/C][C]-0.1001[/C][C]0.460236[/C][/ROW]
[ROW][C]43[/C][C]-0.00359[/C][C]-0.0327[/C][C]0.486995[/C][/ROW]
[ROW][C]44[/C][C]-0.029883[/C][C]-0.2722[/C][C]0.393053[/C][/ROW]
[ROW][C]45[/C][C]-0.166782[/C][C]-1.5195[/C][C]0.066224[/C][/ROW]
[ROW][C]46[/C][C]0.032706[/C][C]0.298[/C][C]0.383237[/C][/ROW]
[ROW][C]47[/C][C]-0.021323[/C][C]-0.1943[/C][C]0.423222[/C][/ROW]
[ROW][C]48[/C][C]0.034255[/C][C]0.3121[/C][C]0.377882[/C][/ROW]
[/TABLE]
Source: https://freestatistics.org/blog/index.php?pk=233007&T=2

Globally Unique Identifier (entire table): ba.freestatistics.org/blog/index.php?pk=233007&T=2

As an alternative you can also use a QR Code:  

The GUIDs for individual cells are displayed in the table below:

Partial Autocorrelation Function
Time lag kPACF(k)T-STATP-value
10.365413.3290.000651
20.0148040.13490.446521
3-0.096236-0.87680.191576
40.0804820.73320.232744
5-0.008548-0.07790.469058
6-0.062486-0.56930.285353
7-0.052994-0.48280.315255
8-0.291314-2.6540.004766
9-0.065352-0.59540.276603
10-0.081599-0.74340.229668
110.1481631.34980.09037
12-0.138802-1.26450.104787
13-0.104685-0.95370.171495
140.058860.53620.296615
150.0163640.14910.440924
16-0.042575-0.38790.349551
17-0.034245-0.3120.377917
180.0247080.22510.411228
190.1111331.01250.157128
20-0.011574-0.10540.45814
21-0.213921-1.94890.027342
22-0.172864-1.57490.059546
23-0.047113-0.42920.334437
24-0.077991-0.71050.239683
25-0.117915-1.07430.14291
26-0.139244-1.26860.104071
270.0575750.52450.300653
28-0.055872-0.5090.306046
29-0.117667-1.0720.143415
30-0.134089-1.22160.112657
310.0653210.59510.276697
320.0325770.29680.383684
33-0.066678-0.60750.272601
34-0.156663-1.42730.078627
350.0504740.45980.323416
36-0.029987-0.27320.392692
370.0628830.57290.284134
380.0264230.24070.40518
39-0.064724-0.58970.278508
40-0.003475-0.03170.487409
410.0592770.540.295307
42-0.010992-0.10010.460236
43-0.00359-0.03270.486995
44-0.029883-0.27220.393053
45-0.166782-1.51950.066224
460.0327060.2980.383237
47-0.021323-0.19430.423222
480.0342550.31210.377882


Parameters (Session):
par1 = 48 ; par2 = 1 ; par3 = 1 ; par4 = 0 ; par5 = 12 ; par6 = White Noise ; par7 = 0.95 ;
Parameters (R input):
par1 = 48 ; par2 = 1 ; par3 = 1 ; par4 = 0 ; par5 = 12 ; par6 = White Noise ; par7 = 0.95 ; par8 = ;
R code (references can be found in the software module):
if (par1 == 'Default') {
par1 = 10*log10(length(x))
} else {
par1 <- as.numeric(par1)
}
par2 <- as.numeric(par2)
par3 <- as.numeric(par3)
par4 <- as.numeric(par4)
par5 <- as.numeric(par5)
if (par6 == 'White Noise') par6 <- 'white' else par6 <- 'ma'
par7 <- as.numeric(par7)
if (par8 != '') par8 <- as.numeric(par8)
ox <- x
if (par8 == '') {
if (par2 == 0) {
x <- log(x)
} else {
x <- (x ^ par2 - 1) / par2
}
} else {
x <- log(x,base=par8)
}
if (par3 > 0) x <- diff(x,lag=1,difference=par3)
if (par4 > 0) x <- diff(x,lag=par5,difference=par4)
bitmap(file='picts.png')
op <- par(mfrow=c(2,1))
plot(ox,type='l',main='Original Time Series',xlab='time',ylab='value')
if (par8=='') {
mytitle <- paste('Working Time Series (lambda=',par2,', d=',par3,', D=',par4,')',sep='')
mysub <- paste('(lambda=',par2,', d=',par3,', D=',par4,', CI=', par7, ', CI type=',par6,')',sep='')
} else {
mytitle <- paste('Working Time Series (base=',par8,', d=',par3,', D=',par4,')',sep='')
mysub <- paste('(base=',par8,', d=',par3,', D=',par4,', CI=', par7, ', CI type=',par6,')',sep='')
}
plot(x,type='l', main=mytitle,xlab='time',ylab='value')
par(op)
dev.off()
bitmap(file='pic1.png')
racf <- acf(x, par1, main='Autocorrelation', xlab='time lag', ylab='ACF', ci.type=par6, ci=par7, sub=mysub)
dev.off()
bitmap(file='pic2.png')
rpacf <- pacf(x,par1,main='Partial Autocorrelation',xlab='lags',ylab='PACF',sub=mysub)
dev.off()
(myacf <- c(racf$acf))
(mypacf <- c(rpacf$acf))
lengthx <- length(x)
sqrtn <- sqrt(lengthx)
load(file='createtable')
a<-table.start()
a<-table.row.start(a)
a<-table.element(a,'Autocorrelation Function',4,TRUE)
a<-table.row.end(a)
a<-table.row.start(a)
a<-table.element(a,'Time lag k',header=TRUE)
a<-table.element(a,hyperlink('basics.htm','ACF(k)','click here for more information about the Autocorrelation Function'),header=TRUE)
a<-table.element(a,'T-STAT',header=TRUE)
a<-table.element(a,'P-value',header=TRUE)
a<-table.row.end(a)
for (i in 2:(par1+1)) {
a<-table.row.start(a)
a<-table.element(a,i-1,header=TRUE)
a<-table.element(a,round(myacf[i],6))
mytstat <- myacf[i]*sqrtn
a<-table.element(a,round(mytstat,4))
a<-table.element(a,round(1-pt(abs(mytstat),lengthx),6))
a<-table.row.end(a)
}
a<-table.end(a)
table.save(a,file='mytable.tab')
a<-table.start()
a<-table.row.start(a)
a<-table.element(a,'Partial Autocorrelation Function',4,TRUE)
a<-table.row.end(a)
a<-table.row.start(a)
a<-table.element(a,'Time lag k',header=TRUE)
a<-table.element(a,hyperlink('basics.htm','PACF(k)','click here for more information about the Partial Autocorrelation Function'),header=TRUE)
a<-table.element(a,'T-STAT',header=TRUE)
a<-table.element(a,'P-value',header=TRUE)
a<-table.row.end(a)
for (i in 1:par1) {
a<-table.row.start(a)
a<-table.element(a,i,header=TRUE)
a<-table.element(a,round(mypacf[i],6))
mytstat <- mypacf[i]*sqrtn
a<-table.element(a,round(mytstat,4))
a<-table.element(a,round(1-pt(abs(mytstat),lengthx),6))
a<-table.row.end(a)
}
a<-table.end(a)
table.save(a,file='mytable1.tab')