Free Statistics

of Irreproducible Research!

Author's title

Author*Unverified author*
R Software Modulerwasp_autocorrelation.wasp
Title produced by software(Partial) Autocorrelation Function
Date of computationSun, 12 Jan 2014 09:35:40 -0500
Cite this page as followsStatistical Computations at FreeStatistics.org, Office for Research Development and Education, URL https://freestatistics.org/blog/index.php?v=date/2014/Jan/12/t1389537364c5088lgce7ghdvv.htm/, Retrieved Mon, 27 May 2024 01:00:30 +0000
Statistical Computations at FreeStatistics.org, Office for Research Development and Education, URL https://freestatistics.org/blog/index.php?pk=233005, Retrieved Mon, 27 May 2024 01:00:30 +0000
QR Codes:

Original text written by user:
IsPrivate?No (this computation is public)
User-defined keywords
Estimated Impact84
Family? (F = Feedback message, R = changed R code, M = changed R Module, P = changed Parameters, D = changed Data)
-     [(Partial) Autocorrelation Function] [] [2013-11-21 15:51:25] [7693d6bd9b394a2eae1da409a7dd3216]
- R PD    [(Partial) Autocorrelation Function] [] [2014-01-12 14:35:40] [ffc6217b42a6800413892efb2ef7f057] [Current]
-   PD      [(Partial) Autocorrelation Function] [] [2014-01-12 14:48:55] [7693d6bd9b394a2eae1da409a7dd3216]
Feedback Forum

Post a new message
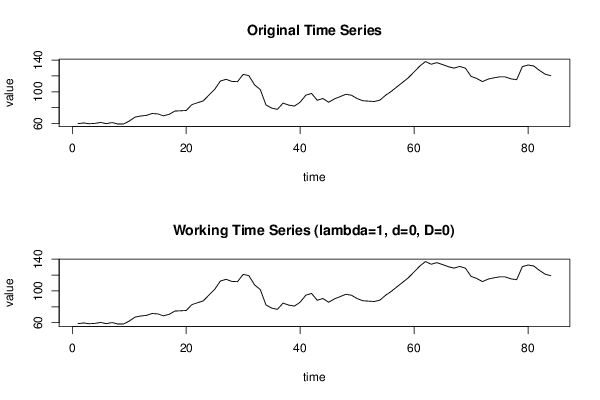
Dataseries X:
59,8
60,7
59,7
60,2
61,3
59,8
61,2
59,3
59,4
63,1
68
69,4
70,2
72,6
72,1
69,7
71,5
75,7
76
76,4
83,8
86,2
88,5
95,9
103,1
113,5
115,7
113,1
112,7
121,9
120,3
108,7
102,8
83,4
79,4
77,8
85,7
83,2
82
86,9
95,7
97,9
89,3
91,5
86,8
91
93,8
96,8
95,7
91,4
88,7
88,2
87,7
89,5
95,6
100,5
106,3
112
117,7
125
132,4
138,1
134,7
136,7
134,3
131,6
129,8
131,9
129,8
119,4
116,7
112,8
116
117,5
118,8
118,7
116,3
115,2
131,7
133,7
132,5
126,9
122,2
120,2


Summary of computational transaction
Raw Inputview raw input (R code)
Raw Outputview raw output of R engine
Computing time3 seconds
R Server'Gwilym Jenkins' @ jenkins.wessa.net

\begin{tabular}{lllllllll}
\hline
Summary of computational transaction \tabularnewline
Raw Input & view raw input (R code)  \tabularnewline
Raw Output & view raw output of R engine  \tabularnewline
Computing time & 3 seconds \tabularnewline
R Server & 'Gwilym Jenkins' @ jenkins.wessa.net \tabularnewline
\hline
\end{tabular}
%Source: https://freestatistics.org/blog/index.php?pk=233005&T=0

[TABLE]
[ROW][C]Summary of computational transaction[/C][/ROW]
[ROW][C]Raw Input[/C][C]view raw input (R code) [/C][/ROW]
[ROW][C]Raw Output[/C][C]view raw output of R engine [/C][/ROW]
[ROW][C]Computing time[/C][C]3 seconds[/C][/ROW]
[ROW][C]R Server[/C][C]'Gwilym Jenkins' @ jenkins.wessa.net[/C][/ROW]
[/TABLE]
Source: https://freestatistics.org/blog/index.php?pk=233005&T=0

Globally Unique Identifier (entire table): ba.freestatistics.org/blog/index.php?pk=233005&T=0

As an alternative you can also use a QR Code:  

The GUIDs for individual cells are displayed in the table below:

Summary of computational transaction
Raw Inputview raw input (R code)
Raw Outputview raw output of R engine
Computing time3 seconds
R Server'Gwilym Jenkins' @ jenkins.wessa.net


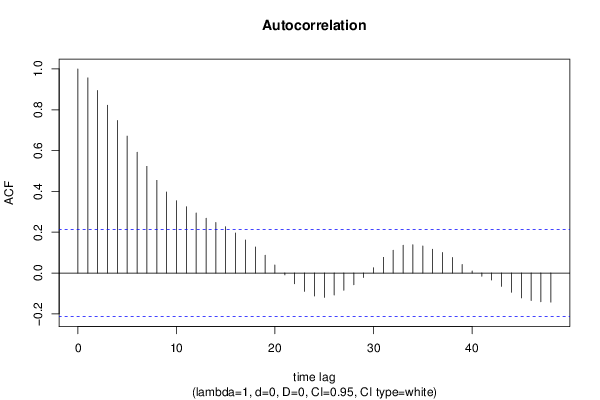
Autocorrelation Function
Time lag kACF(k)T-STATP-value
10.9561928.76360
20.8945918.19910
30.8222667.53620
40.7477216.8530
50.6708866.14880
60.5919635.42540
70.5225734.78954e-06
80.4540054.1613.8e-05
90.3972493.64080.000234
100.3540013.24450.000845
110.3243812.9730.001924
120.2939972.69450.004256
130.2683062.45910.007991
140.2473212.26670.012988
150.2263712.07470.020536
160.1960851.79720.037953
170.1616261.48130.071131
180.1277651.1710.122458
190.0869220.79670.21395
200.0390520.35790.36065
21-0.009322-0.08540.466059
22-0.052274-0.47910.316558
23-0.089978-0.82470.205949
24-0.113016-1.03580.151633
25-0.119627-1.09640.138019
26-0.107982-0.98970.162588
27-0.084855-0.77770.219462
28-0.057777-0.52950.298915
29-0.022411-0.20540.418878
300.0260660.23890.405883
310.0766870.70280.242047
320.1117781.02450.154279
330.1356941.24370.108543
340.1387461.27160.103508
350.1326731.2160.113701
360.1162711.06560.144821
370.1002890.91920.180322
380.0762670.6990.243243
390.0419460.38440.350811
400.0097250.08910.464596
41-0.015623-0.14320.443244
42-0.034589-0.3170.37601
43-0.065468-0.60.275054
44-0.094572-0.86680.194269
45-0.121848-1.11680.133641
46-0.134584-1.23350.110417
47-0.140757-1.29010.100285
48-0.142676-1.30770.09728

\begin{tabular}{lllllllll}
\hline
Autocorrelation Function \tabularnewline
Time lag k & ACF(k) & T-STAT & P-value \tabularnewline
1 & 0.956192 & 8.7636 & 0 \tabularnewline
2 & 0.894591 & 8.1991 & 0 \tabularnewline
3 & 0.822266 & 7.5362 & 0 \tabularnewline
4 & 0.747721 & 6.853 & 0 \tabularnewline
5 & 0.670886 & 6.1488 & 0 \tabularnewline
6 & 0.591963 & 5.4254 & 0 \tabularnewline
7 & 0.522573 & 4.7895 & 4e-06 \tabularnewline
8 & 0.454005 & 4.161 & 3.8e-05 \tabularnewline
9 & 0.397249 & 3.6408 & 0.000234 \tabularnewline
10 & 0.354001 & 3.2445 & 0.000845 \tabularnewline
11 & 0.324381 & 2.973 & 0.001924 \tabularnewline
12 & 0.293997 & 2.6945 & 0.004256 \tabularnewline
13 & 0.268306 & 2.4591 & 0.007991 \tabularnewline
14 & 0.247321 & 2.2667 & 0.012988 \tabularnewline
15 & 0.226371 & 2.0747 & 0.020536 \tabularnewline
16 & 0.196085 & 1.7972 & 0.037953 \tabularnewline
17 & 0.161626 & 1.4813 & 0.071131 \tabularnewline
18 & 0.127765 & 1.171 & 0.122458 \tabularnewline
19 & 0.086922 & 0.7967 & 0.21395 \tabularnewline
20 & 0.039052 & 0.3579 & 0.36065 \tabularnewline
21 & -0.009322 & -0.0854 & 0.466059 \tabularnewline
22 & -0.052274 & -0.4791 & 0.316558 \tabularnewline
23 & -0.089978 & -0.8247 & 0.205949 \tabularnewline
24 & -0.113016 & -1.0358 & 0.151633 \tabularnewline
25 & -0.119627 & -1.0964 & 0.138019 \tabularnewline
26 & -0.107982 & -0.9897 & 0.162588 \tabularnewline
27 & -0.084855 & -0.7777 & 0.219462 \tabularnewline
28 & -0.057777 & -0.5295 & 0.298915 \tabularnewline
29 & -0.022411 & -0.2054 & 0.418878 \tabularnewline
30 & 0.026066 & 0.2389 & 0.405883 \tabularnewline
31 & 0.076687 & 0.7028 & 0.242047 \tabularnewline
32 & 0.111778 & 1.0245 & 0.154279 \tabularnewline
33 & 0.135694 & 1.2437 & 0.108543 \tabularnewline
34 & 0.138746 & 1.2716 & 0.103508 \tabularnewline
35 & 0.132673 & 1.216 & 0.113701 \tabularnewline
36 & 0.116271 & 1.0656 & 0.144821 \tabularnewline
37 & 0.100289 & 0.9192 & 0.180322 \tabularnewline
38 & 0.076267 & 0.699 & 0.243243 \tabularnewline
39 & 0.041946 & 0.3844 & 0.350811 \tabularnewline
40 & 0.009725 & 0.0891 & 0.464596 \tabularnewline
41 & -0.015623 & -0.1432 & 0.443244 \tabularnewline
42 & -0.034589 & -0.317 & 0.37601 \tabularnewline
43 & -0.065468 & -0.6 & 0.275054 \tabularnewline
44 & -0.094572 & -0.8668 & 0.194269 \tabularnewline
45 & -0.121848 & -1.1168 & 0.133641 \tabularnewline
46 & -0.134584 & -1.2335 & 0.110417 \tabularnewline
47 & -0.140757 & -1.2901 & 0.100285 \tabularnewline
48 & -0.142676 & -1.3077 & 0.09728 \tabularnewline
\hline
\end{tabular}
%Source: https://freestatistics.org/blog/index.php?pk=233005&T=1

[TABLE]
[ROW][C]Autocorrelation Function[/C][/ROW]
[ROW][C]Time lag k[/C][C]ACF(k)[/C][C]T-STAT[/C][C]P-value[/C][/ROW]
[ROW][C]1[/C][C]0.956192[/C][C]8.7636[/C][C]0[/C][/ROW]
[ROW][C]2[/C][C]0.894591[/C][C]8.1991[/C][C]0[/C][/ROW]
[ROW][C]3[/C][C]0.822266[/C][C]7.5362[/C][C]0[/C][/ROW]
[ROW][C]4[/C][C]0.747721[/C][C]6.853[/C][C]0[/C][/ROW]
[ROW][C]5[/C][C]0.670886[/C][C]6.1488[/C][C]0[/C][/ROW]
[ROW][C]6[/C][C]0.591963[/C][C]5.4254[/C][C]0[/C][/ROW]
[ROW][C]7[/C][C]0.522573[/C][C]4.7895[/C][C]4e-06[/C][/ROW]
[ROW][C]8[/C][C]0.454005[/C][C]4.161[/C][C]3.8e-05[/C][/ROW]
[ROW][C]9[/C][C]0.397249[/C][C]3.6408[/C][C]0.000234[/C][/ROW]
[ROW][C]10[/C][C]0.354001[/C][C]3.2445[/C][C]0.000845[/C][/ROW]
[ROW][C]11[/C][C]0.324381[/C][C]2.973[/C][C]0.001924[/C][/ROW]
[ROW][C]12[/C][C]0.293997[/C][C]2.6945[/C][C]0.004256[/C][/ROW]
[ROW][C]13[/C][C]0.268306[/C][C]2.4591[/C][C]0.007991[/C][/ROW]
[ROW][C]14[/C][C]0.247321[/C][C]2.2667[/C][C]0.012988[/C][/ROW]
[ROW][C]15[/C][C]0.226371[/C][C]2.0747[/C][C]0.020536[/C][/ROW]
[ROW][C]16[/C][C]0.196085[/C][C]1.7972[/C][C]0.037953[/C][/ROW]
[ROW][C]17[/C][C]0.161626[/C][C]1.4813[/C][C]0.071131[/C][/ROW]
[ROW][C]18[/C][C]0.127765[/C][C]1.171[/C][C]0.122458[/C][/ROW]
[ROW][C]19[/C][C]0.086922[/C][C]0.7967[/C][C]0.21395[/C][/ROW]
[ROW][C]20[/C][C]0.039052[/C][C]0.3579[/C][C]0.36065[/C][/ROW]
[ROW][C]21[/C][C]-0.009322[/C][C]-0.0854[/C][C]0.466059[/C][/ROW]
[ROW][C]22[/C][C]-0.052274[/C][C]-0.4791[/C][C]0.316558[/C][/ROW]
[ROW][C]23[/C][C]-0.089978[/C][C]-0.8247[/C][C]0.205949[/C][/ROW]
[ROW][C]24[/C][C]-0.113016[/C][C]-1.0358[/C][C]0.151633[/C][/ROW]
[ROW][C]25[/C][C]-0.119627[/C][C]-1.0964[/C][C]0.138019[/C][/ROW]
[ROW][C]26[/C][C]-0.107982[/C][C]-0.9897[/C][C]0.162588[/C][/ROW]
[ROW][C]27[/C][C]-0.084855[/C][C]-0.7777[/C][C]0.219462[/C][/ROW]
[ROW][C]28[/C][C]-0.057777[/C][C]-0.5295[/C][C]0.298915[/C][/ROW]
[ROW][C]29[/C][C]-0.022411[/C][C]-0.2054[/C][C]0.418878[/C][/ROW]
[ROW][C]30[/C][C]0.026066[/C][C]0.2389[/C][C]0.405883[/C][/ROW]
[ROW][C]31[/C][C]0.076687[/C][C]0.7028[/C][C]0.242047[/C][/ROW]
[ROW][C]32[/C][C]0.111778[/C][C]1.0245[/C][C]0.154279[/C][/ROW]
[ROW][C]33[/C][C]0.135694[/C][C]1.2437[/C][C]0.108543[/C][/ROW]
[ROW][C]34[/C][C]0.138746[/C][C]1.2716[/C][C]0.103508[/C][/ROW]
[ROW][C]35[/C][C]0.132673[/C][C]1.216[/C][C]0.113701[/C][/ROW]
[ROW][C]36[/C][C]0.116271[/C][C]1.0656[/C][C]0.144821[/C][/ROW]
[ROW][C]37[/C][C]0.100289[/C][C]0.9192[/C][C]0.180322[/C][/ROW]
[ROW][C]38[/C][C]0.076267[/C][C]0.699[/C][C]0.243243[/C][/ROW]
[ROW][C]39[/C][C]0.041946[/C][C]0.3844[/C][C]0.350811[/C][/ROW]
[ROW][C]40[/C][C]0.009725[/C][C]0.0891[/C][C]0.464596[/C][/ROW]
[ROW][C]41[/C][C]-0.015623[/C][C]-0.1432[/C][C]0.443244[/C][/ROW]
[ROW][C]42[/C][C]-0.034589[/C][C]-0.317[/C][C]0.37601[/C][/ROW]
[ROW][C]43[/C][C]-0.065468[/C][C]-0.6[/C][C]0.275054[/C][/ROW]
[ROW][C]44[/C][C]-0.094572[/C][C]-0.8668[/C][C]0.194269[/C][/ROW]
[ROW][C]45[/C][C]-0.121848[/C][C]-1.1168[/C][C]0.133641[/C][/ROW]
[ROW][C]46[/C][C]-0.134584[/C][C]-1.2335[/C][C]0.110417[/C][/ROW]
[ROW][C]47[/C][C]-0.140757[/C][C]-1.2901[/C][C]0.100285[/C][/ROW]
[ROW][C]48[/C][C]-0.142676[/C][C]-1.3077[/C][C]0.09728[/C][/ROW]
[/TABLE]
Source: https://freestatistics.org/blog/index.php?pk=233005&T=1

Globally Unique Identifier (entire table): ba.freestatistics.org/blog/index.php?pk=233005&T=1

As an alternative you can also use a QR Code:  

The GUIDs for individual cells are displayed in the table below:

Autocorrelation Function
Time lag kACF(k)T-STATP-value
10.9561928.76360
20.8945918.19910
30.8222667.53620
40.7477216.8530
50.6708866.14880
60.5919635.42540
70.5225734.78954e-06
80.4540054.1613.8e-05
90.3972493.64080.000234
100.3540013.24450.000845
110.3243812.9730.001924
120.2939972.69450.004256
130.2683062.45910.007991
140.2473212.26670.012988
150.2263712.07470.020536
160.1960851.79720.037953
170.1616261.48130.071131
180.1277651.1710.122458
190.0869220.79670.21395
200.0390520.35790.36065
21-0.009322-0.08540.466059
22-0.052274-0.47910.316558
23-0.089978-0.82470.205949
24-0.113016-1.03580.151633
25-0.119627-1.09640.138019
26-0.107982-0.98970.162588
27-0.084855-0.77770.219462
28-0.057777-0.52950.298915
29-0.022411-0.20540.418878
300.0260660.23890.405883
310.0766870.70280.242047
320.1117781.02450.154279
330.1356941.24370.108543
340.1387461.27160.103508
350.1326731.2160.113701
360.1162711.06560.144821
370.1002890.91920.180322
380.0762670.6990.243243
390.0419460.38440.350811
400.0097250.08910.464596
41-0.015623-0.14320.443244
42-0.034589-0.3170.37601
43-0.065468-0.60.275054
44-0.094572-0.86680.194269
45-0.121848-1.11680.133641
46-0.134584-1.23350.110417
47-0.140757-1.29010.100285
48-0.142676-1.30770.09728


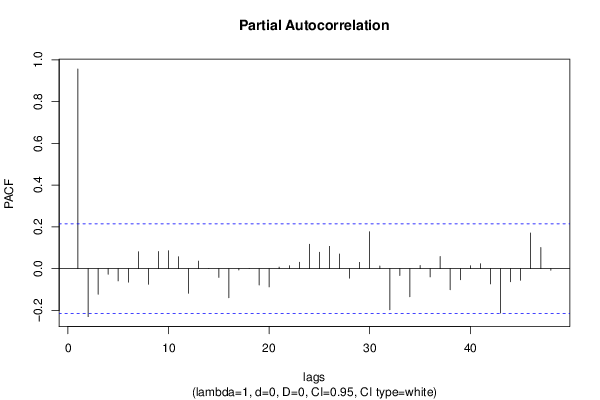
Partial Autocorrelation Function
Time lag kPACF(k)T-STATP-value
10.9561928.76360
2-0.230016-2.10810.019
3-0.122606-1.12370.132171
4-0.027247-0.24970.401707
5-0.058921-0.540.295305
6-0.064829-0.59420.276997
70.0811240.74350.229622
8-0.074592-0.68360.24804
90.0822530.75390.226521
100.0855190.78380.217682
110.0570220.52260.301309
12-0.11816-1.0830.140964
130.0358730.32880.371569
140.0002160.0020.499213
15-0.042138-0.38620.350161
16-0.139822-1.28150.101773
17-0.006735-0.06170.475463
18-0.000472-0.00430.49828
19-0.078122-0.7160.237989
20-0.087414-0.80120.212649
210.0071020.06510.474129
220.0141530.12970.448553
230.0306830.28120.389619
240.1170731.0730.143174
250.0783480.71810.237354
260.1066780.97770.16551
270.0703320.64460.260471
28-0.045544-0.41740.33872
290.0298670.27370.39248
300.1765841.61840.05466
310.012580.11530.454241
32-0.197182-1.80720.037155
33-0.03309-0.30330.381217
34-0.134973-1.23710.109757
350.0150060.13750.445469
36-0.039641-0.36330.358641
370.0582240.53360.297504
38-0.101435-0.92970.177605
39-0.053251-0.48810.31339
400.013640.1250.450406
410.0233680.21420.415468
42-0.073079-0.66980.252417
43-0.21222-1.9450.027559
44-0.062823-0.57580.28315
45-0.055559-0.50920.305971
460.1705961.56350.060843
470.1013880.92920.177716
48-0.007869-0.07210.471337

\begin{tabular}{lllllllll}
\hline
Partial Autocorrelation Function \tabularnewline
Time lag k & PACF(k) & T-STAT & P-value \tabularnewline
1 & 0.956192 & 8.7636 & 0 \tabularnewline
2 & -0.230016 & -2.1081 & 0.019 \tabularnewline
3 & -0.122606 & -1.1237 & 0.132171 \tabularnewline
4 & -0.027247 & -0.2497 & 0.401707 \tabularnewline
5 & -0.058921 & -0.54 & 0.295305 \tabularnewline
6 & -0.064829 & -0.5942 & 0.276997 \tabularnewline
7 & 0.081124 & 0.7435 & 0.229622 \tabularnewline
8 & -0.074592 & -0.6836 & 0.24804 \tabularnewline
9 & 0.082253 & 0.7539 & 0.226521 \tabularnewline
10 & 0.085519 & 0.7838 & 0.217682 \tabularnewline
11 & 0.057022 & 0.5226 & 0.301309 \tabularnewline
12 & -0.11816 & -1.083 & 0.140964 \tabularnewline
13 & 0.035873 & 0.3288 & 0.371569 \tabularnewline
14 & 0.000216 & 0.002 & 0.499213 \tabularnewline
15 & -0.042138 & -0.3862 & 0.350161 \tabularnewline
16 & -0.139822 & -1.2815 & 0.101773 \tabularnewline
17 & -0.006735 & -0.0617 & 0.475463 \tabularnewline
18 & -0.000472 & -0.0043 & 0.49828 \tabularnewline
19 & -0.078122 & -0.716 & 0.237989 \tabularnewline
20 & -0.087414 & -0.8012 & 0.212649 \tabularnewline
21 & 0.007102 & 0.0651 & 0.474129 \tabularnewline
22 & 0.014153 & 0.1297 & 0.448553 \tabularnewline
23 & 0.030683 & 0.2812 & 0.389619 \tabularnewline
24 & 0.117073 & 1.073 & 0.143174 \tabularnewline
25 & 0.078348 & 0.7181 & 0.237354 \tabularnewline
26 & 0.106678 & 0.9777 & 0.16551 \tabularnewline
27 & 0.070332 & 0.6446 & 0.260471 \tabularnewline
28 & -0.045544 & -0.4174 & 0.33872 \tabularnewline
29 & 0.029867 & 0.2737 & 0.39248 \tabularnewline
30 & 0.176584 & 1.6184 & 0.05466 \tabularnewline
31 & 0.01258 & 0.1153 & 0.454241 \tabularnewline
32 & -0.197182 & -1.8072 & 0.037155 \tabularnewline
33 & -0.03309 & -0.3033 & 0.381217 \tabularnewline
34 & -0.134973 & -1.2371 & 0.109757 \tabularnewline
35 & 0.015006 & 0.1375 & 0.445469 \tabularnewline
36 & -0.039641 & -0.3633 & 0.358641 \tabularnewline
37 & 0.058224 & 0.5336 & 0.297504 \tabularnewline
38 & -0.101435 & -0.9297 & 0.177605 \tabularnewline
39 & -0.053251 & -0.4881 & 0.31339 \tabularnewline
40 & 0.01364 & 0.125 & 0.450406 \tabularnewline
41 & 0.023368 & 0.2142 & 0.415468 \tabularnewline
42 & -0.073079 & -0.6698 & 0.252417 \tabularnewline
43 & -0.21222 & -1.945 & 0.027559 \tabularnewline
44 & -0.062823 & -0.5758 & 0.28315 \tabularnewline
45 & -0.055559 & -0.5092 & 0.305971 \tabularnewline
46 & 0.170596 & 1.5635 & 0.060843 \tabularnewline
47 & 0.101388 & 0.9292 & 0.177716 \tabularnewline
48 & -0.007869 & -0.0721 & 0.471337 \tabularnewline
\hline
\end{tabular}
%Source: https://freestatistics.org/blog/index.php?pk=233005&T=2

[TABLE]
[ROW][C]Partial Autocorrelation Function[/C][/ROW]
[ROW][C]Time lag k[/C][C]PACF(k)[/C][C]T-STAT[/C][C]P-value[/C][/ROW]
[ROW][C]1[/C][C]0.956192[/C][C]8.7636[/C][C]0[/C][/ROW]
[ROW][C]2[/C][C]-0.230016[/C][C]-2.1081[/C][C]0.019[/C][/ROW]
[ROW][C]3[/C][C]-0.122606[/C][C]-1.1237[/C][C]0.132171[/C][/ROW]
[ROW][C]4[/C][C]-0.027247[/C][C]-0.2497[/C][C]0.401707[/C][/ROW]
[ROW][C]5[/C][C]-0.058921[/C][C]-0.54[/C][C]0.295305[/C][/ROW]
[ROW][C]6[/C][C]-0.064829[/C][C]-0.5942[/C][C]0.276997[/C][/ROW]
[ROW][C]7[/C][C]0.081124[/C][C]0.7435[/C][C]0.229622[/C][/ROW]
[ROW][C]8[/C][C]-0.074592[/C][C]-0.6836[/C][C]0.24804[/C][/ROW]
[ROW][C]9[/C][C]0.082253[/C][C]0.7539[/C][C]0.226521[/C][/ROW]
[ROW][C]10[/C][C]0.085519[/C][C]0.7838[/C][C]0.217682[/C][/ROW]
[ROW][C]11[/C][C]0.057022[/C][C]0.5226[/C][C]0.301309[/C][/ROW]
[ROW][C]12[/C][C]-0.11816[/C][C]-1.083[/C][C]0.140964[/C][/ROW]
[ROW][C]13[/C][C]0.035873[/C][C]0.3288[/C][C]0.371569[/C][/ROW]
[ROW][C]14[/C][C]0.000216[/C][C]0.002[/C][C]0.499213[/C][/ROW]
[ROW][C]15[/C][C]-0.042138[/C][C]-0.3862[/C][C]0.350161[/C][/ROW]
[ROW][C]16[/C][C]-0.139822[/C][C]-1.2815[/C][C]0.101773[/C][/ROW]
[ROW][C]17[/C][C]-0.006735[/C][C]-0.0617[/C][C]0.475463[/C][/ROW]
[ROW][C]18[/C][C]-0.000472[/C][C]-0.0043[/C][C]0.49828[/C][/ROW]
[ROW][C]19[/C][C]-0.078122[/C][C]-0.716[/C][C]0.237989[/C][/ROW]
[ROW][C]20[/C][C]-0.087414[/C][C]-0.8012[/C][C]0.212649[/C][/ROW]
[ROW][C]21[/C][C]0.007102[/C][C]0.0651[/C][C]0.474129[/C][/ROW]
[ROW][C]22[/C][C]0.014153[/C][C]0.1297[/C][C]0.448553[/C][/ROW]
[ROW][C]23[/C][C]0.030683[/C][C]0.2812[/C][C]0.389619[/C][/ROW]
[ROW][C]24[/C][C]0.117073[/C][C]1.073[/C][C]0.143174[/C][/ROW]
[ROW][C]25[/C][C]0.078348[/C][C]0.7181[/C][C]0.237354[/C][/ROW]
[ROW][C]26[/C][C]0.106678[/C][C]0.9777[/C][C]0.16551[/C][/ROW]
[ROW][C]27[/C][C]0.070332[/C][C]0.6446[/C][C]0.260471[/C][/ROW]
[ROW][C]28[/C][C]-0.045544[/C][C]-0.4174[/C][C]0.33872[/C][/ROW]
[ROW][C]29[/C][C]0.029867[/C][C]0.2737[/C][C]0.39248[/C][/ROW]
[ROW][C]30[/C][C]0.176584[/C][C]1.6184[/C][C]0.05466[/C][/ROW]
[ROW][C]31[/C][C]0.01258[/C][C]0.1153[/C][C]0.454241[/C][/ROW]
[ROW][C]32[/C][C]-0.197182[/C][C]-1.8072[/C][C]0.037155[/C][/ROW]
[ROW][C]33[/C][C]-0.03309[/C][C]-0.3033[/C][C]0.381217[/C][/ROW]
[ROW][C]34[/C][C]-0.134973[/C][C]-1.2371[/C][C]0.109757[/C][/ROW]
[ROW][C]35[/C][C]0.015006[/C][C]0.1375[/C][C]0.445469[/C][/ROW]
[ROW][C]36[/C][C]-0.039641[/C][C]-0.3633[/C][C]0.358641[/C][/ROW]
[ROW][C]37[/C][C]0.058224[/C][C]0.5336[/C][C]0.297504[/C][/ROW]
[ROW][C]38[/C][C]-0.101435[/C][C]-0.9297[/C][C]0.177605[/C][/ROW]
[ROW][C]39[/C][C]-0.053251[/C][C]-0.4881[/C][C]0.31339[/C][/ROW]
[ROW][C]40[/C][C]0.01364[/C][C]0.125[/C][C]0.450406[/C][/ROW]
[ROW][C]41[/C][C]0.023368[/C][C]0.2142[/C][C]0.415468[/C][/ROW]
[ROW][C]42[/C][C]-0.073079[/C][C]-0.6698[/C][C]0.252417[/C][/ROW]
[ROW][C]43[/C][C]-0.21222[/C][C]-1.945[/C][C]0.027559[/C][/ROW]
[ROW][C]44[/C][C]-0.062823[/C][C]-0.5758[/C][C]0.28315[/C][/ROW]
[ROW][C]45[/C][C]-0.055559[/C][C]-0.5092[/C][C]0.305971[/C][/ROW]
[ROW][C]46[/C][C]0.170596[/C][C]1.5635[/C][C]0.060843[/C][/ROW]
[ROW][C]47[/C][C]0.101388[/C][C]0.9292[/C][C]0.177716[/C][/ROW]
[ROW][C]48[/C][C]-0.007869[/C][C]-0.0721[/C][C]0.471337[/C][/ROW]
[/TABLE]
Source: https://freestatistics.org/blog/index.php?pk=233005&T=2

Globally Unique Identifier (entire table): ba.freestatistics.org/blog/index.php?pk=233005&T=2

As an alternative you can also use a QR Code:  

The GUIDs for individual cells are displayed in the table below:

Partial Autocorrelation Function
Time lag kPACF(k)T-STATP-value
10.9561928.76360
2-0.230016-2.10810.019
3-0.122606-1.12370.132171
4-0.027247-0.24970.401707
5-0.058921-0.540.295305
6-0.064829-0.59420.276997
70.0811240.74350.229622
8-0.074592-0.68360.24804
90.0822530.75390.226521
100.0855190.78380.217682
110.0570220.52260.301309
12-0.11816-1.0830.140964
130.0358730.32880.371569
140.0002160.0020.499213
15-0.042138-0.38620.350161
16-0.139822-1.28150.101773
17-0.006735-0.06170.475463
18-0.000472-0.00430.49828
19-0.078122-0.7160.237989
20-0.087414-0.80120.212649
210.0071020.06510.474129
220.0141530.12970.448553
230.0306830.28120.389619
240.1170731.0730.143174
250.0783480.71810.237354
260.1066780.97770.16551
270.0703320.64460.260471
28-0.045544-0.41740.33872
290.0298670.27370.39248
300.1765841.61840.05466
310.012580.11530.454241
32-0.197182-1.80720.037155
33-0.03309-0.30330.381217
34-0.134973-1.23710.109757
350.0150060.13750.445469
36-0.039641-0.36330.358641
370.0582240.53360.297504
38-0.101435-0.92970.177605
39-0.053251-0.48810.31339
400.013640.1250.450406
410.0233680.21420.415468
42-0.073079-0.66980.252417
43-0.21222-1.9450.027559
44-0.062823-0.57580.28315
45-0.055559-0.50920.305971
460.1705961.56350.060843
470.1013880.92920.177716
48-0.007869-0.07210.471337


Parameters (Session):
par1 = 48 ; par2 = 1 ; par3 = 0 ; par4 = 0 ; par5 = 12 ; par6 = White Noise ; par7 = 0.95 ;
Parameters (R input):
par1 = 48 ; par2 = 1 ; par3 = 0 ; par4 = 0 ; par5 = 12 ; par6 = White Noise ; par7 = 0.95 ; par8 = ;
R code (references can be found in the software module):
if (par1 == 'Default') {
par1 = 10*log10(length(x))
} else {
par1 <- as.numeric(par1)
}
par2 <- as.numeric(par2)
par3 <- as.numeric(par3)
par4 <- as.numeric(par4)
par5 <- as.numeric(par5)
if (par6 == 'White Noise') par6 <- 'white' else par6 <- 'ma'
par7 <- as.numeric(par7)
if (par8 != '') par8 <- as.numeric(par8)
ox <- x
if (par8 == '') {
if (par2 == 0) {
x <- log(x)
} else {
x <- (x ^ par2 - 1) / par2
}
} else {
x <- log(x,base=par8)
}
if (par3 > 0) x <- diff(x,lag=1,difference=par3)
if (par4 > 0) x <- diff(x,lag=par5,difference=par4)
bitmap(file='picts.png')
op <- par(mfrow=c(2,1))
plot(ox,type='l',main='Original Time Series',xlab='time',ylab='value')
if (par8=='') {
mytitle <- paste('Working Time Series (lambda=',par2,', d=',par3,', D=',par4,')',sep='')
mysub <- paste('(lambda=',par2,', d=',par3,', D=',par4,', CI=', par7, ', CI type=',par6,')',sep='')
} else {
mytitle <- paste('Working Time Series (base=',par8,', d=',par3,', D=',par4,')',sep='')
mysub <- paste('(base=',par8,', d=',par3,', D=',par4,', CI=', par7, ', CI type=',par6,')',sep='')
}
plot(x,type='l', main=mytitle,xlab='time',ylab='value')
par(op)
dev.off()
bitmap(file='pic1.png')
racf <- acf(x, par1, main='Autocorrelation', xlab='time lag', ylab='ACF', ci.type=par6, ci=par7, sub=mysub)
dev.off()
bitmap(file='pic2.png')
rpacf <- pacf(x,par1,main='Partial Autocorrelation',xlab='lags',ylab='PACF',sub=mysub)
dev.off()
(myacf <- c(racf$acf))
(mypacf <- c(rpacf$acf))
lengthx <- length(x)
sqrtn <- sqrt(lengthx)
load(file='createtable')
a<-table.start()
a<-table.row.start(a)
a<-table.element(a,'Autocorrelation Function',4,TRUE)
a<-table.row.end(a)
a<-table.row.start(a)
a<-table.element(a,'Time lag k',header=TRUE)
a<-table.element(a,hyperlink('basics.htm','ACF(k)','click here for more information about the Autocorrelation Function'),header=TRUE)
a<-table.element(a,'T-STAT',header=TRUE)
a<-table.element(a,'P-value',header=TRUE)
a<-table.row.end(a)
for (i in 2:(par1+1)) {
a<-table.row.start(a)
a<-table.element(a,i-1,header=TRUE)
a<-table.element(a,round(myacf[i],6))
mytstat <- myacf[i]*sqrtn
a<-table.element(a,round(mytstat,4))
a<-table.element(a,round(1-pt(abs(mytstat),lengthx),6))
a<-table.row.end(a)
}
a<-table.end(a)
table.save(a,file='mytable.tab')
a<-table.start()
a<-table.row.start(a)
a<-table.element(a,'Partial Autocorrelation Function',4,TRUE)
a<-table.row.end(a)
a<-table.row.start(a)
a<-table.element(a,'Time lag k',header=TRUE)
a<-table.element(a,hyperlink('basics.htm','PACF(k)','click here for more information about the Partial Autocorrelation Function'),header=TRUE)
a<-table.element(a,'T-STAT',header=TRUE)
a<-table.element(a,'P-value',header=TRUE)
a<-table.row.end(a)
for (i in 1:par1) {
a<-table.row.start(a)
a<-table.element(a,i,header=TRUE)
a<-table.element(a,round(mypacf[i],6))
mytstat <- mypacf[i]*sqrtn
a<-table.element(a,round(mytstat,4))
a<-table.element(a,round(1-pt(abs(mytstat),lengthx),6))
a<-table.row.end(a)
}
a<-table.end(a)
table.save(a,file='mytable1.tab')