Free Statistics

of Irreproducible Research!

Author's title

Author*Unverified author*
R Software Modulerwasp_smp.wasp
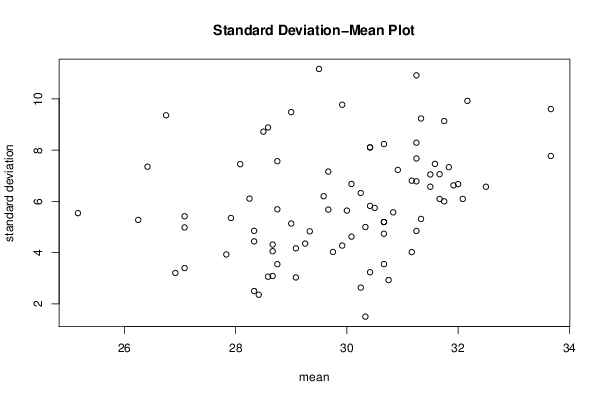
Title produced by softwareStandard Deviation-Mean Plot
Date of computationSun, 12 Jan 2014 06:42:50 -0500
Cite this page as followsStatistical Computations at FreeStatistics.org, Office for Research Development and Education, URL https://freestatistics.org/blog/index.php?v=date/2014/Jan/12/t13895269895qgpg81hyncv0cj.htm/, Retrieved Sun, 19 May 2024 04:24:53 +0000
Statistical Computations at FreeStatistics.org, Office for Research Development and Education, URL https://freestatistics.org/blog/index.php?pk=232982, Retrieved Sun, 19 May 2024 04:24:53 +0000
QR Codes:

Original text written by user:
IsPrivate?No (this computation is public)
User-defined keywords
Estimated Impact116
Family? (F = Feedback message, R = changed R code, M = changed R Module, P = changed Parameters, D = changed Data)
-       [Standard Deviation-Mean Plot] [] [2014-01-12 11:42:50] [62a6597007cd6653b71a687b26797f80] [Current]
Feedback Forum

Post a new message
Dataseries X:
25
25
25
25
29
30
30
29
35
30
30
30
29
30
30
26
30
30
30
35
30
30
30
50
25
29
30
25
30
30
25
42
29
15
29
30
25
20
10
30
29
30
50
25
30
30
25
50
29
30
30
30
30
30
30
29
35
40
29
26
23
25
30
30
30
30
20
29
25
25
28
30
30
25
30
31
30
29
45
30
30
35
30
30
25
50
40
20
35
22
30
25
30
30
29
50
45
30
26
30
29
35
20
29
25
30
45
35
30
30
40
20
26
29
20
25
30
30
25
30
23
25
30
30
40
30
40
35
40
30
25
33
30
30
30
35
33
35
30
40
29
25
27
30
30
35
20
30
30
25
25
30
30
30
40
40
30
40
20
50
20
30
30
30
30
25
30
30
30
30
30
30
23
30
25
50
20
23
25
29
26
40
30
30
35
20
29
25
30
30
30
50
30
35
30
30
30
35
30
35
15
30
20
35
40
30
30
40
29
30
20
35
50
30
30
40
30
50
18
15
30
23
29
30
35
30
23
30
25
26
25
30
20
25
30
29
40
30
30
30
40
37
20
25
30
32
35
32
30
30
35
30
25
30
24
30
35
30
30
30
30
30
25
30
25
35
30
30
30
30
30
30
35
32
30
20
20
30
35
30
40
29
26
40
25
35
30
23
30
27
35
30
20
30
25
50
30
30
29
35
29
25
30
45
30
25
29
25
40
30
30
40
30
30
29
35
35
30
30
27
30
30
29
50
30
30
20
25
25
30
27
29
50
50
30
30
40
20
30
30
30
25
30
30
30
30
40
25
35
30
30
35
20
20
50
35
29
50
40
30
45
30
40
30
29
25
40
35
25
21
30
30
30
30
15
30
30
30
30
30
25
30
30
30
30
25
25
40
30
33
40
26
30
37
25
29
30
25
29
30
30
30
30
30
22
25
30
40
30
29
25
30
30
29
30
30
30
35
30
35
30
12
15
25
30
30
30
25
20
30
35
35
29
40
30
40
30
25
30
20
29
28
30
25
30
50
30
30
29
30
35
20
30
30
30
30
30
40
30
30
35
25
30
50
30
30
30
30
25
30
30
30
25
30
30
30
25
30
30
26
30
30
30
30
25
20
30
35
30
20
20
25
30
30
30
30
29
35
25
30
30
35
35
30
20
30
30
30
25
30
30
26
30
25
30
50
30
20
29
30
30
30
30
30
40
30
35
27
30
25
29
25
30
25
30
29
25
20
30
25
32
30
29
30
30
30
30
25
25
30
30
60
20
30
35
25
30
25
30
40
25
30
29
29
30
29
26
18
30
40
30
30
30
30
30
29
30
30
30
35
30
30
30
20
29
20
30
30
25
30
40
30
30
25
40
30
30
29
25
30
35
30
20
30
20
25
30
40
25
47
20
20
30
30
25
30
25
40
29
40
29
30
30
30
35
30
20
30
24
30
40
30
30
15
35
18
30
25
30
30
30
15
20
30
25
30
20
30
30
30
25
40
50
30
30
35
30
30
15
30
25
30
30
26
30
25
25
30
30
30
50
30
25
30
25
30
26
25
34
30
25
30
35
30
40
30
30
29
30
29
30
50
30
15
30
25
50
30
30
35
35
25
23
30
30
30
35
25
15
30
29
30
15
30
40
29
30
25
25
50
30
1
30
30
30
35
30
30
35
30
20
20
20
30
35
30
25
29
35
40
30
35
29
30
30
30
29
30
30
30
30
30
30
30
35
30
30
30
25
50
30
30
30
25
25
35
30
35
30
29
30
35
30
30
35
25
25
29
35
50
30
30
29
30
30
30
20
30
30
20
30
25
20
30
50
20
40
40
30
29
35
25
20
20
21
29
35
30
28
30
30
35
26
30
25
25
30
30
30
25
35
30
35
35
30
29
30
26
30
27
30
30
50
25
30
30
30
40
30
32
25
35
30
30
20
30
40
30
26
30
40
30
30
26
35
35
26
50
30
30
25
30
40
25
30
25
30
15
40
30
25
30
30
30
30
30
25
25
30
20
18
25
30
29
13
27
30
30
30
30
25
30
35
29
30
29
30
30
25
45
29
30
30
25
25
29
30
30
30
29
30
23
35
35
10
32
29
45
30
29
30
15
50
35
25
25
30
30
30
30
30
40
29
25
30
25
30
25
25
30
35
30
25
20
30
30
30
15
30
35
50
35
30
30
25
30
30
15
30
25
30
30
25
29
30
30
40
25
30
30
25
35
29
30
25
30
30
25
30
30
30
25
35
25
29
25
30
30
50
30
30


Summary of computational transaction
Raw Inputview raw input (R code)
Raw Outputview raw output of R engine
Computing time4 seconds
R Server'Herman Ole Andreas Wold' @ wold.wessa.net

\begin{tabular}{lllllllll}
\hline
Summary of computational transaction \tabularnewline
Raw Input & view raw input (R code)  \tabularnewline
Raw Output & view raw output of R engine  \tabularnewline
Computing time & 4 seconds \tabularnewline
R Server & 'Herman Ole Andreas Wold' @ wold.wessa.net \tabularnewline
\hline
\end{tabular}
%Source: https://freestatistics.org/blog/index.php?pk=232982&T=0

[TABLE]
[ROW][C]Summary of computational transaction[/C][/ROW]
[ROW][C]Raw Input[/C][C]view raw input (R code) [/C][/ROW]
[ROW][C]Raw Output[/C][C]view raw output of R engine [/C][/ROW]
[ROW][C]Computing time[/C][C]4 seconds[/C][/ROW]
[ROW][C]R Server[/C][C]'Herman Ole Andreas Wold' @ wold.wessa.net[/C][/ROW]
[/TABLE]
Source: https://freestatistics.org/blog/index.php?pk=232982&T=0

Globally Unique Identifier (entire table): ba.freestatistics.org/blog/index.php?pk=232982&T=0

As an alternative you can also use a QR Code:  

The GUIDs for individual cells are displayed in the table below:

Summary of computational transaction
Raw Inputview raw input (R code)
Raw Outputview raw output of R engine
Computing time4 seconds
R Server'Herman Ole Andreas Wold' @ wold.wessa.net


Standard Deviation-Mean Plot
SectionMeanStandard DeviationRange
128.58333333333333.0587678248047210
231.66666666666676.0952042747979524
328.256.1070004540244327
429.511.172205772280740
530.66666666666673.5505014583943814
627.08333333333333.396745322787510
731.254.8453351511812620
832.16666666666679.9254799135936730
931.58333333333337.4645627447089625
1027.91666666666675.350587619952420
1131.756.0018936405710517
1231.16666666666674.0188947674099615
1330.41666666666675.8225007644065820
1430.41666666666678.1067685898696430
1528.757.5693761001455430
1631.257.6767062065587930
1729.58333333333336.2005620468607320
1833.66666666666677.7733031861778330
1928.58333333333338.887768237438735
2028.33333333333334.8492423650660620
2131.33333333333335.3143601912576720
2229.08333333333333.0289011909011511
2329.754.0254869835270215
2430.256.3263518138598120
2530.91666666666677.2294641236506330
2631.56.5712874067277120
2732.08333333333336.0970683466927323
2831.33333333333339.2376043070340130
29305.6407607481776620
3033.66666666666679.6042919698655730
3131.66666666666677.0624916197322224
3228.33333333333334.4381268229929715
3330.83333333333335.5732042902271315
3429.254.3510709235564318
3530.252.6328346286499210
3626.41666666666677.3541371576367423
3729.66666666666675.6782412983620420
3831.16666666666676.8068592855540530
3932.56.5712874067277125
4028.41666666666672.353269807709865
4127.08333333333334.9810245994781115
4230.752.9271456776494410
4329.66666666666677.1647284200682330
4430.08333333333334.6212617980439720
4526.91666666666673.2039275140289210
4631.759.1365897755821835
47295.134553180524720
4829.33333333333334.8304589153964822
4928.66666666666674.3134743080329815
5030.33333333333334.996968778139115
5128.58.7230103227560827
5230.66666666666674.7354242074224415
5328.08333333333337.4523740370353725
5426.255.2764485301108615
5531.258.291561975888535
5630.08333333333336.680478117529325
5728.753.5451631581891710
5830.66666666666678.23885840871135
5931.57.0517567121443427
60299.4868329805051435
6126.759.362643371884434
6230.66666666666675.1932356936400420
6330.33333333333331.497472618255256
6431.256.7840052529996825
6531.91666666666676.6258218472514925
6627.83333333333333.9273709303097910
6729.91666666666679.7743479980957730
6828.66666666666674.0526833609649814
6930.41666666666673.2321772378645510
70326.6742381247191525
7130.55.7445626465380320
7231.83333333333337.3340220062308825
7328.755.6909018297949625
7425.16666666666675.5404846084949717
7530.66666666666675.1932356936400420
7628.33333333333332.498484389069557
7731.2510.922245856299640
7829.08333333333334.1660605619770615
7927.08333333333335.4181233472541620
8030.41666666666678.1067685898696435
8129.91666666666674.2737748554587615
8228.66666666666673.0846639225613410

\begin{tabular}{lllllllll}
\hline
Standard Deviation-Mean Plot \tabularnewline
Section & Mean & Standard Deviation & Range \tabularnewline
1 & 28.5833333333333 & 3.05876782480472 & 10 \tabularnewline
2 & 31.6666666666667 & 6.09520427479795 & 24 \tabularnewline
3 & 28.25 & 6.10700045402443 & 27 \tabularnewline
4 & 29.5 & 11.1722057722807 & 40 \tabularnewline
5 & 30.6666666666667 & 3.55050145839438 & 14 \tabularnewline
6 & 27.0833333333333 & 3.3967453227875 & 10 \tabularnewline
7 & 31.25 & 4.84533515118126 & 20 \tabularnewline
8 & 32.1666666666667 & 9.92547991359367 & 30 \tabularnewline
9 & 31.5833333333333 & 7.46456274470896 & 25 \tabularnewline
10 & 27.9166666666667 & 5.3505876199524 & 20 \tabularnewline
11 & 31.75 & 6.00189364057105 & 17 \tabularnewline
12 & 31.1666666666667 & 4.01889476740996 & 15 \tabularnewline
13 & 30.4166666666667 & 5.82250076440658 & 20 \tabularnewline
14 & 30.4166666666667 & 8.10676858986964 & 30 \tabularnewline
15 & 28.75 & 7.56937610014554 & 30 \tabularnewline
16 & 31.25 & 7.67670620655879 & 30 \tabularnewline
17 & 29.5833333333333 & 6.20056204686073 & 20 \tabularnewline
18 & 33.6666666666667 & 7.77330318617783 & 30 \tabularnewline
19 & 28.5833333333333 & 8.8877682374387 & 35 \tabularnewline
20 & 28.3333333333333 & 4.84924236506606 & 20 \tabularnewline
21 & 31.3333333333333 & 5.31436019125767 & 20 \tabularnewline
22 & 29.0833333333333 & 3.02890119090115 & 11 \tabularnewline
23 & 29.75 & 4.02548698352702 & 15 \tabularnewline
24 & 30.25 & 6.32635181385981 & 20 \tabularnewline
25 & 30.9166666666667 & 7.22946412365063 & 30 \tabularnewline
26 & 31.5 & 6.57128740672771 & 20 \tabularnewline
27 & 32.0833333333333 & 6.09706834669273 & 23 \tabularnewline
28 & 31.3333333333333 & 9.23760430703401 & 30 \tabularnewline
29 & 30 & 5.64076074817766 & 20 \tabularnewline
30 & 33.6666666666667 & 9.60429196986557 & 30 \tabularnewline
31 & 31.6666666666667 & 7.06249161973222 & 24 \tabularnewline
32 & 28.3333333333333 & 4.43812682299297 & 15 \tabularnewline
33 & 30.8333333333333 & 5.57320429022713 & 15 \tabularnewline
34 & 29.25 & 4.35107092355643 & 18 \tabularnewline
35 & 30.25 & 2.63283462864992 & 10 \tabularnewline
36 & 26.4166666666667 & 7.35413715763674 & 23 \tabularnewline
37 & 29.6666666666667 & 5.67824129836204 & 20 \tabularnewline
38 & 31.1666666666667 & 6.80685928555405 & 30 \tabularnewline
39 & 32.5 & 6.57128740672771 & 25 \tabularnewline
40 & 28.4166666666667 & 2.35326980770986 & 5 \tabularnewline
41 & 27.0833333333333 & 4.98102459947811 & 15 \tabularnewline
42 & 30.75 & 2.92714567764944 & 10 \tabularnewline
43 & 29.6666666666667 & 7.16472842006823 & 30 \tabularnewline
44 & 30.0833333333333 & 4.62126179804397 & 20 \tabularnewline
45 & 26.9166666666667 & 3.20392751402892 & 10 \tabularnewline
46 & 31.75 & 9.13658977558218 & 35 \tabularnewline
47 & 29 & 5.1345531805247 & 20 \tabularnewline
48 & 29.3333333333333 & 4.83045891539648 & 22 \tabularnewline
49 & 28.6666666666667 & 4.31347430803298 & 15 \tabularnewline
50 & 30.3333333333333 & 4.9969687781391 & 15 \tabularnewline
51 & 28.5 & 8.72301032275608 & 27 \tabularnewline
52 & 30.6666666666667 & 4.73542420742244 & 15 \tabularnewline
53 & 28.0833333333333 & 7.45237403703537 & 25 \tabularnewline
54 & 26.25 & 5.27644853011086 & 15 \tabularnewline
55 & 31.25 & 8.2915619758885 & 35 \tabularnewline
56 & 30.0833333333333 & 6.6804781175293 & 25 \tabularnewline
57 & 28.75 & 3.54516315818917 & 10 \tabularnewline
58 & 30.6666666666667 & 8.238858408711 & 35 \tabularnewline
59 & 31.5 & 7.05175671214434 & 27 \tabularnewline
60 & 29 & 9.48683298050514 & 35 \tabularnewline
61 & 26.75 & 9.3626433718844 & 34 \tabularnewline
62 & 30.6666666666667 & 5.19323569364004 & 20 \tabularnewline
63 & 30.3333333333333 & 1.49747261825525 & 6 \tabularnewline
64 & 31.25 & 6.78400525299968 & 25 \tabularnewline
65 & 31.9166666666667 & 6.62582184725149 & 25 \tabularnewline
66 & 27.8333333333333 & 3.92737093030979 & 10 \tabularnewline
67 & 29.9166666666667 & 9.77434799809577 & 30 \tabularnewline
68 & 28.6666666666667 & 4.05268336096498 & 14 \tabularnewline
69 & 30.4166666666667 & 3.23217723786455 & 10 \tabularnewline
70 & 32 & 6.67423812471915 & 25 \tabularnewline
71 & 30.5 & 5.74456264653803 & 20 \tabularnewline
72 & 31.8333333333333 & 7.33402200623088 & 25 \tabularnewline
73 & 28.75 & 5.69090182979496 & 25 \tabularnewline
74 & 25.1666666666667 & 5.54048460849497 & 17 \tabularnewline
75 & 30.6666666666667 & 5.19323569364004 & 20 \tabularnewline
76 & 28.3333333333333 & 2.49848438906955 & 7 \tabularnewline
77 & 31.25 & 10.9222458562996 & 40 \tabularnewline
78 & 29.0833333333333 & 4.16606056197706 & 15 \tabularnewline
79 & 27.0833333333333 & 5.41812334725416 & 20 \tabularnewline
80 & 30.4166666666667 & 8.10676858986964 & 35 \tabularnewline
81 & 29.9166666666667 & 4.27377485545876 & 15 \tabularnewline
82 & 28.6666666666667 & 3.08466392256134 & 10 \tabularnewline
\hline
\end{tabular}
%Source: https://freestatistics.org/blog/index.php?pk=232982&T=1

[TABLE]
[ROW][C]Standard Deviation-Mean Plot[/C][/ROW]
[ROW][C]Section[/C][C]Mean[/C][C]Standard Deviation[/C][C]Range[/C][/ROW]
[ROW][C]1[/C][C]28.5833333333333[/C][C]3.05876782480472[/C][C]10[/C][/ROW]
[ROW][C]2[/C][C]31.6666666666667[/C][C]6.09520427479795[/C][C]24[/C][/ROW]
[ROW][C]3[/C][C]28.25[/C][C]6.10700045402443[/C][C]27[/C][/ROW]
[ROW][C]4[/C][C]29.5[/C][C]11.1722057722807[/C][C]40[/C][/ROW]
[ROW][C]5[/C][C]30.6666666666667[/C][C]3.55050145839438[/C][C]14[/C][/ROW]
[ROW][C]6[/C][C]27.0833333333333[/C][C]3.3967453227875[/C][C]10[/C][/ROW]
[ROW][C]7[/C][C]31.25[/C][C]4.84533515118126[/C][C]20[/C][/ROW]
[ROW][C]8[/C][C]32.1666666666667[/C][C]9.92547991359367[/C][C]30[/C][/ROW]
[ROW][C]9[/C][C]31.5833333333333[/C][C]7.46456274470896[/C][C]25[/C][/ROW]
[ROW][C]10[/C][C]27.9166666666667[/C][C]5.3505876199524[/C][C]20[/C][/ROW]
[ROW][C]11[/C][C]31.75[/C][C]6.00189364057105[/C][C]17[/C][/ROW]
[ROW][C]12[/C][C]31.1666666666667[/C][C]4.01889476740996[/C][C]15[/C][/ROW]
[ROW][C]13[/C][C]30.4166666666667[/C][C]5.82250076440658[/C][C]20[/C][/ROW]
[ROW][C]14[/C][C]30.4166666666667[/C][C]8.10676858986964[/C][C]30[/C][/ROW]
[ROW][C]15[/C][C]28.75[/C][C]7.56937610014554[/C][C]30[/C][/ROW]
[ROW][C]16[/C][C]31.25[/C][C]7.67670620655879[/C][C]30[/C][/ROW]
[ROW][C]17[/C][C]29.5833333333333[/C][C]6.20056204686073[/C][C]20[/C][/ROW]
[ROW][C]18[/C][C]33.6666666666667[/C][C]7.77330318617783[/C][C]30[/C][/ROW]
[ROW][C]19[/C][C]28.5833333333333[/C][C]8.8877682374387[/C][C]35[/C][/ROW]
[ROW][C]20[/C][C]28.3333333333333[/C][C]4.84924236506606[/C][C]20[/C][/ROW]
[ROW][C]21[/C][C]31.3333333333333[/C][C]5.31436019125767[/C][C]20[/C][/ROW]
[ROW][C]22[/C][C]29.0833333333333[/C][C]3.02890119090115[/C][C]11[/C][/ROW]
[ROW][C]23[/C][C]29.75[/C][C]4.02548698352702[/C][C]15[/C][/ROW]
[ROW][C]24[/C][C]30.25[/C][C]6.32635181385981[/C][C]20[/C][/ROW]
[ROW][C]25[/C][C]30.9166666666667[/C][C]7.22946412365063[/C][C]30[/C][/ROW]
[ROW][C]26[/C][C]31.5[/C][C]6.57128740672771[/C][C]20[/C][/ROW]
[ROW][C]27[/C][C]32.0833333333333[/C][C]6.09706834669273[/C][C]23[/C][/ROW]
[ROW][C]28[/C][C]31.3333333333333[/C][C]9.23760430703401[/C][C]30[/C][/ROW]
[ROW][C]29[/C][C]30[/C][C]5.64076074817766[/C][C]20[/C][/ROW]
[ROW][C]30[/C][C]33.6666666666667[/C][C]9.60429196986557[/C][C]30[/C][/ROW]
[ROW][C]31[/C][C]31.6666666666667[/C][C]7.06249161973222[/C][C]24[/C][/ROW]
[ROW][C]32[/C][C]28.3333333333333[/C][C]4.43812682299297[/C][C]15[/C][/ROW]
[ROW][C]33[/C][C]30.8333333333333[/C][C]5.57320429022713[/C][C]15[/C][/ROW]
[ROW][C]34[/C][C]29.25[/C][C]4.35107092355643[/C][C]18[/C][/ROW]
[ROW][C]35[/C][C]30.25[/C][C]2.63283462864992[/C][C]10[/C][/ROW]
[ROW][C]36[/C][C]26.4166666666667[/C][C]7.35413715763674[/C][C]23[/C][/ROW]
[ROW][C]37[/C][C]29.6666666666667[/C][C]5.67824129836204[/C][C]20[/C][/ROW]
[ROW][C]38[/C][C]31.1666666666667[/C][C]6.80685928555405[/C][C]30[/C][/ROW]
[ROW][C]39[/C][C]32.5[/C][C]6.57128740672771[/C][C]25[/C][/ROW]
[ROW][C]40[/C][C]28.4166666666667[/C][C]2.35326980770986[/C][C]5[/C][/ROW]
[ROW][C]41[/C][C]27.0833333333333[/C][C]4.98102459947811[/C][C]15[/C][/ROW]
[ROW][C]42[/C][C]30.75[/C][C]2.92714567764944[/C][C]10[/C][/ROW]
[ROW][C]43[/C][C]29.6666666666667[/C][C]7.16472842006823[/C][C]30[/C][/ROW]
[ROW][C]44[/C][C]30.0833333333333[/C][C]4.62126179804397[/C][C]20[/C][/ROW]
[ROW][C]45[/C][C]26.9166666666667[/C][C]3.20392751402892[/C][C]10[/C][/ROW]
[ROW][C]46[/C][C]31.75[/C][C]9.13658977558218[/C][C]35[/C][/ROW]
[ROW][C]47[/C][C]29[/C][C]5.1345531805247[/C][C]20[/C][/ROW]
[ROW][C]48[/C][C]29.3333333333333[/C][C]4.83045891539648[/C][C]22[/C][/ROW]
[ROW][C]49[/C][C]28.6666666666667[/C][C]4.31347430803298[/C][C]15[/C][/ROW]
[ROW][C]50[/C][C]30.3333333333333[/C][C]4.9969687781391[/C][C]15[/C][/ROW]
[ROW][C]51[/C][C]28.5[/C][C]8.72301032275608[/C][C]27[/C][/ROW]
[ROW][C]52[/C][C]30.6666666666667[/C][C]4.73542420742244[/C][C]15[/C][/ROW]
[ROW][C]53[/C][C]28.0833333333333[/C][C]7.45237403703537[/C][C]25[/C][/ROW]
[ROW][C]54[/C][C]26.25[/C][C]5.27644853011086[/C][C]15[/C][/ROW]
[ROW][C]55[/C][C]31.25[/C][C]8.2915619758885[/C][C]35[/C][/ROW]
[ROW][C]56[/C][C]30.0833333333333[/C][C]6.6804781175293[/C][C]25[/C][/ROW]
[ROW][C]57[/C][C]28.75[/C][C]3.54516315818917[/C][C]10[/C][/ROW]
[ROW][C]58[/C][C]30.6666666666667[/C][C]8.238858408711[/C][C]35[/C][/ROW]
[ROW][C]59[/C][C]31.5[/C][C]7.05175671214434[/C][C]27[/C][/ROW]
[ROW][C]60[/C][C]29[/C][C]9.48683298050514[/C][C]35[/C][/ROW]
[ROW][C]61[/C][C]26.75[/C][C]9.3626433718844[/C][C]34[/C][/ROW]
[ROW][C]62[/C][C]30.6666666666667[/C][C]5.19323569364004[/C][C]20[/C][/ROW]
[ROW][C]63[/C][C]30.3333333333333[/C][C]1.49747261825525[/C][C]6[/C][/ROW]
[ROW][C]64[/C][C]31.25[/C][C]6.78400525299968[/C][C]25[/C][/ROW]
[ROW][C]65[/C][C]31.9166666666667[/C][C]6.62582184725149[/C][C]25[/C][/ROW]
[ROW][C]66[/C][C]27.8333333333333[/C][C]3.92737093030979[/C][C]10[/C][/ROW]
[ROW][C]67[/C][C]29.9166666666667[/C][C]9.77434799809577[/C][C]30[/C][/ROW]
[ROW][C]68[/C][C]28.6666666666667[/C][C]4.05268336096498[/C][C]14[/C][/ROW]
[ROW][C]69[/C][C]30.4166666666667[/C][C]3.23217723786455[/C][C]10[/C][/ROW]
[ROW][C]70[/C][C]32[/C][C]6.67423812471915[/C][C]25[/C][/ROW]
[ROW][C]71[/C][C]30.5[/C][C]5.74456264653803[/C][C]20[/C][/ROW]
[ROW][C]72[/C][C]31.8333333333333[/C][C]7.33402200623088[/C][C]25[/C][/ROW]
[ROW][C]73[/C][C]28.75[/C][C]5.69090182979496[/C][C]25[/C][/ROW]
[ROW][C]74[/C][C]25.1666666666667[/C][C]5.54048460849497[/C][C]17[/C][/ROW]
[ROW][C]75[/C][C]30.6666666666667[/C][C]5.19323569364004[/C][C]20[/C][/ROW]
[ROW][C]76[/C][C]28.3333333333333[/C][C]2.49848438906955[/C][C]7[/C][/ROW]
[ROW][C]77[/C][C]31.25[/C][C]10.9222458562996[/C][C]40[/C][/ROW]
[ROW][C]78[/C][C]29.0833333333333[/C][C]4.16606056197706[/C][C]15[/C][/ROW]
[ROW][C]79[/C][C]27.0833333333333[/C][C]5.41812334725416[/C][C]20[/C][/ROW]
[ROW][C]80[/C][C]30.4166666666667[/C][C]8.10676858986964[/C][C]35[/C][/ROW]
[ROW][C]81[/C][C]29.9166666666667[/C][C]4.27377485545876[/C][C]15[/C][/ROW]
[ROW][C]82[/C][C]28.6666666666667[/C][C]3.08466392256134[/C][C]10[/C][/ROW]
[/TABLE]
Source: https://freestatistics.org/blog/index.php?pk=232982&T=1

Globally Unique Identifier (entire table): ba.freestatistics.org/blog/index.php?pk=232982&T=1

As an alternative you can also use a QR Code:  

The GUIDs for individual cells are displayed in the table below:

Standard Deviation-Mean Plot
SectionMeanStandard DeviationRange
128.58333333333333.0587678248047210
231.66666666666676.0952042747979524
328.256.1070004540244327
429.511.172205772280740
530.66666666666673.5505014583943814
627.08333333333333.396745322787510
731.254.8453351511812620
832.16666666666679.9254799135936730
931.58333333333337.4645627447089625
1027.91666666666675.350587619952420
1131.756.0018936405710517
1231.16666666666674.0188947674099615
1330.41666666666675.8225007644065820
1430.41666666666678.1067685898696430
1528.757.5693761001455430
1631.257.6767062065587930
1729.58333333333336.2005620468607320
1833.66666666666677.7733031861778330
1928.58333333333338.887768237438735
2028.33333333333334.8492423650660620
2131.33333333333335.3143601912576720
2229.08333333333333.0289011909011511
2329.754.0254869835270215
2430.256.3263518138598120
2530.91666666666677.2294641236506330
2631.56.5712874067277120
2732.08333333333336.0970683466927323
2831.33333333333339.2376043070340130
29305.6407607481776620
3033.66666666666679.6042919698655730
3131.66666666666677.0624916197322224
3228.33333333333334.4381268229929715
3330.83333333333335.5732042902271315
3429.254.3510709235564318
3530.252.6328346286499210
3626.41666666666677.3541371576367423
3729.66666666666675.6782412983620420
3831.16666666666676.8068592855540530
3932.56.5712874067277125
4028.41666666666672.353269807709865
4127.08333333333334.9810245994781115
4230.752.9271456776494410
4329.66666666666677.1647284200682330
4430.08333333333334.6212617980439720
4526.91666666666673.2039275140289210
4631.759.1365897755821835
47295.134553180524720
4829.33333333333334.8304589153964822
4928.66666666666674.3134743080329815
5030.33333333333334.996968778139115
5128.58.7230103227560827
5230.66666666666674.7354242074224415
5328.08333333333337.4523740370353725
5426.255.2764485301108615
5531.258.291561975888535
5630.08333333333336.680478117529325
5728.753.5451631581891710
5830.66666666666678.23885840871135
5931.57.0517567121443427
60299.4868329805051435
6126.759.362643371884434
6230.66666666666675.1932356936400420
6330.33333333333331.497472618255256
6431.256.7840052529996825
6531.91666666666676.6258218472514925
6627.83333333333333.9273709303097910
6729.91666666666679.7743479980957730
6828.66666666666674.0526833609649814
6930.41666666666673.2321772378645510
70326.6742381247191525
7130.55.7445626465380320
7231.83333333333337.3340220062308825
7328.755.6909018297949625
7425.16666666666675.5404846084949717
7530.66666666666675.1932356936400420
7628.33333333333332.498484389069557
7731.2510.922245856299640
7829.08333333333334.1660605619770615
7927.08333333333335.4181233472541620
8030.41666666666678.1067685898696435
8129.91666666666674.2737748554587615
8228.66666666666673.0846639225613410


Regression: S.E.(k) = alpha + beta * Mean(k)
alpha-5.49109666268546
beta0.383527409676422
S.D.0.133332199719991
T-STAT2.87648002869421
p-value0.0051528709836815

\begin{tabular}{lllllllll}
\hline
Regression: S.E.(k) = alpha + beta * Mean(k) \tabularnewline
alpha & -5.49109666268546 \tabularnewline
beta & 0.383527409676422 \tabularnewline
S.D. & 0.133332199719991 \tabularnewline
T-STAT & 2.87648002869421 \tabularnewline
p-value & 0.0051528709836815 \tabularnewline
\hline
\end{tabular}
%Source: https://freestatistics.org/blog/index.php?pk=232982&T=2

[TABLE]
[ROW][C]Regression: S.E.(k) = alpha + beta * Mean(k)[/C][/ROW]
[ROW][C]alpha[/C][C]-5.49109666268546[/C][/ROW]
[ROW][C]beta[/C][C]0.383527409676422[/C][/ROW]
[ROW][C]S.D.[/C][C]0.133332199719991[/C][/ROW]
[ROW][C]T-STAT[/C][C]2.87648002869421[/C][/ROW]
[ROW][C]p-value[/C][C]0.0051528709836815[/C][/ROW]
[/TABLE]
Source: https://freestatistics.org/blog/index.php?pk=232982&T=2

Globally Unique Identifier (entire table): ba.freestatistics.org/blog/index.php?pk=232982&T=2

As an alternative you can also use a QR Code:  

The GUIDs for individual cells are displayed in the table below:

Regression: S.E.(k) = alpha + beta * Mean(k)
alpha-5.49109666268546
beta0.383527409676422
S.D.0.133332199719991
T-STAT2.87648002869421
p-value0.0051528709836815


Regression: ln S.E.(k) = alpha + beta * ln Mean(k)
alpha-4.95456488518437
beta1.96465919523177
S.D.0.72729254921951
T-STAT2.70133276814142
p-value0.00842821403342582
Lambda-0.96465919523177

\begin{tabular}{lllllllll}
\hline
Regression: ln S.E.(k) = alpha + beta * ln Mean(k) \tabularnewline
alpha & -4.95456488518437 \tabularnewline
beta & 1.96465919523177 \tabularnewline
S.D. & 0.72729254921951 \tabularnewline
T-STAT & 2.70133276814142 \tabularnewline
p-value & 0.00842821403342582 \tabularnewline
Lambda & -0.96465919523177 \tabularnewline
\hline
\end{tabular}
%Source: https://freestatistics.org/blog/index.php?pk=232982&T=3

[TABLE]
[ROW][C]Regression: ln S.E.(k) = alpha + beta * ln Mean(k)[/C][/ROW]
[ROW][C]alpha[/C][C]-4.95456488518437[/C][/ROW]
[ROW][C]beta[/C][C]1.96465919523177[/C][/ROW]
[ROW][C]S.D.[/C][C]0.72729254921951[/C][/ROW]
[ROW][C]T-STAT[/C][C]2.70133276814142[/C][/ROW]
[ROW][C]p-value[/C][C]0.00842821403342582[/C][/ROW]
[ROW][C]Lambda[/C][C]-0.96465919523177[/C][/ROW]
[/TABLE]
Source: https://freestatistics.org/blog/index.php?pk=232982&T=3

Globally Unique Identifier (entire table): ba.freestatistics.org/blog/index.php?pk=232982&T=3

As an alternative you can also use a QR Code:  

The GUIDs for individual cells are displayed in the table below:

Regression: ln S.E.(k) = alpha + beta * ln Mean(k)
alpha-4.95456488518437
beta1.96465919523177
S.D.0.72729254921951
T-STAT2.70133276814142
p-value0.00842821403342582
Lambda-0.96465919523177


Parameters (Session):
par1 = 12 ;
Parameters (R input):
par1 = 12 ;
R code (references can be found in the software module):
par1 <- as.numeric(par1)
(n <- length(x))
(np <- floor(n / par1))
arr <- array(NA,dim=c(par1,np))
j <- 0
k <- 1
for (i in 1:(np*par1))
{
j = j + 1
arr[j,k] <- x[i]
if (j == par1) {
j = 0
k=k+1
}
}
arr
arr.mean <- array(NA,dim=np)
arr.sd <- array(NA,dim=np)
arr.range <- array(NA,dim=np)
for (j in 1:np)
{
arr.mean[j] <- mean(arr[,j],na.rm=TRUE)
arr.sd[j] <- sd(arr[,j],na.rm=TRUE)
arr.range[j] <- max(arr[,j],na.rm=TRUE) - min(arr[,j],na.rm=TRUE)
}
arr.mean
arr.sd
arr.range
(lm1 <- lm(arr.sd~arr.mean))
(lnlm1 <- lm(log(arr.sd)~log(arr.mean)))
(lm2 <- lm(arr.range~arr.mean))
bitmap(file='test1.png')
plot(arr.mean,arr.sd,main='Standard Deviation-Mean Plot',xlab='mean',ylab='standard deviation')
dev.off()
bitmap(file='test2.png')
plot(arr.mean,arr.range,main='Range-Mean Plot',xlab='mean',ylab='range')
dev.off()
load(file='createtable')
a<-table.start()
a<-table.row.start(a)
a<-table.element(a,'Standard Deviation-Mean Plot',4,TRUE)
a<-table.row.end(a)
a<-table.row.start(a)
a<-table.element(a,'Section',header=TRUE)
a<-table.element(a,'Mean',header=TRUE)
a<-table.element(a,'Standard Deviation',header=TRUE)
a<-table.element(a,'Range',header=TRUE)
a<-table.row.end(a)
for (j in 1:np) {
a<-table.row.start(a)
a<-table.element(a,j,header=TRUE)
a<-table.element(a,arr.mean[j])
a<-table.element(a,arr.sd[j] )
a<-table.element(a,arr.range[j] )
a<-table.row.end(a)
}
a<-table.end(a)
table.save(a,file='mytable.tab')
a<-table.start()
a<-table.row.start(a)
a<-table.element(a,'Regression: S.E.(k) = alpha + beta * Mean(k)',2,TRUE)
a<-table.row.end(a)
a<-table.row.start(a)
a<-table.element(a,'alpha',header=TRUE)
a<-table.element(a,lm1$coefficients[[1]])
a<-table.row.end(a)
a<-table.row.start(a)
a<-table.element(a,'beta',header=TRUE)
a<-table.element(a,lm1$coefficients[[2]])
a<-table.row.end(a)
a<-table.row.start(a)
a<-table.element(a,'S.D.',header=TRUE)
a<-table.element(a,summary(lm1)$coefficients[2,2])
a<-table.row.end(a)
a<-table.row.start(a)
a<-table.element(a,'T-STAT',header=TRUE)
a<-table.element(a,summary(lm1)$coefficients[2,3])
a<-table.row.end(a)
a<-table.row.start(a)
a<-table.element(a,'p-value',header=TRUE)
a<-table.element(a,summary(lm1)$coefficients[2,4])
a<-table.row.end(a)
a<-table.end(a)
table.save(a,file='mytable1.tab')
a<-table.start()
a<-table.row.start(a)
a<-table.element(a,'Regression: ln S.E.(k) = alpha + beta * ln Mean(k)',2,TRUE)
a<-table.row.end(a)
a<-table.row.start(a)
a<-table.element(a,'alpha',header=TRUE)
a<-table.element(a,lnlm1$coefficients[[1]])
a<-table.row.end(a)
a<-table.row.start(a)
a<-table.element(a,'beta',header=TRUE)
a<-table.element(a,lnlm1$coefficients[[2]])
a<-table.row.end(a)
a<-table.row.start(a)
a<-table.element(a,'S.D.',header=TRUE)
a<-table.element(a,summary(lnlm1)$coefficients[2,2])
a<-table.row.end(a)
a<-table.row.start(a)
a<-table.element(a,'T-STAT',header=TRUE)
a<-table.element(a,summary(lnlm1)$coefficients[2,3])
a<-table.row.end(a)
a<-table.row.start(a)
a<-table.element(a,'p-value',header=TRUE)
a<-table.element(a,summary(lnlm1)$coefficients[2,4])
a<-table.row.end(a)
a<-table.row.start(a)
a<-table.element(a,'Lambda',header=TRUE)
a<-table.element(a,1-lnlm1$coefficients[[2]])
a<-table.row.end(a)
a<-table.end(a)
table.save(a,file='mytable2.tab')