Free Statistics

of Irreproducible Research!

Author's title

Author*Unverified author*
R Software Modulerwasp_autocorrelation.wasp
Title produced by software(Partial) Autocorrelation Function
Date of computationSun, 12 Jan 2014 04:47:21 -0500
Cite this page as followsStatistical Computations at FreeStatistics.org, Office for Research Development and Education, URL https://freestatistics.org/blog/index.php?v=date/2014/Jan/12/t1389520052c04xxy92arc6517.htm/, Retrieved Sun, 19 May 2024 05:15:40 +0000
Statistical Computations at FreeStatistics.org, Office for Research Development and Education, URL https://freestatistics.org/blog/index.php?pk=232960, Retrieved Sun, 19 May 2024 05:15:40 +0000
QR Codes:

Original text written by user:
IsPrivate?No (this computation is public)
User-defined keywords
Estimated Impact104
Family? (F = Feedback message, R = changed R code, M = changed R Module, P = changed Parameters, D = changed Data)
-       [(Partial) Autocorrelation Function] [] [2014-01-12 09:47:21] [655b7e86b856b1a975cbf3a4c6f4d54e] [Current]
Feedback Forum

Post a new message
Dataseries X:
5731
5040
6102
4904
5369
5578
4619
4731
5011
5227
4146
4625
4736
4219
5116
4205
4121
5103
4300
4578
3809
5657
4249
3830
4736
4840
4413
4571
4106
4801
3956
3829
4453
4027
4121
4798
3233
3554
3952
3951
3685
4312
3867
4140
4114
3818
3377
3453
3502
4017
5410
5184
5529
6434
4962
2980
2937
2969
2731
3163
3145
3173
3723
3224
4114
3446
2955
3879
4278
4177
3698
4449
4162
3961
5246
5170
3682
3495
3770
3291
3580
3898
3477
3054


Summary of computational transaction
Raw Inputview raw input (R code)
Raw Outputview raw output of R engine
Computing time4 seconds
R Server'Gertrude Mary Cox' @ cox.wessa.net

\begin{tabular}{lllllllll}
\hline
Summary of computational transaction \tabularnewline
Raw Input & view raw input (R code)  \tabularnewline
Raw Output & view raw output of R engine  \tabularnewline
Computing time & 4 seconds \tabularnewline
R Server & 'Gertrude Mary Cox' @ cox.wessa.net \tabularnewline
\hline
\end{tabular}
%Source: https://freestatistics.org/blog/index.php?pk=232960&T=0

[TABLE]
[ROW][C]Summary of computational transaction[/C][/ROW]
[ROW][C]Raw Input[/C][C]view raw input (R code) [/C][/ROW]
[ROW][C]Raw Output[/C][C]view raw output of R engine [/C][/ROW]
[ROW][C]Computing time[/C][C]4 seconds[/C][/ROW]
[ROW][C]R Server[/C][C]'Gertrude Mary Cox' @ cox.wessa.net[/C][/ROW]
[/TABLE]
Source: https://freestatistics.org/blog/index.php?pk=232960&T=0

Globally Unique Identifier (entire table): ba.freestatistics.org/blog/index.php?pk=232960&T=0

As an alternative you can also use a QR Code:  

The GUIDs for individual cells are displayed in the table below:

Summary of computational transaction
Raw Inputview raw input (R code)
Raw Outputview raw output of R engine
Computing time4 seconds
R Server'Gertrude Mary Cox' @ cox.wessa.net


Autocorrelation Function
Time lag kACF(k)T-STATP-value
1-0.30362-2.76610.003495
2-0.166695-1.51870.066323
30.2132261.94260.027729
4-0.097308-0.88650.18895
5-0.169833-1.54720.062804
6-0.00789-0.07190.471434
70.074730.68080.248938
8-0.0671-0.61130.271333
9-0.036067-0.32860.371647
100.1670581.5220.065908
11-0.098379-0.89630.186348
120.0908710.82790.205058
13-0.096166-0.87610.191749
14-0.018058-0.16450.434863
150.0215980.19680.422244
16-0.067381-0.61390.270489
17-0.029817-0.27160.393283
180.1006410.91690.180929
19-0.030114-0.27440.392246
20-0.101669-0.92630.1785
210.1777581.61950.054571
220.0003590.00330.498698
23-0.097596-0.88910.188249
240.1191671.08570.140385
250.0009130.00830.496691
26-0.104554-0.95250.171797
270.0779240.70990.239872
28-0.074796-0.68140.248751
290.0575250.52410.300812
300.0692890.63130.264804
31-0.130086-1.18510.119673
320.0447530.40770.342264
330.1105961.00760.158293
34-0.167339-1.52450.065589
35-0.002873-0.02620.48959
360.117991.07490.142759
37-0.033821-0.30810.379381
38-0.130845-1.19210.118318
390.1002770.91360.181795
400.0294460.26830.394579
41-0.06207-0.56550.286634
42-0.007407-0.06750.473181
430.0890950.81170.209644
44-0.136035-1.23930.109357
450.069120.62970.265305
460.0067770.06170.475459
47-0.040907-0.37270.355169
480.0823120.74990.227718

\begin{tabular}{lllllllll}
\hline
Autocorrelation Function \tabularnewline
Time lag k & ACF(k) & T-STAT & P-value \tabularnewline
1 & -0.30362 & -2.7661 & 0.003495 \tabularnewline
2 & -0.166695 & -1.5187 & 0.066323 \tabularnewline
3 & 0.213226 & 1.9426 & 0.027729 \tabularnewline
4 & -0.097308 & -0.8865 & 0.18895 \tabularnewline
5 & -0.169833 & -1.5472 & 0.062804 \tabularnewline
6 & -0.00789 & -0.0719 & 0.471434 \tabularnewline
7 & 0.07473 & 0.6808 & 0.248938 \tabularnewline
8 & -0.0671 & -0.6113 & 0.271333 \tabularnewline
9 & -0.036067 & -0.3286 & 0.371647 \tabularnewline
10 & 0.167058 & 1.522 & 0.065908 \tabularnewline
11 & -0.098379 & -0.8963 & 0.186348 \tabularnewline
12 & 0.090871 & 0.8279 & 0.205058 \tabularnewline
13 & -0.096166 & -0.8761 & 0.191749 \tabularnewline
14 & -0.018058 & -0.1645 & 0.434863 \tabularnewline
15 & 0.021598 & 0.1968 & 0.422244 \tabularnewline
16 & -0.067381 & -0.6139 & 0.270489 \tabularnewline
17 & -0.029817 & -0.2716 & 0.393283 \tabularnewline
18 & 0.100641 & 0.9169 & 0.180929 \tabularnewline
19 & -0.030114 & -0.2744 & 0.392246 \tabularnewline
20 & -0.101669 & -0.9263 & 0.1785 \tabularnewline
21 & 0.177758 & 1.6195 & 0.054571 \tabularnewline
22 & 0.000359 & 0.0033 & 0.498698 \tabularnewline
23 & -0.097596 & -0.8891 & 0.188249 \tabularnewline
24 & 0.119167 & 1.0857 & 0.140385 \tabularnewline
25 & 0.000913 & 0.0083 & 0.496691 \tabularnewline
26 & -0.104554 & -0.9525 & 0.171797 \tabularnewline
27 & 0.077924 & 0.7099 & 0.239872 \tabularnewline
28 & -0.074796 & -0.6814 & 0.248751 \tabularnewline
29 & 0.057525 & 0.5241 & 0.300812 \tabularnewline
30 & 0.069289 & 0.6313 & 0.264804 \tabularnewline
31 & -0.130086 & -1.1851 & 0.119673 \tabularnewline
32 & 0.044753 & 0.4077 & 0.342264 \tabularnewline
33 & 0.110596 & 1.0076 & 0.158293 \tabularnewline
34 & -0.167339 & -1.5245 & 0.065589 \tabularnewline
35 & -0.002873 & -0.0262 & 0.48959 \tabularnewline
36 & 0.11799 & 1.0749 & 0.142759 \tabularnewline
37 & -0.033821 & -0.3081 & 0.379381 \tabularnewline
38 & -0.130845 & -1.1921 & 0.118318 \tabularnewline
39 & 0.100277 & 0.9136 & 0.181795 \tabularnewline
40 & 0.029446 & 0.2683 & 0.394579 \tabularnewline
41 & -0.06207 & -0.5655 & 0.286634 \tabularnewline
42 & -0.007407 & -0.0675 & 0.473181 \tabularnewline
43 & 0.089095 & 0.8117 & 0.209644 \tabularnewline
44 & -0.136035 & -1.2393 & 0.109357 \tabularnewline
45 & 0.06912 & 0.6297 & 0.265305 \tabularnewline
46 & 0.006777 & 0.0617 & 0.475459 \tabularnewline
47 & -0.040907 & -0.3727 & 0.355169 \tabularnewline
48 & 0.082312 & 0.7499 & 0.227718 \tabularnewline
\hline
\end{tabular}
%Source: https://freestatistics.org/blog/index.php?pk=232960&T=1

[TABLE]
[ROW][C]Autocorrelation Function[/C][/ROW]
[ROW][C]Time lag k[/C][C]ACF(k)[/C][C]T-STAT[/C][C]P-value[/C][/ROW]
[ROW][C]1[/C][C]-0.30362[/C][C]-2.7661[/C][C]0.003495[/C][/ROW]
[ROW][C]2[/C][C]-0.166695[/C][C]-1.5187[/C][C]0.066323[/C][/ROW]
[ROW][C]3[/C][C]0.213226[/C][C]1.9426[/C][C]0.027729[/C][/ROW]
[ROW][C]4[/C][C]-0.097308[/C][C]-0.8865[/C][C]0.18895[/C][/ROW]
[ROW][C]5[/C][C]-0.169833[/C][C]-1.5472[/C][C]0.062804[/C][/ROW]
[ROW][C]6[/C][C]-0.00789[/C][C]-0.0719[/C][C]0.471434[/C][/ROW]
[ROW][C]7[/C][C]0.07473[/C][C]0.6808[/C][C]0.248938[/C][/ROW]
[ROW][C]8[/C][C]-0.0671[/C][C]-0.6113[/C][C]0.271333[/C][/ROW]
[ROW][C]9[/C][C]-0.036067[/C][C]-0.3286[/C][C]0.371647[/C][/ROW]
[ROW][C]10[/C][C]0.167058[/C][C]1.522[/C][C]0.065908[/C][/ROW]
[ROW][C]11[/C][C]-0.098379[/C][C]-0.8963[/C][C]0.186348[/C][/ROW]
[ROW][C]12[/C][C]0.090871[/C][C]0.8279[/C][C]0.205058[/C][/ROW]
[ROW][C]13[/C][C]-0.096166[/C][C]-0.8761[/C][C]0.191749[/C][/ROW]
[ROW][C]14[/C][C]-0.018058[/C][C]-0.1645[/C][C]0.434863[/C][/ROW]
[ROW][C]15[/C][C]0.021598[/C][C]0.1968[/C][C]0.422244[/C][/ROW]
[ROW][C]16[/C][C]-0.067381[/C][C]-0.6139[/C][C]0.270489[/C][/ROW]
[ROW][C]17[/C][C]-0.029817[/C][C]-0.2716[/C][C]0.393283[/C][/ROW]
[ROW][C]18[/C][C]0.100641[/C][C]0.9169[/C][C]0.180929[/C][/ROW]
[ROW][C]19[/C][C]-0.030114[/C][C]-0.2744[/C][C]0.392246[/C][/ROW]
[ROW][C]20[/C][C]-0.101669[/C][C]-0.9263[/C][C]0.1785[/C][/ROW]
[ROW][C]21[/C][C]0.177758[/C][C]1.6195[/C][C]0.054571[/C][/ROW]
[ROW][C]22[/C][C]0.000359[/C][C]0.0033[/C][C]0.498698[/C][/ROW]
[ROW][C]23[/C][C]-0.097596[/C][C]-0.8891[/C][C]0.188249[/C][/ROW]
[ROW][C]24[/C][C]0.119167[/C][C]1.0857[/C][C]0.140385[/C][/ROW]
[ROW][C]25[/C][C]0.000913[/C][C]0.0083[/C][C]0.496691[/C][/ROW]
[ROW][C]26[/C][C]-0.104554[/C][C]-0.9525[/C][C]0.171797[/C][/ROW]
[ROW][C]27[/C][C]0.077924[/C][C]0.7099[/C][C]0.239872[/C][/ROW]
[ROW][C]28[/C][C]-0.074796[/C][C]-0.6814[/C][C]0.248751[/C][/ROW]
[ROW][C]29[/C][C]0.057525[/C][C]0.5241[/C][C]0.300812[/C][/ROW]
[ROW][C]30[/C][C]0.069289[/C][C]0.6313[/C][C]0.264804[/C][/ROW]
[ROW][C]31[/C][C]-0.130086[/C][C]-1.1851[/C][C]0.119673[/C][/ROW]
[ROW][C]32[/C][C]0.044753[/C][C]0.4077[/C][C]0.342264[/C][/ROW]
[ROW][C]33[/C][C]0.110596[/C][C]1.0076[/C][C]0.158293[/C][/ROW]
[ROW][C]34[/C][C]-0.167339[/C][C]-1.5245[/C][C]0.065589[/C][/ROW]
[ROW][C]35[/C][C]-0.002873[/C][C]-0.0262[/C][C]0.48959[/C][/ROW]
[ROW][C]36[/C][C]0.11799[/C][C]1.0749[/C][C]0.142759[/C][/ROW]
[ROW][C]37[/C][C]-0.033821[/C][C]-0.3081[/C][C]0.379381[/C][/ROW]
[ROW][C]38[/C][C]-0.130845[/C][C]-1.1921[/C][C]0.118318[/C][/ROW]
[ROW][C]39[/C][C]0.100277[/C][C]0.9136[/C][C]0.181795[/C][/ROW]
[ROW][C]40[/C][C]0.029446[/C][C]0.2683[/C][C]0.394579[/C][/ROW]
[ROW][C]41[/C][C]-0.06207[/C][C]-0.5655[/C][C]0.286634[/C][/ROW]
[ROW][C]42[/C][C]-0.007407[/C][C]-0.0675[/C][C]0.473181[/C][/ROW]
[ROW][C]43[/C][C]0.089095[/C][C]0.8117[/C][C]0.209644[/C][/ROW]
[ROW][C]44[/C][C]-0.136035[/C][C]-1.2393[/C][C]0.109357[/C][/ROW]
[ROW][C]45[/C][C]0.06912[/C][C]0.6297[/C][C]0.265305[/C][/ROW]
[ROW][C]46[/C][C]0.006777[/C][C]0.0617[/C][C]0.475459[/C][/ROW]
[ROW][C]47[/C][C]-0.040907[/C][C]-0.3727[/C][C]0.355169[/C][/ROW]
[ROW][C]48[/C][C]0.082312[/C][C]0.7499[/C][C]0.227718[/C][/ROW]
[/TABLE]
Source: https://freestatistics.org/blog/index.php?pk=232960&T=1

Globally Unique Identifier (entire table): ba.freestatistics.org/blog/index.php?pk=232960&T=1

As an alternative you can also use a QR Code:  

The GUIDs for individual cells are displayed in the table below:

Autocorrelation Function
Time lag kACF(k)T-STATP-value
1-0.30362-2.76610.003495
2-0.166695-1.51870.066323
30.2132261.94260.027729
4-0.097308-0.88650.18895
5-0.169833-1.54720.062804
6-0.00789-0.07190.471434
70.074730.68080.248938
8-0.0671-0.61130.271333
9-0.036067-0.32860.371647
100.1670581.5220.065908
11-0.098379-0.89630.186348
120.0908710.82790.205058
13-0.096166-0.87610.191749
14-0.018058-0.16450.434863
150.0215980.19680.422244
16-0.067381-0.61390.270489
17-0.029817-0.27160.393283
180.1006410.91690.180929
19-0.030114-0.27440.392246
20-0.101669-0.92630.1785
210.1777581.61950.054571
220.0003590.00330.498698
23-0.097596-0.88910.188249
240.1191671.08570.140385
250.0009130.00830.496691
26-0.104554-0.95250.171797
270.0779240.70990.239872
28-0.074796-0.68140.248751
290.0575250.52410.300812
300.0692890.63130.264804
31-0.130086-1.18510.119673
320.0447530.40770.342264
330.1105961.00760.158293
34-0.167339-1.52450.065589
35-0.002873-0.02620.48959
360.117991.07490.142759
37-0.033821-0.30810.379381
38-0.130845-1.19210.118318
390.1002770.91360.181795
400.0294460.26830.394579
41-0.06207-0.56550.286634
42-0.007407-0.06750.473181
430.0890950.81170.209644
44-0.136035-1.23930.109357
450.069120.62970.265305
460.0067770.06170.475459
47-0.040907-0.37270.355169
480.0823120.74990.227718


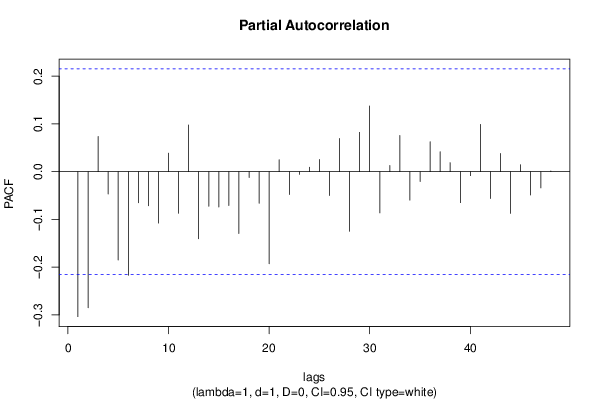
Partial Autocorrelation Function
Time lag kPACF(k)T-STATP-value
1-0.30362-2.76610.003495
2-0.285168-2.5980.005546
30.0738590.67290.251443
4-0.046905-0.42730.335125
5-0.184877-1.68430.047939
6-0.216759-1.97480.025809
7-0.065055-0.59270.277504
8-0.071398-0.65050.258594
9-0.107703-0.98120.164669
100.0387960.35350.362323
11-0.086931-0.7920.215316
120.0977090.89020.187974
13-0.140512-1.28010.102034
14-0.07247-0.66020.255465
15-0.074114-0.67520.250709
16-0.070733-0.64440.260544
17-0.129652-1.18120.120452
18-0.012406-0.1130.455141
19-0.066084-0.60210.27439
20-0.192676-1.75540.041443
210.0248180.22610.41084
22-0.047775-0.43530.332255
23-0.00563-0.05130.47961
240.0093540.08520.466145
250.0254580.23190.408581
26-0.049946-0.4550.325137
270.0696780.63480.263655
28-0.124928-1.13810.129167
290.0823580.75030.227592
300.1374881.25260.106939
31-0.086254-0.78580.217108
320.0130160.11860.452948
330.0756640.68930.24627
34-0.059602-0.5430.294293
35-0.020586-0.18750.425845
360.0625670.570.285104
370.0418480.38120.351996
380.0189090.17230.431822
39-0.064823-0.59060.278209
40-0.008368-0.07620.469709
410.0990080.9020.184832
42-0.056358-0.51340.304501
430.0382150.34820.364304
44-0.087301-0.79530.21434
450.014380.1310.448043
46-0.049031-0.44670.328131
47-0.033954-0.30930.37892
480.0012680.01160.495406

\begin{tabular}{lllllllll}
\hline
Partial Autocorrelation Function \tabularnewline
Time lag k & PACF(k) & T-STAT & P-value \tabularnewline
1 & -0.30362 & -2.7661 & 0.003495 \tabularnewline
2 & -0.285168 & -2.598 & 0.005546 \tabularnewline
3 & 0.073859 & 0.6729 & 0.251443 \tabularnewline
4 & -0.046905 & -0.4273 & 0.335125 \tabularnewline
5 & -0.184877 & -1.6843 & 0.047939 \tabularnewline
6 & -0.216759 & -1.9748 & 0.025809 \tabularnewline
7 & -0.065055 & -0.5927 & 0.277504 \tabularnewline
8 & -0.071398 & -0.6505 & 0.258594 \tabularnewline
9 & -0.107703 & -0.9812 & 0.164669 \tabularnewline
10 & 0.038796 & 0.3535 & 0.362323 \tabularnewline
11 & -0.086931 & -0.792 & 0.215316 \tabularnewline
12 & 0.097709 & 0.8902 & 0.187974 \tabularnewline
13 & -0.140512 & -1.2801 & 0.102034 \tabularnewline
14 & -0.07247 & -0.6602 & 0.255465 \tabularnewline
15 & -0.074114 & -0.6752 & 0.250709 \tabularnewline
16 & -0.070733 & -0.6444 & 0.260544 \tabularnewline
17 & -0.129652 & -1.1812 & 0.120452 \tabularnewline
18 & -0.012406 & -0.113 & 0.455141 \tabularnewline
19 & -0.066084 & -0.6021 & 0.27439 \tabularnewline
20 & -0.192676 & -1.7554 & 0.041443 \tabularnewline
21 & 0.024818 & 0.2261 & 0.41084 \tabularnewline
22 & -0.047775 & -0.4353 & 0.332255 \tabularnewline
23 & -0.00563 & -0.0513 & 0.47961 \tabularnewline
24 & 0.009354 & 0.0852 & 0.466145 \tabularnewline
25 & 0.025458 & 0.2319 & 0.408581 \tabularnewline
26 & -0.049946 & -0.455 & 0.325137 \tabularnewline
27 & 0.069678 & 0.6348 & 0.263655 \tabularnewline
28 & -0.124928 & -1.1381 & 0.129167 \tabularnewline
29 & 0.082358 & 0.7503 & 0.227592 \tabularnewline
30 & 0.137488 & 1.2526 & 0.106939 \tabularnewline
31 & -0.086254 & -0.7858 & 0.217108 \tabularnewline
32 & 0.013016 & 0.1186 & 0.452948 \tabularnewline
33 & 0.075664 & 0.6893 & 0.24627 \tabularnewline
34 & -0.059602 & -0.543 & 0.294293 \tabularnewline
35 & -0.020586 & -0.1875 & 0.425845 \tabularnewline
36 & 0.062567 & 0.57 & 0.285104 \tabularnewline
37 & 0.041848 & 0.3812 & 0.351996 \tabularnewline
38 & 0.018909 & 0.1723 & 0.431822 \tabularnewline
39 & -0.064823 & -0.5906 & 0.278209 \tabularnewline
40 & -0.008368 & -0.0762 & 0.469709 \tabularnewline
41 & 0.099008 & 0.902 & 0.184832 \tabularnewline
42 & -0.056358 & -0.5134 & 0.304501 \tabularnewline
43 & 0.038215 & 0.3482 & 0.364304 \tabularnewline
44 & -0.087301 & -0.7953 & 0.21434 \tabularnewline
45 & 0.01438 & 0.131 & 0.448043 \tabularnewline
46 & -0.049031 & -0.4467 & 0.328131 \tabularnewline
47 & -0.033954 & -0.3093 & 0.37892 \tabularnewline
48 & 0.001268 & 0.0116 & 0.495406 \tabularnewline
\hline
\end{tabular}
%Source: https://freestatistics.org/blog/index.php?pk=232960&T=2

[TABLE]
[ROW][C]Partial Autocorrelation Function[/C][/ROW]
[ROW][C]Time lag k[/C][C]PACF(k)[/C][C]T-STAT[/C][C]P-value[/C][/ROW]
[ROW][C]1[/C][C]-0.30362[/C][C]-2.7661[/C][C]0.003495[/C][/ROW]
[ROW][C]2[/C][C]-0.285168[/C][C]-2.598[/C][C]0.005546[/C][/ROW]
[ROW][C]3[/C][C]0.073859[/C][C]0.6729[/C][C]0.251443[/C][/ROW]
[ROW][C]4[/C][C]-0.046905[/C][C]-0.4273[/C][C]0.335125[/C][/ROW]
[ROW][C]5[/C][C]-0.184877[/C][C]-1.6843[/C][C]0.047939[/C][/ROW]
[ROW][C]6[/C][C]-0.216759[/C][C]-1.9748[/C][C]0.025809[/C][/ROW]
[ROW][C]7[/C][C]-0.065055[/C][C]-0.5927[/C][C]0.277504[/C][/ROW]
[ROW][C]8[/C][C]-0.071398[/C][C]-0.6505[/C][C]0.258594[/C][/ROW]
[ROW][C]9[/C][C]-0.107703[/C][C]-0.9812[/C][C]0.164669[/C][/ROW]
[ROW][C]10[/C][C]0.038796[/C][C]0.3535[/C][C]0.362323[/C][/ROW]
[ROW][C]11[/C][C]-0.086931[/C][C]-0.792[/C][C]0.215316[/C][/ROW]
[ROW][C]12[/C][C]0.097709[/C][C]0.8902[/C][C]0.187974[/C][/ROW]
[ROW][C]13[/C][C]-0.140512[/C][C]-1.2801[/C][C]0.102034[/C][/ROW]
[ROW][C]14[/C][C]-0.07247[/C][C]-0.6602[/C][C]0.255465[/C][/ROW]
[ROW][C]15[/C][C]-0.074114[/C][C]-0.6752[/C][C]0.250709[/C][/ROW]
[ROW][C]16[/C][C]-0.070733[/C][C]-0.6444[/C][C]0.260544[/C][/ROW]
[ROW][C]17[/C][C]-0.129652[/C][C]-1.1812[/C][C]0.120452[/C][/ROW]
[ROW][C]18[/C][C]-0.012406[/C][C]-0.113[/C][C]0.455141[/C][/ROW]
[ROW][C]19[/C][C]-0.066084[/C][C]-0.6021[/C][C]0.27439[/C][/ROW]
[ROW][C]20[/C][C]-0.192676[/C][C]-1.7554[/C][C]0.041443[/C][/ROW]
[ROW][C]21[/C][C]0.024818[/C][C]0.2261[/C][C]0.41084[/C][/ROW]
[ROW][C]22[/C][C]-0.047775[/C][C]-0.4353[/C][C]0.332255[/C][/ROW]
[ROW][C]23[/C][C]-0.00563[/C][C]-0.0513[/C][C]0.47961[/C][/ROW]
[ROW][C]24[/C][C]0.009354[/C][C]0.0852[/C][C]0.466145[/C][/ROW]
[ROW][C]25[/C][C]0.025458[/C][C]0.2319[/C][C]0.408581[/C][/ROW]
[ROW][C]26[/C][C]-0.049946[/C][C]-0.455[/C][C]0.325137[/C][/ROW]
[ROW][C]27[/C][C]0.069678[/C][C]0.6348[/C][C]0.263655[/C][/ROW]
[ROW][C]28[/C][C]-0.124928[/C][C]-1.1381[/C][C]0.129167[/C][/ROW]
[ROW][C]29[/C][C]0.082358[/C][C]0.7503[/C][C]0.227592[/C][/ROW]
[ROW][C]30[/C][C]0.137488[/C][C]1.2526[/C][C]0.106939[/C][/ROW]
[ROW][C]31[/C][C]-0.086254[/C][C]-0.7858[/C][C]0.217108[/C][/ROW]
[ROW][C]32[/C][C]0.013016[/C][C]0.1186[/C][C]0.452948[/C][/ROW]
[ROW][C]33[/C][C]0.075664[/C][C]0.6893[/C][C]0.24627[/C][/ROW]
[ROW][C]34[/C][C]-0.059602[/C][C]-0.543[/C][C]0.294293[/C][/ROW]
[ROW][C]35[/C][C]-0.020586[/C][C]-0.1875[/C][C]0.425845[/C][/ROW]
[ROW][C]36[/C][C]0.062567[/C][C]0.57[/C][C]0.285104[/C][/ROW]
[ROW][C]37[/C][C]0.041848[/C][C]0.3812[/C][C]0.351996[/C][/ROW]
[ROW][C]38[/C][C]0.018909[/C][C]0.1723[/C][C]0.431822[/C][/ROW]
[ROW][C]39[/C][C]-0.064823[/C][C]-0.5906[/C][C]0.278209[/C][/ROW]
[ROW][C]40[/C][C]-0.008368[/C][C]-0.0762[/C][C]0.469709[/C][/ROW]
[ROW][C]41[/C][C]0.099008[/C][C]0.902[/C][C]0.184832[/C][/ROW]
[ROW][C]42[/C][C]-0.056358[/C][C]-0.5134[/C][C]0.304501[/C][/ROW]
[ROW][C]43[/C][C]0.038215[/C][C]0.3482[/C][C]0.364304[/C][/ROW]
[ROW][C]44[/C][C]-0.087301[/C][C]-0.7953[/C][C]0.21434[/C][/ROW]
[ROW][C]45[/C][C]0.01438[/C][C]0.131[/C][C]0.448043[/C][/ROW]
[ROW][C]46[/C][C]-0.049031[/C][C]-0.4467[/C][C]0.328131[/C][/ROW]
[ROW][C]47[/C][C]-0.033954[/C][C]-0.3093[/C][C]0.37892[/C][/ROW]
[ROW][C]48[/C][C]0.001268[/C][C]0.0116[/C][C]0.495406[/C][/ROW]
[/TABLE]
Source: https://freestatistics.org/blog/index.php?pk=232960&T=2

Globally Unique Identifier (entire table): ba.freestatistics.org/blog/index.php?pk=232960&T=2

As an alternative you can also use a QR Code:  

The GUIDs for individual cells are displayed in the table below:

Partial Autocorrelation Function
Time lag kPACF(k)T-STATP-value
1-0.30362-2.76610.003495
2-0.285168-2.5980.005546
30.0738590.67290.251443
4-0.046905-0.42730.335125
5-0.184877-1.68430.047939
6-0.216759-1.97480.025809
7-0.065055-0.59270.277504
8-0.071398-0.65050.258594
9-0.107703-0.98120.164669
100.0387960.35350.362323
11-0.086931-0.7920.215316
120.0977090.89020.187974
13-0.140512-1.28010.102034
14-0.07247-0.66020.255465
15-0.074114-0.67520.250709
16-0.070733-0.64440.260544
17-0.129652-1.18120.120452
18-0.012406-0.1130.455141
19-0.066084-0.60210.27439
20-0.192676-1.75540.041443
210.0248180.22610.41084
22-0.047775-0.43530.332255
23-0.00563-0.05130.47961
240.0093540.08520.466145
250.0254580.23190.408581
26-0.049946-0.4550.325137
270.0696780.63480.263655
28-0.124928-1.13810.129167
290.0823580.75030.227592
300.1374881.25260.106939
31-0.086254-0.78580.217108
320.0130160.11860.452948
330.0756640.68930.24627
34-0.059602-0.5430.294293
35-0.020586-0.18750.425845
360.0625670.570.285104
370.0418480.38120.351996
380.0189090.17230.431822
39-0.064823-0.59060.278209
40-0.008368-0.07620.469709
410.0990080.9020.184832
42-0.056358-0.51340.304501
430.0382150.34820.364304
44-0.087301-0.79530.21434
450.014380.1310.448043
46-0.049031-0.44670.328131
47-0.033954-0.30930.37892
480.0012680.01160.495406


Parameters (Session):
par1 = 48 ; par2 = 1 ; par3 = 1 ; par4 = 0 ; par5 = 12 ; par6 = White Noise ; par7 = 0.95 ;
Parameters (R input):
par1 = 48 ; par2 = 1 ; par3 = 1 ; par4 = 0 ; par5 = 12 ; par6 = White Noise ; par7 = 0.95 ; par8 = ;
R code (references can be found in the software module):
par8 <- ''
par7 <- '0.95'
par6 <- 'White Noise'
par5 <- '12'
par4 <- '0'
par3 <- '0'
par2 <- '1'
par1 <- '48'
if (par1 == 'Default') {
par1 = 10*log10(length(x))
} else {
par1 <- as.numeric(par1)
}
par2 <- as.numeric(par2)
par3 <- as.numeric(par3)
par4 <- as.numeric(par4)
par5 <- as.numeric(par5)
if (par6 == 'White Noise') par6 <- 'white' else par6 <- 'ma'
par7 <- as.numeric(par7)
if (par8 != '') par8 <- as.numeric(par8)
ox <- x
if (par8 == '') {
if (par2 == 0) {
x <- log(x)
} else {
x <- (x ^ par2 - 1) / par2
}
} else {
x <- log(x,base=par8)
}
if (par3 > 0) x <- diff(x,lag=1,difference=par3)
if (par4 > 0) x <- diff(x,lag=par5,difference=par4)
bitmap(file='picts.png')
op <- par(mfrow=c(2,1))
plot(ox,type='l',main='Original Time Series',xlab='time',ylab='value')
if (par8=='') {
mytitle <- paste('Working Time Series (lambda=',par2,', d=',par3,', D=',par4,')',sep='')
mysub <- paste('(lambda=',par2,', d=',par3,', D=',par4,', CI=', par7, ', CI type=',par6,')',sep='')
} else {
mytitle <- paste('Working Time Series (base=',par8,', d=',par3,', D=',par4,')',sep='')
mysub <- paste('(base=',par8,', d=',par3,', D=',par4,', CI=', par7, ', CI type=',par6,')',sep='')
}
plot(x,type='l', main=mytitle,xlab='time',ylab='value')
par(op)
dev.off()
bitmap(file='pic1.png')
racf <- acf(x, par1, main='Autocorrelation', xlab='time lag', ylab='ACF', ci.type=par6, ci=par7, sub=mysub)
dev.off()
bitmap(file='pic2.png')
rpacf <- pacf(x,par1,main='Partial Autocorrelation',xlab='lags',ylab='PACF',sub=mysub)
dev.off()
(myacf <- c(racf$acf))
(mypacf <- c(rpacf$acf))
lengthx <- length(x)
sqrtn <- sqrt(lengthx)
load(file='createtable')
a<-table.start()
a<-table.row.start(a)
a<-table.element(a,'Autocorrelation Function',4,TRUE)
a<-table.row.end(a)
a<-table.row.start(a)
a<-table.element(a,'Time lag k',header=TRUE)
a<-table.element(a,hyperlink('basics.htm','ACF(k)','click here for more information about the Autocorrelation Function'),header=TRUE)
a<-table.element(a,'T-STAT',header=TRUE)
a<-table.element(a,'P-value',header=TRUE)
a<-table.row.end(a)
for (i in 2:(par1+1)) {
a<-table.row.start(a)
a<-table.element(a,i-1,header=TRUE)
a<-table.element(a,round(myacf[i],6))
mytstat <- myacf[i]*sqrtn
a<-table.element(a,round(mytstat,4))
a<-table.element(a,round(1-pt(abs(mytstat),lengthx),6))
a<-table.row.end(a)
}
a<-table.end(a)
table.save(a,file='mytable.tab')
a<-table.start()
a<-table.row.start(a)
a<-table.element(a,'Partial Autocorrelation Function',4,TRUE)
a<-table.row.end(a)
a<-table.row.start(a)
a<-table.element(a,'Time lag k',header=TRUE)
a<-table.element(a,hyperlink('basics.htm','PACF(k)','click here for more information about the Partial Autocorrelation Function'),header=TRUE)
a<-table.element(a,'T-STAT',header=TRUE)
a<-table.element(a,'P-value',header=TRUE)
a<-table.row.end(a)
for (i in 1:par1) {
a<-table.row.start(a)
a<-table.element(a,i,header=TRUE)
a<-table.element(a,round(mypacf[i],6))
mytstat <- mypacf[i]*sqrtn
a<-table.element(a,round(mytstat,4))
a<-table.element(a,round(1-pt(abs(mytstat),lengthx),6))
a<-table.row.end(a)
}
a<-table.end(a)
table.save(a,file='mytable1.tab')