Free Statistics

of Irreproducible Research!

Author's title

Author*Unverified author*
R Software Modulerwasp_exponentialsmoothing.wasp
Title produced by softwareExponential Smoothing
Date of computationTue, 30 Dec 2014 16:17:48 +0000
Cite this page as followsStatistical Computations at FreeStatistics.org, Office for Research Development and Education, URL https://freestatistics.org/blog/index.php?v=date/2014/Dec/30/t14199564062s1rz71pgc3x2y9.htm/, Retrieved Sun, 19 May 2024 13:33:02 +0000
Statistical Computations at FreeStatistics.org, Office for Research Development and Education, URL https://freestatistics.org/blog/index.php?pk=271755, Retrieved Sun, 19 May 2024 13:33:02 +0000
QR Codes:

Original text written by user:
IsPrivate?No (this computation is public)
User-defined keywords
Estimated Impact111
Family? (F = Feedback message, R = changed R code, M = changed R Module, P = changed Parameters, D = changed Data)
-       [Exponential Smoothing] [Exponential smoot...] [2014-12-30 16:17:48] [be7d2a6a6c016378f31f309d9b06695b] [Current]
Feedback Forum

Post a new message
Dataseries X:
71
77
76
69
74
101
105
73
68
65
70
65
80
92
93
90
96
125
134
100
97
97
101
90
108
113
112
103
103
125
128
91
84
83
83
69
77
83
78
70
75
101
117
80
87
81
78
73
93
105
102
97
100
127
138
107
107
106
109
107
129
138
137
134
134
166
180
131
135
127
121
116


Summary of computational transaction
Raw Inputview raw input (R code)
Raw Outputview raw output of R engine
Computing time1 seconds
R Server'Sir Maurice George Kendall' @ kendall.wessa.net

\begin{tabular}{lllllllll}
\hline
Summary of computational transaction \tabularnewline
Raw Input & view raw input (R code)  \tabularnewline
Raw Output & view raw output of R engine  \tabularnewline
Computing time & 1 seconds \tabularnewline
R Server & 'Sir Maurice George Kendall' @ kendall.wessa.net \tabularnewline
\hline
\end{tabular}
%Source: https://freestatistics.org/blog/index.php?pk=271755&T=0

[TABLE]
[ROW][C]Summary of computational transaction[/C][/ROW]
[ROW][C]Raw Input[/C][C]view raw input (R code) [/C][/ROW]
[ROW][C]Raw Output[/C][C]view raw output of R engine [/C][/ROW]
[ROW][C]Computing time[/C][C]1 seconds[/C][/ROW]
[ROW][C]R Server[/C][C]'Sir Maurice George Kendall' @ kendall.wessa.net[/C][/ROW]
[/TABLE]
Source: https://freestatistics.org/blog/index.php?pk=271755&T=0

Globally Unique Identifier (entire table): ba.freestatistics.org/blog/index.php?pk=271755&T=0

As an alternative you can also use a QR Code:  

The GUIDs for individual cells are displayed in the table below:

Summary of computational transaction
Raw Inputview raw input (R code)
Raw Outputview raw output of R engine
Computing time1 seconds
R Server'Sir Maurice George Kendall' @ kendall.wessa.net


Estimated Parameters of Exponential Smoothing
ParameterValue
alpha0.859521551550565
beta0.385338789794025
gamma1

\begin{tabular}{lllllllll}
\hline
Estimated Parameters of Exponential Smoothing \tabularnewline
Parameter & Value \tabularnewline
alpha & 0.859521551550565 \tabularnewline
beta & 0.385338789794025 \tabularnewline
gamma & 1 \tabularnewline
\hline
\end{tabular}
%Source: https://freestatistics.org/blog/index.php?pk=271755&T=1

[TABLE]
[ROW][C]Estimated Parameters of Exponential Smoothing[/C][/ROW]
[ROW][C]Parameter[/C][C]Value[/C][/ROW]
[ROW][C]alpha[/C][C]0.859521551550565[/C][/ROW]
[ROW][C]beta[/C][C]0.385338789794025[/C][/ROW]
[ROW][C]gamma[/C][C]1[/C][/ROW]
[/TABLE]
Source: https://freestatistics.org/blog/index.php?pk=271755&T=1

Globally Unique Identifier (entire table): ba.freestatistics.org/blog/index.php?pk=271755&T=1

As an alternative you can also use a QR Code:  

The GUIDs for individual cells are displayed in the table below:

Estimated Parameters of Exponential Smoothing
ParameterValue
alpha0.859521551550565
beta0.385338789794025
gamma1


Interpolation Forecasts of Exponential Smoothing
tObservedFittedResiduals
138070.42586982832889.57413017167121
149293.787632560734-1.78763256073401
159395.9082956189997-2.90829561899966
169091.7825941560137-1.78259415601373
179697.0145546439613-1.01455464396126
18125126.083440474766-1.08344047476608
19134139.132775324408-5.13277532440839
2010093.8885932141696.11140678583104
219793.95601653568413.04398346431591
229794.40692989658932.59307010341065
23101106.827871772485-5.82787177248515
249095.2017027918287-5.20170279182871
25108111.998898019157-3.99889801915735
26113119.193316590043-6.19331659004273
27112109.9550084871032.04499151289734
28103104.078687372907-1.07868737290671
29103105.481457806645-2.48145780664541
30125128.231350806234-3.23135080623362
31128130.525175129807-2.52517512980674
329185.55522285459765.44477714540243
338480.49188826471423.50811173528584
348377.60788774449225.39211225550781
358386.8620367405279-3.86203674052786
366975.7738218017721-6.77382180177213
377782.7892869637065-5.78928696370654
388380.07040404385222.92959595614779
397877.89389782204550.106102177954511
407069.37338509056740.626614909432632
417568.69806319681896.30193680318111
4210192.04867492162428.95132507837579
43117108.3655363043028.63446369569802
448084.1033155132385-4.1033155132385
458774.433245667622912.5667543323771
468185.0644105968766-4.06441059687664
477887.3271078614455-9.32710786144553
487372.02732630526130.972673694738745
499390.52339333364292.4766066663571
50105105.193172855265-0.193172855265288
51102105.891456189213-3.8914561892128
529797.1270233587601-0.127023358760084
53100102.379673839913-2.37967383991293
54127127.531254076946-0.531254076945856
55138136.3810489230991.61895107690077
5610795.432261247953211.5677387520468
57107102.2721936977924.72780630220801
58106102.0384916997523.96150830024837
59109113.278640656972-4.27864065697179
60107105.0233747867171.97662521328287
61129137.479254468018-8.47925446801787
62138148.052431656887-10.0524316568872
63137137.622854290845-0.622854290845396
64134129.8150478027414.18495219725858
65134141.096646976452-7.09664697645226
66166171.401973756049-5.40197375604933
67180176.9766490538173.02335094618329
68131124.6283119153266.37168808467382
69135121.35581484136613.6441851586335
70127126.3745729256450.625427074355116
71121132.519873858545-11.5198738585446
72116114.618507468251.38149253174996

\begin{tabular}{lllllllll}
\hline
Interpolation Forecasts of Exponential Smoothing \tabularnewline
t & Observed & Fitted & Residuals \tabularnewline
13 & 80 & 70.4258698283288 & 9.57413017167121 \tabularnewline
14 & 92 & 93.787632560734 & -1.78763256073401 \tabularnewline
15 & 93 & 95.9082956189997 & -2.90829561899966 \tabularnewline
16 & 90 & 91.7825941560137 & -1.78259415601373 \tabularnewline
17 & 96 & 97.0145546439613 & -1.01455464396126 \tabularnewline
18 & 125 & 126.083440474766 & -1.08344047476608 \tabularnewline
19 & 134 & 139.132775324408 & -5.13277532440839 \tabularnewline
20 & 100 & 93.888593214169 & 6.11140678583104 \tabularnewline
21 & 97 & 93.9560165356841 & 3.04398346431591 \tabularnewline
22 & 97 & 94.4069298965893 & 2.59307010341065 \tabularnewline
23 & 101 & 106.827871772485 & -5.82787177248515 \tabularnewline
24 & 90 & 95.2017027918287 & -5.20170279182871 \tabularnewline
25 & 108 & 111.998898019157 & -3.99889801915735 \tabularnewline
26 & 113 & 119.193316590043 & -6.19331659004273 \tabularnewline
27 & 112 & 109.955008487103 & 2.04499151289734 \tabularnewline
28 & 103 & 104.078687372907 & -1.07868737290671 \tabularnewline
29 & 103 & 105.481457806645 & -2.48145780664541 \tabularnewline
30 & 125 & 128.231350806234 & -3.23135080623362 \tabularnewline
31 & 128 & 130.525175129807 & -2.52517512980674 \tabularnewline
32 & 91 & 85.5552228545976 & 5.44477714540243 \tabularnewline
33 & 84 & 80.4918882647142 & 3.50811173528584 \tabularnewline
34 & 83 & 77.6078877444922 & 5.39211225550781 \tabularnewline
35 & 83 & 86.8620367405279 & -3.86203674052786 \tabularnewline
36 & 69 & 75.7738218017721 & -6.77382180177213 \tabularnewline
37 & 77 & 82.7892869637065 & -5.78928696370654 \tabularnewline
38 & 83 & 80.0704040438522 & 2.92959595614779 \tabularnewline
39 & 78 & 77.8938978220455 & 0.106102177954511 \tabularnewline
40 & 70 & 69.3733850905674 & 0.626614909432632 \tabularnewline
41 & 75 & 68.6980631968189 & 6.30193680318111 \tabularnewline
42 & 101 & 92.0486749216242 & 8.95132507837579 \tabularnewline
43 & 117 & 108.365536304302 & 8.63446369569802 \tabularnewline
44 & 80 & 84.1033155132385 & -4.1033155132385 \tabularnewline
45 & 87 & 74.4332456676229 & 12.5667543323771 \tabularnewline
46 & 81 & 85.0644105968766 & -4.06441059687664 \tabularnewline
47 & 78 & 87.3271078614455 & -9.32710786144553 \tabularnewline
48 & 73 & 72.0273263052613 & 0.972673694738745 \tabularnewline
49 & 93 & 90.5233933336429 & 2.4766066663571 \tabularnewline
50 & 105 & 105.193172855265 & -0.193172855265288 \tabularnewline
51 & 102 & 105.891456189213 & -3.8914561892128 \tabularnewline
52 & 97 & 97.1270233587601 & -0.127023358760084 \tabularnewline
53 & 100 & 102.379673839913 & -2.37967383991293 \tabularnewline
54 & 127 & 127.531254076946 & -0.531254076945856 \tabularnewline
55 & 138 & 136.381048923099 & 1.61895107690077 \tabularnewline
56 & 107 & 95.4322612479532 & 11.5677387520468 \tabularnewline
57 & 107 & 102.272193697792 & 4.72780630220801 \tabularnewline
58 & 106 & 102.038491699752 & 3.96150830024837 \tabularnewline
59 & 109 & 113.278640656972 & -4.27864065697179 \tabularnewline
60 & 107 & 105.023374786717 & 1.97662521328287 \tabularnewline
61 & 129 & 137.479254468018 & -8.47925446801787 \tabularnewline
62 & 138 & 148.052431656887 & -10.0524316568872 \tabularnewline
63 & 137 & 137.622854290845 & -0.622854290845396 \tabularnewline
64 & 134 & 129.815047802741 & 4.18495219725858 \tabularnewline
65 & 134 & 141.096646976452 & -7.09664697645226 \tabularnewline
66 & 166 & 171.401973756049 & -5.40197375604933 \tabularnewline
67 & 180 & 176.976649053817 & 3.02335094618329 \tabularnewline
68 & 131 & 124.628311915326 & 6.37168808467382 \tabularnewline
69 & 135 & 121.355814841366 & 13.6441851586335 \tabularnewline
70 & 127 & 126.374572925645 & 0.625427074355116 \tabularnewline
71 & 121 & 132.519873858545 & -11.5198738585446 \tabularnewline
72 & 116 & 114.61850746825 & 1.38149253174996 \tabularnewline
\hline
\end{tabular}
%Source: https://freestatistics.org/blog/index.php?pk=271755&T=2

[TABLE]
[ROW][C]Interpolation Forecasts of Exponential Smoothing[/C][/ROW]
[ROW][C]t[/C][C]Observed[/C][C]Fitted[/C][C]Residuals[/C][/ROW]
[ROW][C]13[/C][C]80[/C][C]70.4258698283288[/C][C]9.57413017167121[/C][/ROW]
[ROW][C]14[/C][C]92[/C][C]93.787632560734[/C][C]-1.78763256073401[/C][/ROW]
[ROW][C]15[/C][C]93[/C][C]95.9082956189997[/C][C]-2.90829561899966[/C][/ROW]
[ROW][C]16[/C][C]90[/C][C]91.7825941560137[/C][C]-1.78259415601373[/C][/ROW]
[ROW][C]17[/C][C]96[/C][C]97.0145546439613[/C][C]-1.01455464396126[/C][/ROW]
[ROW][C]18[/C][C]125[/C][C]126.083440474766[/C][C]-1.08344047476608[/C][/ROW]
[ROW][C]19[/C][C]134[/C][C]139.132775324408[/C][C]-5.13277532440839[/C][/ROW]
[ROW][C]20[/C][C]100[/C][C]93.888593214169[/C][C]6.11140678583104[/C][/ROW]
[ROW][C]21[/C][C]97[/C][C]93.9560165356841[/C][C]3.04398346431591[/C][/ROW]
[ROW][C]22[/C][C]97[/C][C]94.4069298965893[/C][C]2.59307010341065[/C][/ROW]
[ROW][C]23[/C][C]101[/C][C]106.827871772485[/C][C]-5.82787177248515[/C][/ROW]
[ROW][C]24[/C][C]90[/C][C]95.2017027918287[/C][C]-5.20170279182871[/C][/ROW]
[ROW][C]25[/C][C]108[/C][C]111.998898019157[/C][C]-3.99889801915735[/C][/ROW]
[ROW][C]26[/C][C]113[/C][C]119.193316590043[/C][C]-6.19331659004273[/C][/ROW]
[ROW][C]27[/C][C]112[/C][C]109.955008487103[/C][C]2.04499151289734[/C][/ROW]
[ROW][C]28[/C][C]103[/C][C]104.078687372907[/C][C]-1.07868737290671[/C][/ROW]
[ROW][C]29[/C][C]103[/C][C]105.481457806645[/C][C]-2.48145780664541[/C][/ROW]
[ROW][C]30[/C][C]125[/C][C]128.231350806234[/C][C]-3.23135080623362[/C][/ROW]
[ROW][C]31[/C][C]128[/C][C]130.525175129807[/C][C]-2.52517512980674[/C][/ROW]
[ROW][C]32[/C][C]91[/C][C]85.5552228545976[/C][C]5.44477714540243[/C][/ROW]
[ROW][C]33[/C][C]84[/C][C]80.4918882647142[/C][C]3.50811173528584[/C][/ROW]
[ROW][C]34[/C][C]83[/C][C]77.6078877444922[/C][C]5.39211225550781[/C][/ROW]
[ROW][C]35[/C][C]83[/C][C]86.8620367405279[/C][C]-3.86203674052786[/C][/ROW]
[ROW][C]36[/C][C]69[/C][C]75.7738218017721[/C][C]-6.77382180177213[/C][/ROW]
[ROW][C]37[/C][C]77[/C][C]82.7892869637065[/C][C]-5.78928696370654[/C][/ROW]
[ROW][C]38[/C][C]83[/C][C]80.0704040438522[/C][C]2.92959595614779[/C][/ROW]
[ROW][C]39[/C][C]78[/C][C]77.8938978220455[/C][C]0.106102177954511[/C][/ROW]
[ROW][C]40[/C][C]70[/C][C]69.3733850905674[/C][C]0.626614909432632[/C][/ROW]
[ROW][C]41[/C][C]75[/C][C]68.6980631968189[/C][C]6.30193680318111[/C][/ROW]
[ROW][C]42[/C][C]101[/C][C]92.0486749216242[/C][C]8.95132507837579[/C][/ROW]
[ROW][C]43[/C][C]117[/C][C]108.365536304302[/C][C]8.63446369569802[/C][/ROW]
[ROW][C]44[/C][C]80[/C][C]84.1033155132385[/C][C]-4.1033155132385[/C][/ROW]
[ROW][C]45[/C][C]87[/C][C]74.4332456676229[/C][C]12.5667543323771[/C][/ROW]
[ROW][C]46[/C][C]81[/C][C]85.0644105968766[/C][C]-4.06441059687664[/C][/ROW]
[ROW][C]47[/C][C]78[/C][C]87.3271078614455[/C][C]-9.32710786144553[/C][/ROW]
[ROW][C]48[/C][C]73[/C][C]72.0273263052613[/C][C]0.972673694738745[/C][/ROW]
[ROW][C]49[/C][C]93[/C][C]90.5233933336429[/C][C]2.4766066663571[/C][/ROW]
[ROW][C]50[/C][C]105[/C][C]105.193172855265[/C][C]-0.193172855265288[/C][/ROW]
[ROW][C]51[/C][C]102[/C][C]105.891456189213[/C][C]-3.8914561892128[/C][/ROW]
[ROW][C]52[/C][C]97[/C][C]97.1270233587601[/C][C]-0.127023358760084[/C][/ROW]
[ROW][C]53[/C][C]100[/C][C]102.379673839913[/C][C]-2.37967383991293[/C][/ROW]
[ROW][C]54[/C][C]127[/C][C]127.531254076946[/C][C]-0.531254076945856[/C][/ROW]
[ROW][C]55[/C][C]138[/C][C]136.381048923099[/C][C]1.61895107690077[/C][/ROW]
[ROW][C]56[/C][C]107[/C][C]95.4322612479532[/C][C]11.5677387520468[/C][/ROW]
[ROW][C]57[/C][C]107[/C][C]102.272193697792[/C][C]4.72780630220801[/C][/ROW]
[ROW][C]58[/C][C]106[/C][C]102.038491699752[/C][C]3.96150830024837[/C][/ROW]
[ROW][C]59[/C][C]109[/C][C]113.278640656972[/C][C]-4.27864065697179[/C][/ROW]
[ROW][C]60[/C][C]107[/C][C]105.023374786717[/C][C]1.97662521328287[/C][/ROW]
[ROW][C]61[/C][C]129[/C][C]137.479254468018[/C][C]-8.47925446801787[/C][/ROW]
[ROW][C]62[/C][C]138[/C][C]148.052431656887[/C][C]-10.0524316568872[/C][/ROW]
[ROW][C]63[/C][C]137[/C][C]137.622854290845[/C][C]-0.622854290845396[/C][/ROW]
[ROW][C]64[/C][C]134[/C][C]129.815047802741[/C][C]4.18495219725858[/C][/ROW]
[ROW][C]65[/C][C]134[/C][C]141.096646976452[/C][C]-7.09664697645226[/C][/ROW]
[ROW][C]66[/C][C]166[/C][C]171.401973756049[/C][C]-5.40197375604933[/C][/ROW]
[ROW][C]67[/C][C]180[/C][C]176.976649053817[/C][C]3.02335094618329[/C][/ROW]
[ROW][C]68[/C][C]131[/C][C]124.628311915326[/C][C]6.37168808467382[/C][/ROW]
[ROW][C]69[/C][C]135[/C][C]121.355814841366[/C][C]13.6441851586335[/C][/ROW]
[ROW][C]70[/C][C]127[/C][C]126.374572925645[/C][C]0.625427074355116[/C][/ROW]
[ROW][C]71[/C][C]121[/C][C]132.519873858545[/C][C]-11.5198738585446[/C][/ROW]
[ROW][C]72[/C][C]116[/C][C]114.61850746825[/C][C]1.38149253174996[/C][/ROW]
[/TABLE]
Source: https://freestatistics.org/blog/index.php?pk=271755&T=2

Globally Unique Identifier (entire table): ba.freestatistics.org/blog/index.php?pk=271755&T=2

As an alternative you can also use a QR Code:  

The GUIDs for individual cells are displayed in the table below:

Interpolation Forecasts of Exponential Smoothing
tObservedFittedResiduals
138070.42586982832889.57413017167121
149293.787632560734-1.78763256073401
159395.9082956189997-2.90829561899966
169091.7825941560137-1.78259415601373
179697.0145546439613-1.01455464396126
18125126.083440474766-1.08344047476608
19134139.132775324408-5.13277532440839
2010093.8885932141696.11140678583104
219793.95601653568413.04398346431591
229794.40692989658932.59307010341065
23101106.827871772485-5.82787177248515
249095.2017027918287-5.20170279182871
25108111.998898019157-3.99889801915735
26113119.193316590043-6.19331659004273
27112109.9550084871032.04499151289734
28103104.078687372907-1.07868737290671
29103105.481457806645-2.48145780664541
30125128.231350806234-3.23135080623362
31128130.525175129807-2.52517512980674
329185.55522285459765.44477714540243
338480.49188826471423.50811173528584
348377.60788774449225.39211225550781
358386.8620367405279-3.86203674052786
366975.7738218017721-6.77382180177213
377782.7892869637065-5.78928696370654
388380.07040404385222.92959595614779
397877.89389782204550.106102177954511
407069.37338509056740.626614909432632
417568.69806319681896.30193680318111
4210192.04867492162428.95132507837579
43117108.3655363043028.63446369569802
448084.1033155132385-4.1033155132385
458774.433245667622912.5667543323771
468185.0644105968766-4.06441059687664
477887.3271078614455-9.32710786144553
487372.02732630526130.972673694738745
499390.52339333364292.4766066663571
50105105.193172855265-0.193172855265288
51102105.891456189213-3.8914561892128
529797.1270233587601-0.127023358760084
53100102.379673839913-2.37967383991293
54127127.531254076946-0.531254076945856
55138136.3810489230991.61895107690077
5610795.432261247953211.5677387520468
57107102.2721936977924.72780630220801
58106102.0384916997523.96150830024837
59109113.278640656972-4.27864065697179
60107105.0233747867171.97662521328287
61129137.479254468018-8.47925446801787
62138148.052431656887-10.0524316568872
63137137.622854290845-0.622854290845396
64134129.8150478027414.18495219725858
65134141.096646976452-7.09664697645226
66166171.401973756049-5.40197375604933
67180176.9766490538173.02335094618329
68131124.6283119153266.37168808467382
69135121.35581484136613.6441851586335
70127126.3745729256450.625427074355116
71121132.519873858545-11.5198738585446
72116114.618507468251.38149253174996


Extrapolation Forecasts of Exponential Smoothing
tForecast95% Lower Bound95% Upper Bound
73142.696819036988131.735833408449153.657804665528
74160.115256076253141.982560748337178.24795140417
75161.185909930366136.19883230941186.172987551323
76155.157810472416123.995297762121186.320323182711
77162.318334526929121.987513141685202.649155912174
78210.369909910129148.170865614594272.568954205663
79231.315305912798151.690518305261310.940093520335
80164.96679185588599.5772164583057230.356367253465
81155.95519573818185.7850254592201226.125366017142
82142.23657699941470.2446986437215214.228455355106
83142.58163558525962.1345648973792223.028706273138
84135.53794974342351.4561703720285219.619729114818

\begin{tabular}{lllllllll}
\hline
Extrapolation Forecasts of Exponential Smoothing \tabularnewline
t & Forecast & 95% Lower Bound & 95% Upper Bound \tabularnewline
73 & 142.696819036988 & 131.735833408449 & 153.657804665528 \tabularnewline
74 & 160.115256076253 & 141.982560748337 & 178.24795140417 \tabularnewline
75 & 161.185909930366 & 136.19883230941 & 186.172987551323 \tabularnewline
76 & 155.157810472416 & 123.995297762121 & 186.320323182711 \tabularnewline
77 & 162.318334526929 & 121.987513141685 & 202.649155912174 \tabularnewline
78 & 210.369909910129 & 148.170865614594 & 272.568954205663 \tabularnewline
79 & 231.315305912798 & 151.690518305261 & 310.940093520335 \tabularnewline
80 & 164.966791855885 & 99.5772164583057 & 230.356367253465 \tabularnewline
81 & 155.955195738181 & 85.7850254592201 & 226.125366017142 \tabularnewline
82 & 142.236576999414 & 70.2446986437215 & 214.228455355106 \tabularnewline
83 & 142.581635585259 & 62.1345648973792 & 223.028706273138 \tabularnewline
84 & 135.537949743423 & 51.4561703720285 & 219.619729114818 \tabularnewline
\hline
\end{tabular}
%Source: https://freestatistics.org/blog/index.php?pk=271755&T=3

[TABLE]
[ROW][C]Extrapolation Forecasts of Exponential Smoothing[/C][/ROW]
[ROW][C]t[/C][C]Forecast[/C][C]95% Lower Bound[/C][C]95% Upper Bound[/C][/ROW]
[ROW][C]73[/C][C]142.696819036988[/C][C]131.735833408449[/C][C]153.657804665528[/C][/ROW]
[ROW][C]74[/C][C]160.115256076253[/C][C]141.982560748337[/C][C]178.24795140417[/C][/ROW]
[ROW][C]75[/C][C]161.185909930366[/C][C]136.19883230941[/C][C]186.172987551323[/C][/ROW]
[ROW][C]76[/C][C]155.157810472416[/C][C]123.995297762121[/C][C]186.320323182711[/C][/ROW]
[ROW][C]77[/C][C]162.318334526929[/C][C]121.987513141685[/C][C]202.649155912174[/C][/ROW]
[ROW][C]78[/C][C]210.369909910129[/C][C]148.170865614594[/C][C]272.568954205663[/C][/ROW]
[ROW][C]79[/C][C]231.315305912798[/C][C]151.690518305261[/C][C]310.940093520335[/C][/ROW]
[ROW][C]80[/C][C]164.966791855885[/C][C]99.5772164583057[/C][C]230.356367253465[/C][/ROW]
[ROW][C]81[/C][C]155.955195738181[/C][C]85.7850254592201[/C][C]226.125366017142[/C][/ROW]
[ROW][C]82[/C][C]142.236576999414[/C][C]70.2446986437215[/C][C]214.228455355106[/C][/ROW]
[ROW][C]83[/C][C]142.581635585259[/C][C]62.1345648973792[/C][C]223.028706273138[/C][/ROW]
[ROW][C]84[/C][C]135.537949743423[/C][C]51.4561703720285[/C][C]219.619729114818[/C][/ROW]
[/TABLE]
Source: https://freestatistics.org/blog/index.php?pk=271755&T=3

Globally Unique Identifier (entire table): ba.freestatistics.org/blog/index.php?pk=271755&T=3

As an alternative you can also use a QR Code:  

The GUIDs for individual cells are displayed in the table below:

Extrapolation Forecasts of Exponential Smoothing
tForecast95% Lower Bound95% Upper Bound
73142.696819036988131.735833408449153.657804665528
74160.115256076253141.982560748337178.24795140417
75161.185909930366136.19883230941186.172987551323
76155.157810472416123.995297762121186.320323182711
77162.318334526929121.987513141685202.649155912174
78210.369909910129148.170865614594272.568954205663
79231.315305912798151.690518305261310.940093520335
80164.96679185588599.5772164583057230.356367253465
81155.95519573818185.7850254592201226.125366017142
82142.23657699941470.2446986437215214.228455355106
83142.58163558525962.1345648973792223.028706273138
84135.53794974342351.4561703720285219.619729114818


Parameters (Session):
par1 = 12 ; par2 = Triple ; par3 = multiplicative ;
Parameters (R input):
par1 = 12 ; par2 = Triple ; par3 = multiplicative ;
R code (references can be found in the software module):
par1 <- as.numeric(par1)
if (par2 == 'Single') K <- 1
if (par2 == 'Double') K <- 2
if (par2 == 'Triple') K <- par1
nx <- length(x)
nxmK <- nx - K
x <- ts(x, frequency = par1)
if (par2 == 'Single') fit <- HoltWinters(x, gamma=F, beta=F)
if (par2 == 'Double') fit <- HoltWinters(x, gamma=F)
if (par2 == 'Triple') fit <- HoltWinters(x, seasonal=par3)
fit
myresid <- x - fit$fitted[,'xhat']
bitmap(file='test1.png')
op <- par(mfrow=c(2,1))
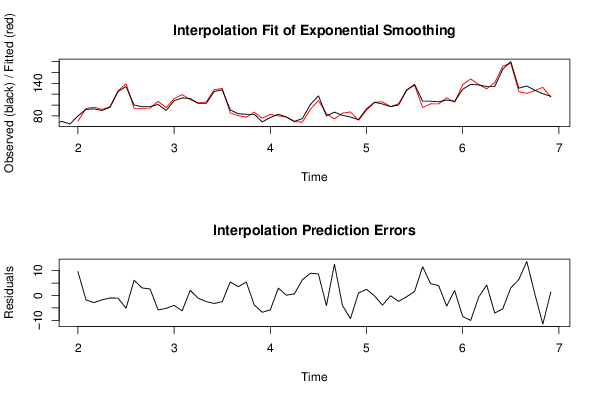
plot(fit,ylab='Observed (black) / Fitted (red)',main='Interpolation Fit of Exponential Smoothing')
plot(myresid,ylab='Residuals',main='Interpolation Prediction Errors')
par(op)
dev.off()
bitmap(file='test2.png')
p <- predict(fit, par1, prediction.interval=TRUE)
np <- length(p[,1])
plot(fit,p,ylab='Observed (black) / Fitted (red)',main='Extrapolation Fit of Exponential Smoothing')
dev.off()
bitmap(file='test3.png')
op <- par(mfrow = c(2,2))
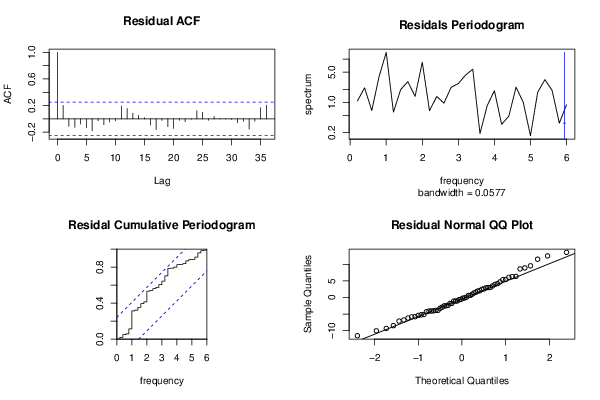
acf(as.numeric(myresid),lag.max = nx/2,main='Residual ACF')
spectrum(myresid,main='Residals Periodogram')
cpgram(myresid,main='Residal Cumulative Periodogram')
qqnorm(myresid,main='Residual Normal QQ Plot')
qqline(myresid)
par(op)
dev.off()
load(file='createtable')
a<-table.start()
a<-table.row.start(a)
a<-table.element(a,'Estimated Parameters of Exponential Smoothing',2,TRUE)
a<-table.row.end(a)
a<-table.row.start(a)
a<-table.element(a,'Parameter',header=TRUE)
a<-table.element(a,'Value',header=TRUE)
a<-table.row.end(a)
a<-table.row.start(a)
a<-table.element(a,'alpha',header=TRUE)
a<-table.element(a,fit$alpha)
a<-table.row.end(a)
a<-table.row.start(a)
a<-table.element(a,'beta',header=TRUE)
a<-table.element(a,fit$beta)
a<-table.row.end(a)
a<-table.row.start(a)
a<-table.element(a,'gamma',header=TRUE)
a<-table.element(a,fit$gamma)
a<-table.row.end(a)
a<-table.end(a)
table.save(a,file='mytable.tab')
a<-table.start()
a<-table.row.start(a)
a<-table.element(a,'Interpolation Forecasts of Exponential Smoothing',4,TRUE)
a<-table.row.end(a)
a<-table.row.start(a)
a<-table.element(a,'t',header=TRUE)
a<-table.element(a,'Observed',header=TRUE)
a<-table.element(a,'Fitted',header=TRUE)
a<-table.element(a,'Residuals',header=TRUE)
a<-table.row.end(a)
for (i in 1:nxmK) {
a<-table.row.start(a)
a<-table.element(a,i+K,header=TRUE)
a<-table.element(a,x[i+K])
a<-table.element(a,fit$fitted[i,'xhat'])
a<-table.element(a,myresid[i])
a<-table.row.end(a)
}
a<-table.end(a)
table.save(a,file='mytable1.tab')
a<-table.start()
a<-table.row.start(a)
a<-table.element(a,'Extrapolation Forecasts of Exponential Smoothing',4,TRUE)
a<-table.row.end(a)
a<-table.row.start(a)
a<-table.element(a,'t',header=TRUE)
a<-table.element(a,'Forecast',header=TRUE)
a<-table.element(a,'95% Lower Bound',header=TRUE)
a<-table.element(a,'95% Upper Bound',header=TRUE)
a<-table.row.end(a)
for (i in 1:np) {
a<-table.row.start(a)
a<-table.element(a,nx+i,header=TRUE)
a<-table.element(a,p[i,'fit'])
a<-table.element(a,p[i,'lwr'])
a<-table.element(a,p[i,'upr'])
a<-table.row.end(a)
}
a<-table.end(a)
table.save(a,file='mytable2.tab')