Free Statistics

of Irreproducible Research!

Author's title

Author*Unverified author*
R Software Modulerwasp_autocorrelation.wasp
Title produced by software(Partial) Autocorrelation Function
Date of computationTue, 30 Dec 2014 13:17:41 +0000
Cite this page as followsStatistical Computations at FreeStatistics.org, Office for Research Development and Education, URL https://freestatistics.org/blog/index.php?v=date/2014/Dec/30/t14199455167yhqpg4ktw3qkjg.htm/, Retrieved Sun, 19 May 2024 15:36:19 +0000
Statistical Computations at FreeStatistics.org, Office for Research Development and Education, URL https://freestatistics.org/blog/index.php?pk=271737, Retrieved Sun, 19 May 2024 15:36:19 +0000
QR Codes:

Original text written by user:
IsPrivate?No (this computation is public)
User-defined keywords
Estimated Impact92
Family? (F = Feedback message, R = changed R code, M = changed R Module, P = changed Parameters, D = changed Data)
-       [(Partial) Autocorrelation Function] [Verkopen motorvoe...] [2014-12-30 13:17:41] [f3214e2e5ea63970beb6f1c2b92f5ecb] [Current]
Feedback Forum

Post a new message
Dataseries X:
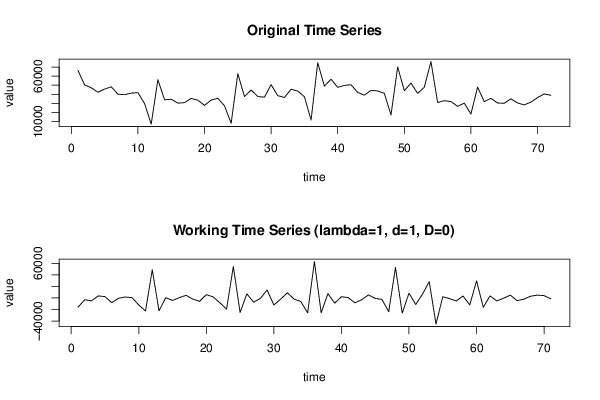
66329
50326
47182
42247
45796
48233
40079
39596
41275
41875
29784
7199
56166
33936
34532
30261
30857
35461
33525
27825
33624
35618
27329
8081
62751
37565
44749
37537
36825
50679
38488
36522
45545
43571
37343
11593
74784
49019
56601
47634
49807
50499
42092
39064
44376
43616
41059
17226
70170
43949
52333
41034
47760
76115
30918
32994
31947
26763
30251
18211
47957
31901
35560
30408
30083
35044
30475
28308
31395
36311
40426
38948


Summary of computational transaction
Raw Inputview raw input (R code)
Raw Outputview raw output of R engine
Computing time2 seconds
R Server'Gertrude Mary Cox' @ cox.wessa.net

\begin{tabular}{lllllllll}
\hline
Summary of computational transaction \tabularnewline
Raw Input & view raw input (R code)  \tabularnewline
Raw Output & view raw output of R engine  \tabularnewline
Computing time & 2 seconds \tabularnewline
R Server & 'Gertrude Mary Cox' @ cox.wessa.net \tabularnewline
\hline
\end{tabular}
%Source: https://freestatistics.org/blog/index.php?pk=271737&T=0

[TABLE]
[ROW][C]Summary of computational transaction[/C][/ROW]
[ROW][C]Raw Input[/C][C]view raw input (R code) [/C][/ROW]
[ROW][C]Raw Output[/C][C]view raw output of R engine [/C][/ROW]
[ROW][C]Computing time[/C][C]2 seconds[/C][/ROW]
[ROW][C]R Server[/C][C]'Gertrude Mary Cox' @ cox.wessa.net[/C][/ROW]
[/TABLE]
Source: https://freestatistics.org/blog/index.php?pk=271737&T=0

Globally Unique Identifier (entire table): ba.freestatistics.org/blog/index.php?pk=271737&T=0

As an alternative you can also use a QR Code:  

The GUIDs for individual cells are displayed in the table below:

Summary of computational transaction
Raw Inputview raw input (R code)
Raw Outputview raw output of R engine
Computing time2 seconds
R Server'Gertrude Mary Cox' @ cox.wessa.net


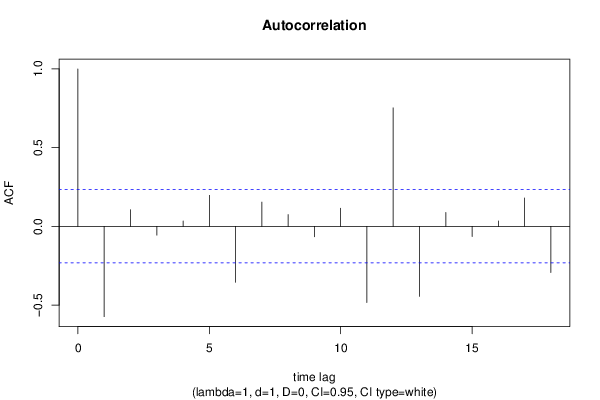
Autocorrelation Function
Time lag kACF(k)T-STATP-value
1-0.573637-4.83364e-06
20.1051280.88580.189351
3-0.055635-0.46880.320329
40.0339960.28650.387681
50.1970081.660.050661
6-0.354611-2.9880.001927
70.1538451.29630.099532
80.0748430.63060.265151
9-0.065688-0.55350.29083
100.1145960.96560.16876
11-0.484002-4.07835.9e-05
120.7530136.3450
13-0.444923-3.7490.000179
140.0883080.74410.229636
15-0.064685-0.5450.293714
160.0338930.28560.388013
170.179911.5160.066986
18-0.293182-2.47040.00795

\begin{tabular}{lllllllll}
\hline
Autocorrelation Function \tabularnewline
Time lag k & ACF(k) & T-STAT & P-value \tabularnewline
1 & -0.573637 & -4.8336 & 4e-06 \tabularnewline
2 & 0.105128 & 0.8858 & 0.189351 \tabularnewline
3 & -0.055635 & -0.4688 & 0.320329 \tabularnewline
4 & 0.033996 & 0.2865 & 0.387681 \tabularnewline
5 & 0.197008 & 1.66 & 0.050661 \tabularnewline
6 & -0.354611 & -2.988 & 0.001927 \tabularnewline
7 & 0.153845 & 1.2963 & 0.099532 \tabularnewline
8 & 0.074843 & 0.6306 & 0.265151 \tabularnewline
9 & -0.065688 & -0.5535 & 0.29083 \tabularnewline
10 & 0.114596 & 0.9656 & 0.16876 \tabularnewline
11 & -0.484002 & -4.0783 & 5.9e-05 \tabularnewline
12 & 0.753013 & 6.345 & 0 \tabularnewline
13 & -0.444923 & -3.749 & 0.000179 \tabularnewline
14 & 0.088308 & 0.7441 & 0.229636 \tabularnewline
15 & -0.064685 & -0.545 & 0.293714 \tabularnewline
16 & 0.033893 & 0.2856 & 0.388013 \tabularnewline
17 & 0.17991 & 1.516 & 0.066986 \tabularnewline
18 & -0.293182 & -2.4704 & 0.00795 \tabularnewline
\hline
\end{tabular}
%Source: https://freestatistics.org/blog/index.php?pk=271737&T=1

[TABLE]
[ROW][C]Autocorrelation Function[/C][/ROW]
[ROW][C]Time lag k[/C][C]ACF(k)[/C][C]T-STAT[/C][C]P-value[/C][/ROW]
[ROW][C]1[/C][C]-0.573637[/C][C]-4.8336[/C][C]4e-06[/C][/ROW]
[ROW][C]2[/C][C]0.105128[/C][C]0.8858[/C][C]0.189351[/C][/ROW]
[ROW][C]3[/C][C]-0.055635[/C][C]-0.4688[/C][C]0.320329[/C][/ROW]
[ROW][C]4[/C][C]0.033996[/C][C]0.2865[/C][C]0.387681[/C][/ROW]
[ROW][C]5[/C][C]0.197008[/C][C]1.66[/C][C]0.050661[/C][/ROW]
[ROW][C]6[/C][C]-0.354611[/C][C]-2.988[/C][C]0.001927[/C][/ROW]
[ROW][C]7[/C][C]0.153845[/C][C]1.2963[/C][C]0.099532[/C][/ROW]
[ROW][C]8[/C][C]0.074843[/C][C]0.6306[/C][C]0.265151[/C][/ROW]
[ROW][C]9[/C][C]-0.065688[/C][C]-0.5535[/C][C]0.29083[/C][/ROW]
[ROW][C]10[/C][C]0.114596[/C][C]0.9656[/C][C]0.16876[/C][/ROW]
[ROW][C]11[/C][C]-0.484002[/C][C]-4.0783[/C][C]5.9e-05[/C][/ROW]
[ROW][C]12[/C][C]0.753013[/C][C]6.345[/C][C]0[/C][/ROW]
[ROW][C]13[/C][C]-0.444923[/C][C]-3.749[/C][C]0.000179[/C][/ROW]
[ROW][C]14[/C][C]0.088308[/C][C]0.7441[/C][C]0.229636[/C][/ROW]
[ROW][C]15[/C][C]-0.064685[/C][C]-0.545[/C][C]0.293714[/C][/ROW]
[ROW][C]16[/C][C]0.033893[/C][C]0.2856[/C][C]0.388013[/C][/ROW]
[ROW][C]17[/C][C]0.17991[/C][C]1.516[/C][C]0.066986[/C][/ROW]
[ROW][C]18[/C][C]-0.293182[/C][C]-2.4704[/C][C]0.00795[/C][/ROW]
[/TABLE]
Source: https://freestatistics.org/blog/index.php?pk=271737&T=1

Globally Unique Identifier (entire table): ba.freestatistics.org/blog/index.php?pk=271737&T=1

As an alternative you can also use a QR Code:  

The GUIDs for individual cells are displayed in the table below:

Autocorrelation Function
Time lag kACF(k)T-STATP-value
1-0.573637-4.83364e-06
20.1051280.88580.189351
3-0.055635-0.46880.320329
40.0339960.28650.387681
50.1970081.660.050661
6-0.354611-2.9880.001927
70.1538451.29630.099532
80.0748430.63060.265151
9-0.065688-0.55350.29083
100.1145960.96560.16876
11-0.484002-4.07835.9e-05
120.7530136.3450
13-0.444923-3.7490.000179
140.0883080.74410.229636
15-0.064685-0.5450.293714
160.0338930.28560.388013
170.179911.5160.066986
18-0.293182-2.47040.00795


Partial Autocorrelation Function
Time lag kPACF(k)T-STATP-value
1-0.573637-4.83364e-06
2-0.333758-2.81230.003178
3-0.279533-2.35540.010635
4-0.212039-1.78670.03913
50.2251181.89690.030956
6-0.104056-0.87680.191779
7-0.206123-1.73680.043378
80.0140770.11860.452957
9-0.016573-0.13970.444666
100.1923621.62090.054739
11-0.491299-4.13984.7e-05
120.3752443.16190.001153
130.156161.31580.096233
140.0748510.63070.265128
15-0.036418-0.30690.379924
160.0234880.19790.421838
17-0.055607-0.46860.320412
180.0241450.20340.419684

\begin{tabular}{lllllllll}
\hline
Partial Autocorrelation Function \tabularnewline
Time lag k & PACF(k) & T-STAT & P-value \tabularnewline
1 & -0.573637 & -4.8336 & 4e-06 \tabularnewline
2 & -0.333758 & -2.8123 & 0.003178 \tabularnewline
3 & -0.279533 & -2.3554 & 0.010635 \tabularnewline
4 & -0.212039 & -1.7867 & 0.03913 \tabularnewline
5 & 0.225118 & 1.8969 & 0.030956 \tabularnewline
6 & -0.104056 & -0.8768 & 0.191779 \tabularnewline
7 & -0.206123 & -1.7368 & 0.043378 \tabularnewline
8 & 0.014077 & 0.1186 & 0.452957 \tabularnewline
9 & -0.016573 & -0.1397 & 0.444666 \tabularnewline
10 & 0.192362 & 1.6209 & 0.054739 \tabularnewline
11 & -0.491299 & -4.1398 & 4.7e-05 \tabularnewline
12 & 0.375244 & 3.1619 & 0.001153 \tabularnewline
13 & 0.15616 & 1.3158 & 0.096233 \tabularnewline
14 & 0.074851 & 0.6307 & 0.265128 \tabularnewline
15 & -0.036418 & -0.3069 & 0.379924 \tabularnewline
16 & 0.023488 & 0.1979 & 0.421838 \tabularnewline
17 & -0.055607 & -0.4686 & 0.320412 \tabularnewline
18 & 0.024145 & 0.2034 & 0.419684 \tabularnewline
\hline
\end{tabular}
%Source: https://freestatistics.org/blog/index.php?pk=271737&T=2

[TABLE]
[ROW][C]Partial Autocorrelation Function[/C][/ROW]
[ROW][C]Time lag k[/C][C]PACF(k)[/C][C]T-STAT[/C][C]P-value[/C][/ROW]
[ROW][C]1[/C][C]-0.573637[/C][C]-4.8336[/C][C]4e-06[/C][/ROW]
[ROW][C]2[/C][C]-0.333758[/C][C]-2.8123[/C][C]0.003178[/C][/ROW]
[ROW][C]3[/C][C]-0.279533[/C][C]-2.3554[/C][C]0.010635[/C][/ROW]
[ROW][C]4[/C][C]-0.212039[/C][C]-1.7867[/C][C]0.03913[/C][/ROW]
[ROW][C]5[/C][C]0.225118[/C][C]1.8969[/C][C]0.030956[/C][/ROW]
[ROW][C]6[/C][C]-0.104056[/C][C]-0.8768[/C][C]0.191779[/C][/ROW]
[ROW][C]7[/C][C]-0.206123[/C][C]-1.7368[/C][C]0.043378[/C][/ROW]
[ROW][C]8[/C][C]0.014077[/C][C]0.1186[/C][C]0.452957[/C][/ROW]
[ROW][C]9[/C][C]-0.016573[/C][C]-0.1397[/C][C]0.444666[/C][/ROW]
[ROW][C]10[/C][C]0.192362[/C][C]1.6209[/C][C]0.054739[/C][/ROW]
[ROW][C]11[/C][C]-0.491299[/C][C]-4.1398[/C][C]4.7e-05[/C][/ROW]
[ROW][C]12[/C][C]0.375244[/C][C]3.1619[/C][C]0.001153[/C][/ROW]
[ROW][C]13[/C][C]0.15616[/C][C]1.3158[/C][C]0.096233[/C][/ROW]
[ROW][C]14[/C][C]0.074851[/C][C]0.6307[/C][C]0.265128[/C][/ROW]
[ROW][C]15[/C][C]-0.036418[/C][C]-0.3069[/C][C]0.379924[/C][/ROW]
[ROW][C]16[/C][C]0.023488[/C][C]0.1979[/C][C]0.421838[/C][/ROW]
[ROW][C]17[/C][C]-0.055607[/C][C]-0.4686[/C][C]0.320412[/C][/ROW]
[ROW][C]18[/C][C]0.024145[/C][C]0.2034[/C][C]0.419684[/C][/ROW]
[/TABLE]
Source: https://freestatistics.org/blog/index.php?pk=271737&T=2

Globally Unique Identifier (entire table): ba.freestatistics.org/blog/index.php?pk=271737&T=2

As an alternative you can also use a QR Code:  

The GUIDs for individual cells are displayed in the table below:

Partial Autocorrelation Function
Time lag kPACF(k)T-STATP-value
1-0.573637-4.83364e-06
2-0.333758-2.81230.003178
3-0.279533-2.35540.010635
4-0.212039-1.78670.03913
50.2251181.89690.030956
6-0.104056-0.87680.191779
7-0.206123-1.73680.043378
80.0140770.11860.452957
9-0.016573-0.13970.444666
100.1923621.62090.054739
11-0.491299-4.13984.7e-05
120.3752443.16190.001153
130.156161.31580.096233
140.0748510.63070.265128
15-0.036418-0.30690.379924
160.0234880.19790.421838
17-0.055607-0.46860.320412
180.0241450.20340.419684


Parameters (Session):
par1 = Default ; par2 = 1 ; par3 = 1 ; par4 = 0 ; par5 = 12 ; par6 = White Noise ; par7 = 0.95 ;
Parameters (R input):
par1 = Default ; par2 = 1 ; par3 = 1 ; par4 = 0 ; par5 = 12 ; par6 = White Noise ; par7 = 0.95 ; par8 = ;
R code (references can be found in the software module):
par8 <- ''
par7 <- '0.95'
par6 <- 'White Noise'
par5 <- '12'
par4 <- '0'
par3 <- '1'
par2 <- '1'
par1 <- 'Default'
if (par1 == 'Default') {
par1 = 10*log10(length(x))
} else {
par1 <- as.numeric(par1)
}
par2 <- as.numeric(par2)
par3 <- as.numeric(par3)
par4 <- as.numeric(par4)
par5 <- as.numeric(par5)
if (par6 == 'White Noise') par6 <- 'white' else par6 <- 'ma'
par7 <- as.numeric(par7)
if (par8 != '') par8 <- as.numeric(par8)
ox <- x
if (par8 == '') {
if (par2 == 0) {
x <- log(x)
} else {
x <- (x ^ par2 - 1) / par2
}
} else {
x <- log(x,base=par8)
}
if (par3 > 0) x <- diff(x,lag=1,difference=par3)
if (par4 > 0) x <- diff(x,lag=par5,difference=par4)
bitmap(file='picts.png')
op <- par(mfrow=c(2,1))
plot(ox,type='l',main='Original Time Series',xlab='time',ylab='value')
if (par8=='') {
mytitle <- paste('Working Time Series (lambda=',par2,', d=',par3,', D=',par4,')',sep='')
mysub <- paste('(lambda=',par2,', d=',par3,', D=',par4,', CI=', par7, ', CI type=',par6,')',sep='')
} else {
mytitle <- paste('Working Time Series (base=',par8,', d=',par3,', D=',par4,')',sep='')
mysub <- paste('(base=',par8,', d=',par3,', D=',par4,', CI=', par7, ', CI type=',par6,')',sep='')
}
plot(x,type='l', main=mytitle,xlab='time',ylab='value')
par(op)
dev.off()
bitmap(file='pic1.png')
racf <- acf(x, par1, main='Autocorrelation', xlab='time lag', ylab='ACF', ci.type=par6, ci=par7, sub=mysub)
dev.off()
bitmap(file='pic2.png')
rpacf <- pacf(x,par1,main='Partial Autocorrelation',xlab='lags',ylab='PACF',sub=mysub)
dev.off()
(myacf <- c(racf$acf))
(mypacf <- c(rpacf$acf))
lengthx <- length(x)
sqrtn <- sqrt(lengthx)
load(file='createtable')
a<-table.start()
a<-table.row.start(a)
a<-table.element(a,'Autocorrelation Function',4,TRUE)
a<-table.row.end(a)
a<-table.row.start(a)
a<-table.element(a,'Time lag k',header=TRUE)
a<-table.element(a,hyperlink('basics.htm','ACF(k)','click here for more information about the Autocorrelation Function'),header=TRUE)
a<-table.element(a,'T-STAT',header=TRUE)
a<-table.element(a,'P-value',header=TRUE)
a<-table.row.end(a)
for (i in 2:(par1+1)) {
a<-table.row.start(a)
a<-table.element(a,i-1,header=TRUE)
a<-table.element(a,round(myacf[i],6))
mytstat <- myacf[i]*sqrtn
a<-table.element(a,round(mytstat,4))
a<-table.element(a,round(1-pt(abs(mytstat),lengthx),6))
a<-table.row.end(a)
}
a<-table.end(a)
table.save(a,file='mytable.tab')
a<-table.start()
a<-table.row.start(a)
a<-table.element(a,'Partial Autocorrelation Function',4,TRUE)
a<-table.row.end(a)
a<-table.row.start(a)
a<-table.element(a,'Time lag k',header=TRUE)
a<-table.element(a,hyperlink('basics.htm','PACF(k)','click here for more information about the Partial Autocorrelation Function'),header=TRUE)
a<-table.element(a,'T-STAT',header=TRUE)
a<-table.element(a,'P-value',header=TRUE)
a<-table.row.end(a)
for (i in 1:par1) {
a<-table.row.start(a)
a<-table.element(a,i,header=TRUE)
a<-table.element(a,round(mypacf[i],6))
mytstat <- mypacf[i]*sqrtn
a<-table.element(a,round(mytstat,4))
a<-table.element(a,round(1-pt(abs(mytstat),lengthx),6))
a<-table.row.end(a)
}
a<-table.end(a)
table.save(a,file='mytable1.tab')