Free Statistics

of Irreproducible Research!

Author's title

Author*The author of this computation has been verified*
R Software Modulerwasp_arimaforecasting.wasp
Title produced by softwareARIMA Forecasting
Date of computationThu, 18 Dec 2014 21:23:31 +0000
Cite this page as followsStatistical Computations at FreeStatistics.org, Office for Research Development and Education, URL https://freestatistics.org/blog/index.php?v=date/2014/Dec/18/t14189380157y9rshj57jj4yvs.htm/, Retrieved Sun, 19 May 2024 20:28:37 +0000
Statistical Computations at FreeStatistics.org, Office for Research Development and Education, URL https://freestatistics.org/blog/index.php?pk=271297, Retrieved Sun, 19 May 2024 20:28:37 +0000
QR Codes:

Original text written by user:
IsPrivate?No (this computation is public)
User-defined keywords
Estimated Impact55
Family? (F = Feedback message, R = changed R code, M = changed R Module, P = changed Parameters, D = changed Data)
-     [Univariate Data Series] [] [2008-12-08 19:22:39] [d2d412c7f4d35ffbf5ee5ee89db327d4]
- RMP   [ARIMA Backward Selection] [] [2011-12-06 19:59:13] [b98453cac15ba1066b407e146608df68]
- RMPD      [ARIMA Forecasting] [forecast] [2014-12-18 21:23:31] [0adf43ccf8dfa476608a94fd7836e72e] [Current]
Feedback Forum

Post a new message
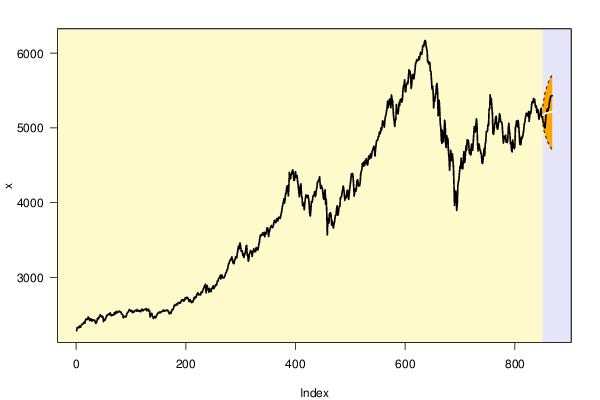
Dataseries X:
2284.86
2329.22
2324.32
2331.88
2323.48
2349.66
2338.19
2329.51
2356.45
2359.05
2376.87
2371.3
2380.9
2398.76
2390.53
2384.47
2423.07
2443.72
2432.93
2446.05
2435.79
2470.14
2459.26
2452.06
2419.01
2428.28
2446.16
2430.2
2411.93
2428.05
2433.91
2427.07
2423.01
2429.02
2398.58
2382.61
2391.12
2412
2451.78
2442.34
2444.92
2472.5
2473.55
2501.22
2487.99
2479.03
2466.04
2480.94
2469.12
2407.79
2435.97
2426.38
2426.49
2458.23
2463.16
2493.26
2485.9
2504.12
2504.02
2510.32
2499.32
2525.42
2508.44
2485.87
2489.09
2501.22
2494.4
2495.18
2503.26
2530.02
2509.71
2511.78
2545.94
2538.38
2524.18
2535.52
2536.52
2545.91
2550.18
2538.26
2532.41
2537.17
2506.46
2505.25
2502.31
2457.49
2468.91
2479.53
2472.64
2469.38
2468.78
2496.17
2519.73
2528.75
2537.33
2550
2570.78
2556.87
2560.46
2542.24
2558.3
2551.45
2527.31
2542.8
2532.83
2546.25
2552.53
2557.43
2558.81
2546.35
2568.88
2567.47
2548.83
2546.12
2549.29
2554.29
2539.67
2540.11
2566.43
2572.96
2573.69
2551.62
2561.39
2564
2572.25
2568.95
2577.39
2583.49
2551.04
2562.18
2567.43
2575.54
2544.26
2550.53
2469.79
2497.19
2506.22
2520.19
2482.4
2475.07
2447.8
2465
2470.34
2477.81
2457.48
2473.35
2494.46
2508.65
2520.93
2522.47
2531.89
2538.15
2525.64
2528.18
2539.41
2538.68
2546.33
2548.36
2562.76
2560.26
2543.74
2557.26
2555.16
2552.36
2558.84
2563.16
2560.06
2543.83
2532.88
2510.77
2532.39
2529.54
2517
2548.73
2570.95
2566.8
2570.32
2595.96
2629.87
2628.08
2625.7
2624.44
2646.1
2628.6
2638.45
2658.97
2666.55
2659.04
2651.85
2655.73
2676.5
2683.28
2702.64
2691.17
2702.99
2680.75
2686.03
2693.88
2728.45
2714.9
2716.26
2734.82
2729.03
2718.98
2699.53
2678.43
2674.22
2703.83
2673.62
2678.73
2659.25
2683.25
2671.86
2691.29
2729.19
2713.22
2739.83
2728.32
2734.3
2773.43
2777.01
2795.8
2763.84
2764.09
2774.5
2772.34
2763.69
2799.19
2810.64
2797.03
2817.49
2845.52
2858.6
2886.98
2866.06
2909.91
2791.96
2857.24
2891
2841.05
2847.08
2799.71
2855.79
2815.13
2820.75
2807.75
2854.45
2845.57
2852.88
2888.69
2848.77
2859.28
2881.32
2886.13
2906.34
2892.63
2933.39
2954.95
2948.88
2988.45
2993.31
3001.37
3030.68
2976.71
3028.67
3033.45
2998.24
2994.53
2989.33
2999.2
3017.32
3035.15
3062.29
3067.06
3098
3104.14
3138.01
3184.36
3187.58
3216.14
3229.48
3248.18
3232.57
3276.16
3233.75
3196.03
3184.09
3184.21
3233.21
3237.87
3276.72
3259.64
3263.86
3320.66
3364.99
3417.6
3376.2
3436.06
3460.58
3415.4
3349.81
3359.29
3350.99
3291.19
3315.93
3264.67
3298.24
3321.84
3349.14
3418.12
3429.04
3295.93
3301.91
3215.24
3244.93
3312.88
3329.76
3359.46
3351.49
3340.05
3279.9
3327.68
3353.45
3383.25
3344.39
3347.58
3340.33
3395.95
3397.36
3374.1
3363.06
3383.19
3438.07
3460.37
3528.78
3568.28
3551.98
3562.41
3575.37
3595.14
3573.69
3562.11
3604.54
3543.43
3596.08
3579.42
3602.18
3657.86
3664.94
3636.41
3547.84
3605.62
3625.74
3661.84
3673.03
3695.29
3667.43
3665.01
3677.43
3707.99
3744.44
3765.11
3741.48
3730.27
3749.27
3788.27
3754.72
3755.82
3798.5
3805.29
3795.41
3785.77
3819.85
3854.76
3887.39
3942.53
3972.84
4006.4
4055.86
3992.38
4040.97
4124.19
4121.13
4201.24
4227.31
4196.53
4090.06
4230.42
4406.09
4335.74
4317.64
4371.16
4381.69
4421.72
4438.93
4408.79
4296.94
4302.68
4335.39
4414.35
4354.15
4333.13
4363.09
4278.48
4231.43
4152.86
4078.6
4169.62
4223.43
4253.67
4086.01
4071.79
3959.33
3995.66
3973.65
3906.02
3989.96
4047.37
4103.65
4071.68
4100.67
4068.01
4094.39
4050.14
3972.55
3854.81
3820.13
3898.95
4010.48
4000.48
4032.97
4088.92
4098.2
4102.39
4148.58
4080.78
4104.27
4167.85
4196.97
4273.71
4273.71
4302.13
4307.39
4347.24
4243.01
4188.52
4231.4
4202.37
4193.69
4118.22
4061.5
4040.75
4139.5
4171.45
3977.26
4050.87
3879.12
3567.22
3791.81
3727.4
3726.69
3854.07
3812.45
3866.68
3823.91
3699.89
3752.53
3731.08
3659.27
3704.29
3730.94
3794.61
3833.47
3834.82
3915.94
3959.69
3830.63
3849.23
3916.53
3953.84
3949.14
4068.05
4072.96
4082.89
4139.8
4170.08
4223.36
4184.91
4117.27
4030.16
4082.6
4060.04
4083.97
4158.68
4166.24
4084.75
4043.02
4121.79
4197.37
4249.69
4315.37
4384.81
4352.63
4391.54
4347.23
4236.94
4087.28
4159.4
4190.08
4148.34
4184.46
4284.94
4307.91
4282.84
4220.25
4237.31
4224.78
4278.76
4391.02
4419.38
4440.38
4522.81
4532.52
4486.95
4548.46
4496.33
4563.55
4523.75
4588.43
4536.83
4502.48
4520.64
4602.4
4628.83
4582.4
4602.65
4657.54
4599.54
4635.82
4692.03
4709.83
4736.74
4757.14
4709.58
4623.4
4715.95
4780.83
4834.43
4832.76
4839.6
4889.65
4883.85
4946.68
4919.72
4936.32
5001.55
4971.32
5028.24
5096.62
5039.76
5083.16
5009.76
5102.35
5154.21
5176.66
5223.52
5271.65
5357.05
5269.46
5317.22
5374.78
5388.47
5324.14
5268.75
5442
5388.93
5360.65
5251.46
5144.28
5088.13
5018.67
5108.48
5107.44
5314.66
5232.03
5229.8
5186.22
5257.58
5341.69
5297.35
5376.88
5361.22
5393.14
5342.85
5388.89
5510.97
5564.21
5575.16
5644.29
5490.64
5481.26
5569.08
5582.78
5613.76
5592.48
5688.5
5779.09
5760.02
5754.46
5670.83
5527.32
5591.57
5709.36
5718.06
5702.61
5654.74
5718.71
5779.91
5866.63
5870.42
5915.13
5897.44
5906.85
5904.1
5953.16
5918.37
5960.98
6013.14
5996.77
5982.42
6019.48
6095.28
6108.24
6094.02
6147.86
6171.43
6165.52
6110.73
6058.45
6035.28
5885
5889.01
5853.63
5880.87
5873.92
5758.77
5756.19
5632.51
5517.64
5560.55
5476.25
5268.4
5402.37
5356.22
5447.9
5456.58
5568.88
5596.4
5488.22
5163.51
5234.88
5371.76
5231.61
5060.84
4993.54
4833.89
4791.81
4970.5
4812.18
4820.25
4923.37
5103.84
5040.87
4747.33
4737.15
4896.49
4831.22
4857.97
4669.51
4598.58
4433.87
4575.15
4699.39
4646.25
4561.58
4653.93
4578.27
4474.51
4226.49
3962.5
4034.23
4156.64
4087.83
3896.08
3983.65
4225.49
4274.48
4318.52
4399.05
4489.1
4458.4
4595.82
4523.24
4454.28
4451.09
4577.74
4682.45
4536.34
4549.33
4671.12
4761.15
4705.08
4841.72
4811.6
4836.22
4768.58
4662.78
4717.7
4639.89
4639.65
4783.77
4702.63
4698.72
4795.69
4911.88
5019.12
4958.82
4944.37
5051.63
5121.48
5022.7
4781.72
4691.69
4787.08
4775.23
4713.96
4699.34
4663.68
4642.68
4536.2
4522.86
4574.5
4663.45
4723.81
4629.23
4780.93
4825.38
4951.77
4951.77
4951.77
5044.77
5031.87
5252.36
5253.91
5443.62
5323.21
5392.84
5270.6
5200.1
4931.8
4912.75
4960.22
5050.4
5073.15
5143.06
5156.67
5019.28
4982.45
4986.8
5061.18
5096.41
5190.82
5166.87
5085.66
5077.85
5080.77
5027.22
4904.35
4796.82
4839.33
4888.74
4879.55
4904.68
4810.09
4845.08
4802.38
4845.18
4987.56
5062.31
4958.58
4911.81
4784.31
4804.02
4697.67
4678.72
4839.09
4788.68
4758.46
4721.41
4754.41
5008.16
5029.24
5094.63
5077.43
5013.62
5099.48
5027.06
4915.02
4780.13
4860.26
4775.17
4876.92
4856.84
4884.2
4914.59
4965.29
5052.27
5068.75
5124.18
5159.16
5199.18
5182.16
5181.01
5155.35
5220.14
5087.29
5163.29
5218.82
5195.42
5256.22
5347.5
5348.61
5334.42
5393.1
5377.56
5383.21
5307.22
5274.45
5297.38
5205.95
5249.15
5248.02
5173.25
5114.47
5154.94
5181.51
5235.64
5264.68
5143.1
5160.44
5083.83
5068.73
5069.83
5021.24
4997.83
5107.81
5190.14
5211.08
5253.89
5206.47
5262.14
5268.87
5342.86
5381.25
5412
5430.32
5430.32
5430.32


Summary of computational transaction
Raw Inputview raw input (R code)
Raw Outputview raw output of R engine
Computing time2 seconds
R Server'Gertrude Mary Cox' @ cox.wessa.net

\begin{tabular}{lllllllll}
\hline
Summary of computational transaction \tabularnewline
Raw Input & view raw input (R code)  \tabularnewline
Raw Output & view raw output of R engine  \tabularnewline
Computing time & 2 seconds \tabularnewline
R Server & 'Gertrude Mary Cox' @ cox.wessa.net \tabularnewline
\hline
\end{tabular}
%Source: https://freestatistics.org/blog/index.php?pk=271297&T=0

[TABLE]
[ROW][C]Summary of computational transaction[/C][/ROW]
[ROW][C]Raw Input[/C][C]view raw input (R code) [/C][/ROW]
[ROW][C]Raw Output[/C][C]view raw output of R engine [/C][/ROW]
[ROW][C]Computing time[/C][C]2 seconds[/C][/ROW]
[ROW][C]R Server[/C][C]'Gertrude Mary Cox' @ cox.wessa.net[/C][/ROW]
[/TABLE]
Source: https://freestatistics.org/blog/index.php?pk=271297&T=0

Globally Unique Identifier (entire table): ba.freestatistics.org/blog/index.php?pk=271297&T=0

As an alternative you can also use a QR Code:  

The GUIDs for individual cells are displayed in the table below:

Summary of computational transaction
Raw Inputview raw input (R code)
Raw Outputview raw output of R engine
Computing time2 seconds
R Server'Gertrude Mary Cox' @ cox.wessa.net


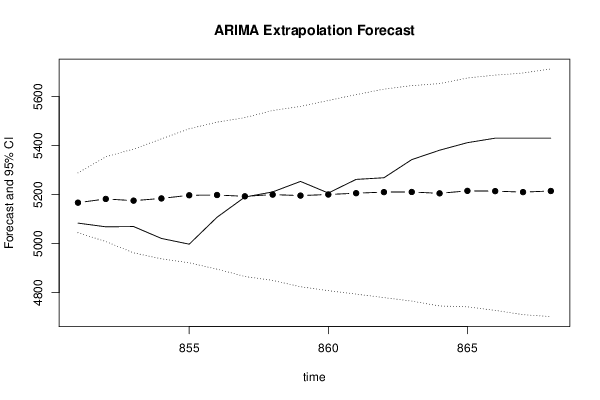
Univariate ARIMA Extrapolation Forecast
timeY[t]F[t]95% LB95% UBp-value(H0: Y[t] = F[t])P(F[t]>Y[t-1])P(F[t]>Y[t-s])P(F[t]>Y[850])
8385274.45-------
8395297.38-------
8405205.95-------
8415249.15-------
8425248.02-------
8435173.25-------
8445114.47-------
8455154.94-------
8465181.51-------
8475235.64-------
8485264.68-------
8495143.1-------
8505160.44-------
8515083.835167.17885044.53145288.9590.08990.54320.01810.5432
8525068.735182.42155008.7645354.35010.09750.86950.39430.5989
8535069.835175.43354962.28515385.97940.16280.83970.24630.5555
8545021.245184.45324938.0745427.36730.09390.82250.3040.5768
8554997.835197.40524921.75445468.7360.07470.89840.56930.6053
8565107.815198.43644896.07635495.60680.2750.90710.71010.5989
8575190.145193.13794866.01455514.18840.49270.69880.59220.5791
8585211.085200.12724850.11825543.2010.47510.52280.54240.5897
8595253.895196.044824.24765560.00960.37770.46770.41560.576
8605206.475200.54144808.27235584.11860.48790.39260.37160.5812
8615262.145205.87774794.11155608.08540.3920.49880.62020.5876
8625268.875210.32914779.87425630.35640.39240.40450.5920.592
8635342.865210.79764765.69915644.7560.27540.39650.71680.59
8645381.255205.27924745.78635652.89560.22050.27340.72510.5778
86554125215.4044742.33975675.91210.20140.24010.73220.5925
8665430.325214.26324727.65635687.59030.18550.20640.78790.5882
8675430.325210.3494710.43175696.24880.18750.18750.80430.5798
8685430.325214.82894702.15435712.78270.19820.19820.66320.5848

\begin{tabular}{lllllllll}
\hline
Univariate ARIMA Extrapolation Forecast \tabularnewline
time & Y[t] & F[t] & 95% LB & 95% UB & p-value(H0: Y[t] = F[t]) & P(F[t]>Y[t-1]) & P(F[t]>Y[t-s]) & P(F[t]>Y[850]) \tabularnewline
838 & 5274.45 & - & - & - & - & - & - & - \tabularnewline
839 & 5297.38 & - & - & - & - & - & - & - \tabularnewline
840 & 5205.95 & - & - & - & - & - & - & - \tabularnewline
841 & 5249.15 & - & - & - & - & - & - & - \tabularnewline
842 & 5248.02 & - & - & - & - & - & - & - \tabularnewline
843 & 5173.25 & - & - & - & - & - & - & - \tabularnewline
844 & 5114.47 & - & - & - & - & - & - & - \tabularnewline
845 & 5154.94 & - & - & - & - & - & - & - \tabularnewline
846 & 5181.51 & - & - & - & - & - & - & - \tabularnewline
847 & 5235.64 & - & - & - & - & - & - & - \tabularnewline
848 & 5264.68 & - & - & - & - & - & - & - \tabularnewline
849 & 5143.1 & - & - & - & - & - & - & - \tabularnewline
850 & 5160.44 & - & - & - & - & - & - & - \tabularnewline
851 & 5083.83 & 5167.1788 & 5044.5314 & 5288.959 & 0.0899 & 0.5432 & 0.0181 & 0.5432 \tabularnewline
852 & 5068.73 & 5182.4215 & 5008.764 & 5354.3501 & 0.0975 & 0.8695 & 0.3943 & 0.5989 \tabularnewline
853 & 5069.83 & 5175.4335 & 4962.2851 & 5385.9794 & 0.1628 & 0.8397 & 0.2463 & 0.5555 \tabularnewline
854 & 5021.24 & 5184.4532 & 4938.074 & 5427.3673 & 0.0939 & 0.8225 & 0.304 & 0.5768 \tabularnewline
855 & 4997.83 & 5197.4052 & 4921.7544 & 5468.736 & 0.0747 & 0.8984 & 0.5693 & 0.6053 \tabularnewline
856 & 5107.81 & 5198.4364 & 4896.0763 & 5495.6068 & 0.275 & 0.9071 & 0.7101 & 0.5989 \tabularnewline
857 & 5190.14 & 5193.1379 & 4866.0145 & 5514.1884 & 0.4927 & 0.6988 & 0.5922 & 0.5791 \tabularnewline
858 & 5211.08 & 5200.1272 & 4850.1182 & 5543.201 & 0.4751 & 0.5228 & 0.5424 & 0.5897 \tabularnewline
859 & 5253.89 & 5196.04 & 4824.2476 & 5560.0096 & 0.3777 & 0.4677 & 0.4156 & 0.576 \tabularnewline
860 & 5206.47 & 5200.5414 & 4808.2723 & 5584.1186 & 0.4879 & 0.3926 & 0.3716 & 0.5812 \tabularnewline
861 & 5262.14 & 5205.8777 & 4794.1115 & 5608.0854 & 0.392 & 0.4988 & 0.6202 & 0.5876 \tabularnewline
862 & 5268.87 & 5210.3291 & 4779.8742 & 5630.3564 & 0.3924 & 0.4045 & 0.592 & 0.592 \tabularnewline
863 & 5342.86 & 5210.7976 & 4765.6991 & 5644.756 & 0.2754 & 0.3965 & 0.7168 & 0.59 \tabularnewline
864 & 5381.25 & 5205.2792 & 4745.7863 & 5652.8956 & 0.2205 & 0.2734 & 0.7251 & 0.5778 \tabularnewline
865 & 5412 & 5215.404 & 4742.3397 & 5675.9121 & 0.2014 & 0.2401 & 0.7322 & 0.5925 \tabularnewline
866 & 5430.32 & 5214.2632 & 4727.6563 & 5687.5903 & 0.1855 & 0.2064 & 0.7879 & 0.5882 \tabularnewline
867 & 5430.32 & 5210.349 & 4710.4317 & 5696.2488 & 0.1875 & 0.1875 & 0.8043 & 0.5798 \tabularnewline
868 & 5430.32 & 5214.8289 & 4702.1543 & 5712.7827 & 0.1982 & 0.1982 & 0.6632 & 0.5848 \tabularnewline
\hline
\end{tabular}
%Source: https://freestatistics.org/blog/index.php?pk=271297&T=1

[TABLE]
[ROW][C]Univariate ARIMA Extrapolation Forecast[/C][/ROW]
[ROW][C]time[/C][C]Y[t][/C][C]F[t][/C][C]95% LB[/C][C]95% UB[/C][C]p-value(H0: Y[t] = F[t])[/C][C]P(F[t]>Y[t-1])[/C][C]P(F[t]>Y[t-s])[/C][C]P(F[t]>Y[850])[/C][/ROW]
[ROW][C]838[/C][C]5274.45[/C][C]-[/C][C]-[/C][C]-[/C][C]-[/C][C]-[/C][C]-[/C][C]-[/C][/ROW]
[ROW][C]839[/C][C]5297.38[/C][C]-[/C][C]-[/C][C]-[/C][C]-[/C][C]-[/C][C]-[/C][C]-[/C][/ROW]
[ROW][C]840[/C][C]5205.95[/C][C]-[/C][C]-[/C][C]-[/C][C]-[/C][C]-[/C][C]-[/C][C]-[/C][/ROW]
[ROW][C]841[/C][C]5249.15[/C][C]-[/C][C]-[/C][C]-[/C][C]-[/C][C]-[/C][C]-[/C][C]-[/C][/ROW]
[ROW][C]842[/C][C]5248.02[/C][C]-[/C][C]-[/C][C]-[/C][C]-[/C][C]-[/C][C]-[/C][C]-[/C][/ROW]
[ROW][C]843[/C][C]5173.25[/C][C]-[/C][C]-[/C][C]-[/C][C]-[/C][C]-[/C][C]-[/C][C]-[/C][/ROW]
[ROW][C]844[/C][C]5114.47[/C][C]-[/C][C]-[/C][C]-[/C][C]-[/C][C]-[/C][C]-[/C][C]-[/C][/ROW]
[ROW][C]845[/C][C]5154.94[/C][C]-[/C][C]-[/C][C]-[/C][C]-[/C][C]-[/C][C]-[/C][C]-[/C][/ROW]
[ROW][C]846[/C][C]5181.51[/C][C]-[/C][C]-[/C][C]-[/C][C]-[/C][C]-[/C][C]-[/C][C]-[/C][/ROW]
[ROW][C]847[/C][C]5235.64[/C][C]-[/C][C]-[/C][C]-[/C][C]-[/C][C]-[/C][C]-[/C][C]-[/C][/ROW]
[ROW][C]848[/C][C]5264.68[/C][C]-[/C][C]-[/C][C]-[/C][C]-[/C][C]-[/C][C]-[/C][C]-[/C][/ROW]
[ROW][C]849[/C][C]5143.1[/C][C]-[/C][C]-[/C][C]-[/C][C]-[/C][C]-[/C][C]-[/C][C]-[/C][/ROW]
[ROW][C]850[/C][C]5160.44[/C][C]-[/C][C]-[/C][C]-[/C][C]-[/C][C]-[/C][C]-[/C][C]-[/C][/ROW]
[ROW][C]851[/C][C]5083.83[/C][C]5167.1788[/C][C]5044.5314[/C][C]5288.959[/C][C]0.0899[/C][C]0.5432[/C][C]0.0181[/C][C]0.5432[/C][/ROW]
[ROW][C]852[/C][C]5068.73[/C][C]5182.4215[/C][C]5008.764[/C][C]5354.3501[/C][C]0.0975[/C][C]0.8695[/C][C]0.3943[/C][C]0.5989[/C][/ROW]
[ROW][C]853[/C][C]5069.83[/C][C]5175.4335[/C][C]4962.2851[/C][C]5385.9794[/C][C]0.1628[/C][C]0.8397[/C][C]0.2463[/C][C]0.5555[/C][/ROW]
[ROW][C]854[/C][C]5021.24[/C][C]5184.4532[/C][C]4938.074[/C][C]5427.3673[/C][C]0.0939[/C][C]0.8225[/C][C]0.304[/C][C]0.5768[/C][/ROW]
[ROW][C]855[/C][C]4997.83[/C][C]5197.4052[/C][C]4921.7544[/C][C]5468.736[/C][C]0.0747[/C][C]0.8984[/C][C]0.5693[/C][C]0.6053[/C][/ROW]
[ROW][C]856[/C][C]5107.81[/C][C]5198.4364[/C][C]4896.0763[/C][C]5495.6068[/C][C]0.275[/C][C]0.9071[/C][C]0.7101[/C][C]0.5989[/C][/ROW]
[ROW][C]857[/C][C]5190.14[/C][C]5193.1379[/C][C]4866.0145[/C][C]5514.1884[/C][C]0.4927[/C][C]0.6988[/C][C]0.5922[/C][C]0.5791[/C][/ROW]
[ROW][C]858[/C][C]5211.08[/C][C]5200.1272[/C][C]4850.1182[/C][C]5543.201[/C][C]0.4751[/C][C]0.5228[/C][C]0.5424[/C][C]0.5897[/C][/ROW]
[ROW][C]859[/C][C]5253.89[/C][C]5196.04[/C][C]4824.2476[/C][C]5560.0096[/C][C]0.3777[/C][C]0.4677[/C][C]0.4156[/C][C]0.576[/C][/ROW]
[ROW][C]860[/C][C]5206.47[/C][C]5200.5414[/C][C]4808.2723[/C][C]5584.1186[/C][C]0.4879[/C][C]0.3926[/C][C]0.3716[/C][C]0.5812[/C][/ROW]
[ROW][C]861[/C][C]5262.14[/C][C]5205.8777[/C][C]4794.1115[/C][C]5608.0854[/C][C]0.392[/C][C]0.4988[/C][C]0.6202[/C][C]0.5876[/C][/ROW]
[ROW][C]862[/C][C]5268.87[/C][C]5210.3291[/C][C]4779.8742[/C][C]5630.3564[/C][C]0.3924[/C][C]0.4045[/C][C]0.592[/C][C]0.592[/C][/ROW]
[ROW][C]863[/C][C]5342.86[/C][C]5210.7976[/C][C]4765.6991[/C][C]5644.756[/C][C]0.2754[/C][C]0.3965[/C][C]0.7168[/C][C]0.59[/C][/ROW]
[ROW][C]864[/C][C]5381.25[/C][C]5205.2792[/C][C]4745.7863[/C][C]5652.8956[/C][C]0.2205[/C][C]0.2734[/C][C]0.7251[/C][C]0.5778[/C][/ROW]
[ROW][C]865[/C][C]5412[/C][C]5215.404[/C][C]4742.3397[/C][C]5675.9121[/C][C]0.2014[/C][C]0.2401[/C][C]0.7322[/C][C]0.5925[/C][/ROW]
[ROW][C]866[/C][C]5430.32[/C][C]5214.2632[/C][C]4727.6563[/C][C]5687.5903[/C][C]0.1855[/C][C]0.2064[/C][C]0.7879[/C][C]0.5882[/C][/ROW]
[ROW][C]867[/C][C]5430.32[/C][C]5210.349[/C][C]4710.4317[/C][C]5696.2488[/C][C]0.1875[/C][C]0.1875[/C][C]0.8043[/C][C]0.5798[/C][/ROW]
[ROW][C]868[/C][C]5430.32[/C][C]5214.8289[/C][C]4702.1543[/C][C]5712.7827[/C][C]0.1982[/C][C]0.1982[/C][C]0.6632[/C][C]0.5848[/C][/ROW]
[/TABLE]
Source: https://freestatistics.org/blog/index.php?pk=271297&T=1

Globally Unique Identifier (entire table): ba.freestatistics.org/blog/index.php?pk=271297&T=1

As an alternative you can also use a QR Code:  

The GUIDs for individual cells are displayed in the table below:

Univariate ARIMA Extrapolation Forecast
timeY[t]F[t]95% LB95% UBp-value(H0: Y[t] = F[t])P(F[t]>Y[t-1])P(F[t]>Y[t-s])P(F[t]>Y[850])
8385274.45-------
8395297.38-------
8405205.95-------
8415249.15-------
8425248.02-------
8435173.25-------
8445114.47-------
8455154.94-------
8465181.51-------
8475235.64-------
8485264.68-------
8495143.1-------
8505160.44-------
8515083.835167.17885044.53145288.9590.08990.54320.01810.5432
8525068.735182.42155008.7645354.35010.09750.86950.39430.5989
8535069.835175.43354962.28515385.97940.16280.83970.24630.5555
8545021.245184.45324938.0745427.36730.09390.82250.3040.5768
8554997.835197.40524921.75445468.7360.07470.89840.56930.6053
8565107.815198.43644896.07635495.60680.2750.90710.71010.5989
8575190.145193.13794866.01455514.18840.49270.69880.59220.5791
8585211.085200.12724850.11825543.2010.47510.52280.54240.5897
8595253.895196.044824.24765560.00960.37770.46770.41560.576
8605206.475200.54144808.27235584.11860.48790.39260.37160.5812
8615262.145205.87774794.11155608.08540.3920.49880.62020.5876
8625268.875210.32914779.87425630.35640.39240.40450.5920.592
8635342.865210.79764765.69915644.7560.27540.39650.71680.59
8645381.255205.27924745.78635652.89560.22050.27340.72510.5778
86554125215.4044742.33975675.91210.20140.24010.73220.5925
8665430.325214.26324727.65635687.59030.18550.20640.78790.5882
8675430.325210.3494710.43175696.24880.18750.18750.80430.5798
8685430.325214.82894702.15435712.78270.19820.19820.66320.5848


Univariate ARIMA Extrapolation Forecast Performance
time% S.E.PEMAPEsMAPESq.EMSERMSEScaledEMASE
8510.012-0.01640.01640.01636947.02900-2.3022.302
8520.0169-0.02240.01940.019212925.74969936.389399.6814-3.142.721
8530.0208-0.02080.01990.019711152.097710341.6254101.6938-2.91662.7862
8540.0239-0.03250.0230.022826638.543814415.855120.066-4.50773.2166
8550.0266-0.03990.02640.02639830.271219498.7383139.6379-5.5123.6756
8560.0292-0.01770.0250.02468213.139917617.8052132.7321-2.5033.4802
8570.0315-6e-040.02150.02128.987515102.2598122.8913-0.08282.9949
8580.03370.00210.01910.0188119.964613229.4729115.01940.30252.6583
8590.03570.0110.01820.01793346.62712131.3789110.14251.59772.5405
8600.03760.00110.01650.016335.148310921.7559104.50720.16372.3028
8610.03940.01070.01590.01583165.442210216.6364101.07741.55392.2347
8620.04110.01110.01550.01543427.03769650.836598.23871.61682.1832
8630.04250.02470.01620.016117440.468610250.039101.24253.64742.2958
8640.04390.03270.01740.017330965.727811729.7311108.30394.862.479
8650.0450.03630.01870.018738649.976813524.4141116.29455.42972.6757
8660.04630.03980.020.0246680.562415596.6734124.88665.96722.8814
8670.04760.04050.02120.021348387.235217525.53132.3846.07533.0693
8680.04870.03970.02220.022346436.415219131.6902138.31745.95153.2294

\begin{tabular}{lllllllll}
\hline
Univariate ARIMA Extrapolation Forecast Performance \tabularnewline
time & % S.E. & PE & MAPE & sMAPE & Sq.E & MSE & RMSE & ScaledE & MASE \tabularnewline
851 & 0.012 & -0.0164 & 0.0164 & 0.0163 & 6947.029 & 0 & 0 & -2.302 & 2.302 \tabularnewline
852 & 0.0169 & -0.0224 & 0.0194 & 0.0192 & 12925.7496 & 9936.3893 & 99.6814 & -3.14 & 2.721 \tabularnewline
853 & 0.0208 & -0.0208 & 0.0199 & 0.0197 & 11152.0977 & 10341.6254 & 101.6938 & -2.9166 & 2.7862 \tabularnewline
854 & 0.0239 & -0.0325 & 0.023 & 0.0228 & 26638.5438 & 14415.855 & 120.066 & -4.5077 & 3.2166 \tabularnewline
855 & 0.0266 & -0.0399 & 0.0264 & 0.026 & 39830.2712 & 19498.7383 & 139.6379 & -5.512 & 3.6756 \tabularnewline
856 & 0.0292 & -0.0177 & 0.025 & 0.0246 & 8213.1399 & 17617.8052 & 132.7321 & -2.503 & 3.4802 \tabularnewline
857 & 0.0315 & -6e-04 & 0.0215 & 0.0212 & 8.9875 & 15102.2598 & 122.8913 & -0.0828 & 2.9949 \tabularnewline
858 & 0.0337 & 0.0021 & 0.0191 & 0.0188 & 119.9646 & 13229.4729 & 115.0194 & 0.3025 & 2.6583 \tabularnewline
859 & 0.0357 & 0.011 & 0.0182 & 0.0179 & 3346.627 & 12131.3789 & 110.1425 & 1.5977 & 2.5405 \tabularnewline
860 & 0.0376 & 0.0011 & 0.0165 & 0.0163 & 35.1483 & 10921.7559 & 104.5072 & 0.1637 & 2.3028 \tabularnewline
861 & 0.0394 & 0.0107 & 0.0159 & 0.0158 & 3165.4422 & 10216.6364 & 101.0774 & 1.5539 & 2.2347 \tabularnewline
862 & 0.0411 & 0.0111 & 0.0155 & 0.0154 & 3427.0376 & 9650.8365 & 98.2387 & 1.6168 & 2.1832 \tabularnewline
863 & 0.0425 & 0.0247 & 0.0162 & 0.0161 & 17440.4686 & 10250.039 & 101.2425 & 3.6474 & 2.2958 \tabularnewline
864 & 0.0439 & 0.0327 & 0.0174 & 0.0173 & 30965.7278 & 11729.7311 & 108.3039 & 4.86 & 2.479 \tabularnewline
865 & 0.045 & 0.0363 & 0.0187 & 0.0187 & 38649.9768 & 13524.4141 & 116.2945 & 5.4297 & 2.6757 \tabularnewline
866 & 0.0463 & 0.0398 & 0.02 & 0.02 & 46680.5624 & 15596.6734 & 124.8866 & 5.9672 & 2.8814 \tabularnewline
867 & 0.0476 & 0.0405 & 0.0212 & 0.0213 & 48387.2352 & 17525.53 & 132.384 & 6.0753 & 3.0693 \tabularnewline
868 & 0.0487 & 0.0397 & 0.0222 & 0.0223 & 46436.4152 & 19131.6902 & 138.3174 & 5.9515 & 3.2294 \tabularnewline
\hline
\end{tabular}
%Source: https://freestatistics.org/blog/index.php?pk=271297&T=2

[TABLE]
[ROW][C]Univariate ARIMA Extrapolation Forecast Performance[/C][/ROW]
[ROW][C]time[/C][C]% S.E.[/C][C]PE[/C][C]MAPE[/C][C]sMAPE[/C][C]Sq.E[/C][C]MSE[/C][C]RMSE[/C][C]ScaledE[/C][C]MASE[/C][/ROW]
[ROW][C]851[/C][C]0.012[/C][C]-0.0164[/C][C]0.0164[/C][C]0.0163[/C][C]6947.029[/C][C]0[/C][C]0[/C][C]-2.302[/C][C]2.302[/C][/ROW]
[ROW][C]852[/C][C]0.0169[/C][C]-0.0224[/C][C]0.0194[/C][C]0.0192[/C][C]12925.7496[/C][C]9936.3893[/C][C]99.6814[/C][C]-3.14[/C][C]2.721[/C][/ROW]
[ROW][C]853[/C][C]0.0208[/C][C]-0.0208[/C][C]0.0199[/C][C]0.0197[/C][C]11152.0977[/C][C]10341.6254[/C][C]101.6938[/C][C]-2.9166[/C][C]2.7862[/C][/ROW]
[ROW][C]854[/C][C]0.0239[/C][C]-0.0325[/C][C]0.023[/C][C]0.0228[/C][C]26638.5438[/C][C]14415.855[/C][C]120.066[/C][C]-4.5077[/C][C]3.2166[/C][/ROW]
[ROW][C]855[/C][C]0.0266[/C][C]-0.0399[/C][C]0.0264[/C][C]0.026[/C][C]39830.2712[/C][C]19498.7383[/C][C]139.6379[/C][C]-5.512[/C][C]3.6756[/C][/ROW]
[ROW][C]856[/C][C]0.0292[/C][C]-0.0177[/C][C]0.025[/C][C]0.0246[/C][C]8213.1399[/C][C]17617.8052[/C][C]132.7321[/C][C]-2.503[/C][C]3.4802[/C][/ROW]
[ROW][C]857[/C][C]0.0315[/C][C]-6e-04[/C][C]0.0215[/C][C]0.0212[/C][C]8.9875[/C][C]15102.2598[/C][C]122.8913[/C][C]-0.0828[/C][C]2.9949[/C][/ROW]
[ROW][C]858[/C][C]0.0337[/C][C]0.0021[/C][C]0.0191[/C][C]0.0188[/C][C]119.9646[/C][C]13229.4729[/C][C]115.0194[/C][C]0.3025[/C][C]2.6583[/C][/ROW]
[ROW][C]859[/C][C]0.0357[/C][C]0.011[/C][C]0.0182[/C][C]0.0179[/C][C]3346.627[/C][C]12131.3789[/C][C]110.1425[/C][C]1.5977[/C][C]2.5405[/C][/ROW]
[ROW][C]860[/C][C]0.0376[/C][C]0.0011[/C][C]0.0165[/C][C]0.0163[/C][C]35.1483[/C][C]10921.7559[/C][C]104.5072[/C][C]0.1637[/C][C]2.3028[/C][/ROW]
[ROW][C]861[/C][C]0.0394[/C][C]0.0107[/C][C]0.0159[/C][C]0.0158[/C][C]3165.4422[/C][C]10216.6364[/C][C]101.0774[/C][C]1.5539[/C][C]2.2347[/C][/ROW]
[ROW][C]862[/C][C]0.0411[/C][C]0.0111[/C][C]0.0155[/C][C]0.0154[/C][C]3427.0376[/C][C]9650.8365[/C][C]98.2387[/C][C]1.6168[/C][C]2.1832[/C][/ROW]
[ROW][C]863[/C][C]0.0425[/C][C]0.0247[/C][C]0.0162[/C][C]0.0161[/C][C]17440.4686[/C][C]10250.039[/C][C]101.2425[/C][C]3.6474[/C][C]2.2958[/C][/ROW]
[ROW][C]864[/C][C]0.0439[/C][C]0.0327[/C][C]0.0174[/C][C]0.0173[/C][C]30965.7278[/C][C]11729.7311[/C][C]108.3039[/C][C]4.86[/C][C]2.479[/C][/ROW]
[ROW][C]865[/C][C]0.045[/C][C]0.0363[/C][C]0.0187[/C][C]0.0187[/C][C]38649.9768[/C][C]13524.4141[/C][C]116.2945[/C][C]5.4297[/C][C]2.6757[/C][/ROW]
[ROW][C]866[/C][C]0.0463[/C][C]0.0398[/C][C]0.02[/C][C]0.02[/C][C]46680.5624[/C][C]15596.6734[/C][C]124.8866[/C][C]5.9672[/C][C]2.8814[/C][/ROW]
[ROW][C]867[/C][C]0.0476[/C][C]0.0405[/C][C]0.0212[/C][C]0.0213[/C][C]48387.2352[/C][C]17525.53[/C][C]132.384[/C][C]6.0753[/C][C]3.0693[/C][/ROW]
[ROW][C]868[/C][C]0.0487[/C][C]0.0397[/C][C]0.0222[/C][C]0.0223[/C][C]46436.4152[/C][C]19131.6902[/C][C]138.3174[/C][C]5.9515[/C][C]3.2294[/C][/ROW]
[/TABLE]
Source: https://freestatistics.org/blog/index.php?pk=271297&T=2

Globally Unique Identifier (entire table): ba.freestatistics.org/blog/index.php?pk=271297&T=2

As an alternative you can also use a QR Code:  

The GUIDs for individual cells are displayed in the table below:

Univariate ARIMA Extrapolation Forecast Performance
time% S.E.PEMAPEsMAPESq.EMSERMSEScaledEMASE
8510.012-0.01640.01640.01636947.02900-2.3022.302
8520.0169-0.02240.01940.019212925.74969936.389399.6814-3.142.721
8530.0208-0.02080.01990.019711152.097710341.6254101.6938-2.91662.7862
8540.0239-0.03250.0230.022826638.543814415.855120.066-4.50773.2166
8550.0266-0.03990.02640.02639830.271219498.7383139.6379-5.5123.6756
8560.0292-0.01770.0250.02468213.139917617.8052132.7321-2.5033.4802
8570.0315-6e-040.02150.02128.987515102.2598122.8913-0.08282.9949
8580.03370.00210.01910.0188119.964613229.4729115.01940.30252.6583
8590.03570.0110.01820.01793346.62712131.3789110.14251.59772.5405
8600.03760.00110.01650.016335.148310921.7559104.50720.16372.3028
8610.03940.01070.01590.01583165.442210216.6364101.07741.55392.2347
8620.04110.01110.01550.01543427.03769650.836598.23871.61682.1832
8630.04250.02470.01620.016117440.468610250.039101.24253.64742.2958
8640.04390.03270.01740.017330965.727811729.7311108.30394.862.479
8650.0450.03630.01870.018738649.976813524.4141116.29455.42972.6757
8660.04630.03980.020.0246680.562415596.6734124.88665.96722.8814
8670.04760.04050.02120.021348387.235217525.53132.3846.07533.0693
8680.04870.03970.02220.022346436.415219131.6902138.31745.95153.2294


Parameters (Session):
par1 = 1 ; par2 = 2 ; par3 = 0 ; par4 = 12 ;
Parameters (R input):
par1 = 18 ; par2 = 1.3 ; par3 = 2 ; par4 = 0 ; par5 = 12 ; par6 = 0 ; par7 = 1 ; par8 = 1 ; par9 = 1 ; par10 = FALSE ;
R code (references can be found in the software module):
par10 <- 'FALSE'
par9 <- '1'
par8 <- '1'
par7 <- '1'
par6 <- '0'
par5 <- '1'
par4 <- '0'
par3 <- '2'
par2 <- '1.3'
par1 <- '0'
par1 <- as.numeric(par1) #cut off periods
par2 <- as.numeric(par2) #lambda
par3 <- as.numeric(par3) #degree of non-seasonal differencing
par4 <- as.numeric(par4) #degree of seasonal differencing
par5 <- as.numeric(par5) #seasonal period
par6 <- as.numeric(par6) #p
par7 <- as.numeric(par7) #q
par8 <- as.numeric(par8) #P
par9 <- as.numeric(par9) #Q
if (par10 == 'TRUE') par10 <- TRUE
if (par10 == 'FALSE') par10 <- FALSE
if (par2 == 0) x <- log(x)
if (par2 != 0) x <- x^par2
lx <- length(x)
first <- lx - 2*par1
nx <- lx - par1
nx1 <- nx + 1
fx <- lx - nx
if (fx < 1) {
fx <- par5
nx1 <- lx + fx - 1
first <- lx - 2*fx
}
first <- 1
if (fx < 3) fx <- round(lx/10,0)
(arima.out <- arima(x[1:nx], order=c(par6,par3,par7), seasonal=list(order=c(par8,par4,par9), period=par5), include.mean=par10, method='ML'))
(forecast <- predict(arima.out,par1))
(lb <- forecast$pred - 1.96 * forecast$se)
(ub <- forecast$pred + 1.96 * forecast$se)
if (par2 == 0) {
x <- exp(x)
forecast$pred <- exp(forecast$pred)
lb <- exp(lb)
ub <- exp(ub)
}
if (par2 != 0) {
x <- x^(1/par2)
forecast$pred <- forecast$pred^(1/par2)
lb <- lb^(1/par2)
ub <- ub^(1/par2)
}
if (par2 < 0) {
olb <- lb
lb <- ub
ub <- olb
}
(actandfor <- c(x[1:nx], forecast$pred))
(perc.se <- (ub-forecast$pred)/1.96/forecast$pred)
bitmap(file='test1.png')
opar <- par(mar=c(4,4,2,2),las=1)
ylim <- c( min(x[first:nx],lb), max(x[first:nx],ub))
plot(x,ylim=ylim,type='n',xlim=c(first,lx))
usr <- par('usr')
rect(usr[1],usr[3],nx+1,usr[4],border=NA,col='lemonchiffon')
rect(nx1,usr[3],usr[2],usr[4],border=NA,col='lavender')
abline(h= (-3:3)*2 , col ='gray', lty =3)
polygon( c(nx1:lx,lx:nx1), c(lb,rev(ub)), col = 'orange', lty=2,border=NA)
lines(nx1:lx, lb , lty=2)
lines(nx1:lx, ub , lty=2)
lines(x, lwd=2)
lines(nx1:lx, forecast$pred , lwd=2 , col ='white')
box()
par(opar)
dev.off()
prob.dec <- array(NA, dim=fx)
prob.sdec <- array(NA, dim=fx)
prob.ldec <- array(NA, dim=fx)
prob.pval <- array(NA, dim=fx)
perf.pe <- array(0, dim=fx)
perf.spe <- array(0, dim=fx)
perf.scalederr <- array(0, dim=fx)
perf.mase <- array(0, dim=fx)
perf.mase1 <- array(0, dim=fx)
perf.mape <- array(0, dim=fx)
perf.smape <- array(0, dim=fx)
perf.mape1 <- array(0, dim=fx)
perf.smape1 <- array(0,dim=fx)
perf.se <- array(0, dim=fx)
perf.mse <- array(0, dim=fx)
perf.mse1 <- array(0, dim=fx)
perf.rmse <- array(0, dim=fx)
perf.scaleddenom <- 0
for (i in 2:fx) {
perf.scaleddenom = perf.scaleddenom + abs(x[nx+i] - x[nx+i-1])
}
perf.scaleddenom = perf.scaleddenom / (fx-1)
for (i in 1:fx) {
locSD <- (ub[i] - forecast$pred[i]) / 1.96
perf.scalederr[i] = (x[nx+i] - forecast$pred[i]) / perf.scaleddenom
perf.pe[i] = (x[nx+i] - forecast$pred[i]) / x[nx+i]
perf.spe[i] = 2*(x[nx+i] - forecast$pred[i]) / (x[nx+i] + forecast$pred[i])
perf.se[i] = (x[nx+i] - forecast$pred[i])^2
prob.dec[i] = pnorm((x[nx+i-1] - forecast$pred[i]) / locSD)
prob.sdec[i] = pnorm((x[nx+i-par5] - forecast$pred[i]) / locSD)
prob.ldec[i] = pnorm((x[nx] - forecast$pred[i]) / locSD)
prob.pval[i] = pnorm(abs(x[nx+i] - forecast$pred[i]) / locSD)
}
perf.mape[1] = abs(perf.pe[1])
perf.smape[1] = abs(perf.spe[1])
perf.mape1[1] = perf.mape[1]
perf.smape1[1] = perf.smape[1]
perf.mse[1] = perf.se[1]
perf.mase[1] = abs(perf.scalederr[1])
perf.mase1[1] = perf.mase[1]
for (i in 2:fx) {
perf.mape[i] = perf.mape[i-1] + abs(perf.pe[i])
perf.mape1[i] = perf.mape[i] / i
perf.smape[i] = perf.smape[i-1] + abs(perf.spe[i])
perf.smape1[i] = perf.smape[i] / i
perf.mse[i] = perf.mse[i-1] + perf.se[i]
perf.mse1[i] = perf.mse[i] / i
perf.mase[i] = perf.mase[i-1] + abs(perf.scalederr[i])
perf.mase1[i] = perf.mase[i] / i
}
perf.rmse = sqrt(perf.mse1)
bitmap(file='test2.png')
plot(forecast$pred, pch=19, type='b',main='ARIMA Extrapolation Forecast', ylab='Forecast and 95% CI', xlab='time',ylim=c(min(lb),max(ub)))
dum <- forecast$pred
dum[1:par1] <- x[(nx+1):lx]
lines(dum, lty=1)
lines(ub,lty=3)
lines(lb,lty=3)
dev.off()
load(file='createtable')
a<-table.start()
a<-table.row.start(a)
a<-table.element(a,'Univariate ARIMA Extrapolation Forecast',9,TRUE)
a<-table.row.end(a)
a<-table.row.start(a)
a<-table.element(a,'time',1,header=TRUE)
a<-table.element(a,'Y[t]',1,header=TRUE)
a<-table.element(a,'F[t]',1,header=TRUE)
a<-table.element(a,'95% LB',1,header=TRUE)
a<-table.element(a,'95% UB',1,header=TRUE)
a<-table.element(a,'p-value
(H0: Y[t] = F[t])',1,header=TRUE)
a<-table.element(a,'P(F[t]>Y[t-1])',1,header=TRUE)
a<-table.element(a,'P(F[t]>Y[t-s])',1,header=TRUE)
mylab <- paste('P(F[t]>Y[',nx,sep='')
mylab <- paste(mylab,'])',sep='')
a<-table.element(a,mylab,1,header=TRUE)
a<-table.row.end(a)
for (i in (nx-par5):nx) {
a<-table.row.start(a)
a<-table.element(a,i,header=TRUE)
a<-table.element(a,x[i])
a<-table.element(a,'-')
a<-table.row.end(a)
}
for (i in 1:fx) {
a<-table.row.start(a)
a<-table.element(a,nx+i,header=TRUE)
a<-table.element(a,round(x[nx+i],4))
a<-table.element(a,round(forecast$pred[i],4))
a<-table.element(a,round(lb[i],4))
a<-table.element(a,round(ub[i],4))
a<-table.element(a,round((1-prob.pval[i]),4))
a<-table.element(a,round((1-prob.dec[i]),4))
a<-table.element(a,round((1-prob.sdec[i]),4))
a<-table.element(a,round((1-prob.ldec[i]),4))
a<-table.row.end(a)
}
a<-table.end(a)
table.save(a,file='mytable.tab')
a<-table.start()
a<-table.row.start(a)
a<-table.element(a,'Univariate ARIMA Extrapolation Forecast Performance',10,TRUE)
a<-table.row.end(a)
a<-table.row.start(a)
a<-table.element(a,'time',1,header=TRUE)
a<-table.element(a,'% S.E.',1,header=TRUE)
a<-table.element(a,'PE',1,header=TRUE)
a<-table.element(a,'MAPE',1,header=TRUE)
a<-table.element(a,'sMAPE',1,header=TRUE)
a<-table.element(a,'Sq.E',1,header=TRUE)
a<-table.element(a,'MSE',1,header=TRUE)
a<-table.element(a,'RMSE',1,header=TRUE)
a<-table.element(a,'ScaledE',1,header=TRUE)
a<-table.element(a,'MASE',1,header=TRUE)
a<-table.row.end(a)
for (i in 1:fx) {
a<-table.row.start(a)
a<-table.element(a,nx+i,header=TRUE)
a<-table.element(a,round(perc.se[i],4))
a<-table.element(a,round(perf.pe[i],4))
a<-table.element(a,round(perf.mape1[i],4))
a<-table.element(a,round(perf.smape1[i],4))
a<-table.element(a,round(perf.se[i],4))
a<-table.element(a,round(perf.mse1[i],4))
a<-table.element(a,round(perf.rmse[i],4))
a<-table.element(a,round(perf.scalederr[i],4))
a<-table.element(a,round(perf.mase1[i],4))
a<-table.row.end(a)
}
a<-table.end(a)
table.save(a,file='mytable1.tab')