Free Statistics

of Irreproducible Research!

Author's title

Author*The author of this computation has been verified*
R Software Modulerwasp_twosampletests_mean.wasp
Title produced by softwarePaired and Unpaired Two Samples Tests about the Mean
Date of computationThu, 18 Dec 2014 12:01:40 +0000
Cite this page as followsStatistical Computations at FreeStatistics.org, Office for Research Development and Education, URL https://freestatistics.org/blog/index.php?v=date/2014/Dec/18/t1418905039l3lbfbluw0kcmdx.htm/, Retrieved Sun, 19 May 2024 18:20:13 +0000
Statistical Computations at FreeStatistics.org, Office for Research Development and Education, URL https://freestatistics.org/blog/index.php?pk=270849, Retrieved Sun, 19 May 2024 18:20:13 +0000
QR Codes:

Original text written by user:
IsPrivate?No (this computation is public)
User-defined keywords
Estimated Impact116
Family? (F = Feedback message, R = changed R code, M = changed R Module, P = changed Parameters, D = changed Data)
-       [Paired and Unpaired Two Samples Tests about the Mean] [] [2014-12-18 12:01:40] [00948489e79095d843a5e7d0a51f3696] [Current]
Feedback Forum

Post a new message
Dataseries X:
NA 18
NA 7
31 NA
NA 39
46 NA
31 NA
67 NA
NA 35
52 NA
77 NA
37 NA
32 NA
36 NA
38 NA
NA 69
NA 21
NA 26
54 NA
NA 36
42 NA
NA 23
34 NA
112 NA
NA 35
47 NA
47 NA
37 NA
109 NA
NA 24
20 NA
NA 22
NA 23
NA 32
7 NA
30 NA
92 NA
43 NA
55 NA
NA 16
49 NA
71 NA
NA 43
29 NA
56 NA
46 NA
19 NA
23 NA
NA 59
30 NA
61 NA
NA 7
38 NA
32 NA
16 NA
19 NA
22 NA
48 NA
23 NA
NA 26
33 NA
NA 9
24 NA
34 NA
NA 48
NA 18
43 NA
NA 33
28 NA
NA 71
26 NA
67 NA
NA 34
NA 80
NA 29
NA 16
59 NA
58 NA
NA 32
47 NA
NA 43
38 NA
NA 29
NA 36
32 NA
NA 35
NA 21
NA 29
12 NA
NA 37
37 NA
47 NA
NA 51
NA 32
NA 21
13 NA
14 NA
-2 NA
NA 20
24 NA
NA 11
23 NA
24 NA
14 NA
52 NA
15 NA
NA 23
19 NA
35 NA
24 NA
NA 39
NA 29
NA 13
NA 8
NA 18
NA 24
19 NA
22.56555556 NA
16.41472222 NA
33.3825 NA
31.6025 NA
NA 36.96916667
13.61 NA
51.62388889 NA
NA 75.25916667
71.99777778 NA
NA 14.96
NA 28.56638889
12.61611111 NA
40.04277778 NA
18.85388889 NA
23.93861111 NA
120.6683333 NA
93.31277778 NA
35.92777778 NA
23.28805556 NA
NA 85.22722222
40.79166667 NA
46.36555556 NA
18.22972222 NA
35.3275 NA
16.83055556 NA
3.585833333 NA
NA 28.13083333
44.04666667 NA
9.845 NA
37.73777778 NA
57.42638889 NA
22.93833333 NA
NA 25.59388889
NA 35.69694444
NA 22.08305556
40.14444444 NA
NA 18.18
NA 31.18805556
NA 11.47638889
37.92194444 NA
NA 24.2275
36.77277778 NA
36.81194444 NA
NA 22.07194444
14.94416667 NA
1.893611111 NA
43.25694444 NA
NA 30.76888889
NA 29.16083333
NA 45.08055556
NA 24.85666667
4.036388889 NA
NA 31.31666667
-3.818055556 NA
NA 66.33777778
61.31722222 NA
NA 31.84222222
31.40166667 NA
NA 39.25305556
NA 19.14055556
30.70916667 NA
NA 35.62861111
42.40888889 NA
20.63166667 NA
20.63166667 NA
24.88 NA
31.55611111 NA
NA 25.70361111
28.01111111 NA
NA 31.75583333
NA 41.02972222
NA 29.16111111
32.91 NA
NA 16.75527778
13.00861111 NA
NA 32.29111111
NA 29.70222222
NA 34.21527778
NA 59.21638889
12.92888889 NA
23.16277778 NA
10.40527778 NA
5.150555556 NA
NA 31.27722222
NA 19.32333333
31.69833333 NA
NA 30.48638889
NA 25.14305556
NA 48.47555556
NA 34.77194444
67.28166667 NA
15.245 NA
NA 22.45166667
NA 17.83222222
33.32416667 NA
NA 46.3975
23.83722222 NA
13.77194444 NA
23.18611111 NA
NA 11.84277778
38.21722222 NA
11.76138889 NA
28.34138889 NA
NA 40.84694444
NA 12.36694444
NA 31.105
33.35916667 NA
34.38055556 NA
NA 41.03138889
21.30944444 NA
19.74055556 NA
NA 44.33722222
NA 52.20944444
NA 6.740277778
29.30888889 NA
10.78361111 NA
NA 26.40666667
NA 23.60333333
NA 7.179722222
60.27833333 NA
12.84222222 NA
NA 20.37888889
NA 52.31583333
NA 28.28055556
25.31222222 NA
39.10944444 NA
9.040833333 NA
18.78444444 NA
NA 13.12972222
60.17222222 NA
19.14 NA
33.89555556 NA
NA 13.95805556
NA 16.59083333
45.1025 NA
NA 66.33777778
24.47666667 NA
48.28305556 NA
29.14722222 NA
NA -2.452222222
51.39916667 NA
NA 1.588888889
23.59138889 NA
39.81083333 NA
NA 19.58194444
18.73833333 NA
NA 16.43333333
19.64138889 NA
NA 40.1325
27.03277778 NA
NA 25.36333333
NA 48.6925
39.39777778 NA
61.31722222 NA
NA 19.37555556
67.26638889 NA
45.1025 NA
NA 30.18444444
7.915555556 NA
NA 19.48916667
NA 51.92583333
22.1425 NA
17.24083333 NA
NA 32.63333333
34.11888889 NA
NA 21.92333333
NA 29.59833333
24.94833333 NA
NA 37.68388889
NA 25.81805556
13.03722222 NA


Summary of computational transaction
Raw Inputview raw input (R code)
Raw Outputview raw output of R engine
Computing time2 seconds
R Server'Herman Ole Andreas Wold' @ wold.wessa.net

\begin{tabular}{lllllllll}
\hline
Summary of computational transaction \tabularnewline
Raw Input & view raw input (R code)  \tabularnewline
Raw Output & view raw output of R engine  \tabularnewline
Computing time & 2 seconds \tabularnewline
R Server & 'Herman Ole Andreas Wold' @ wold.wessa.net \tabularnewline
\hline
\end{tabular}
%Source: https://freestatistics.org/blog/index.php?pk=270849&T=0

[TABLE]
[ROW][C]Summary of computational transaction[/C][/ROW]
[ROW][C]Raw Input[/C][C]view raw input (R code) [/C][/ROW]
[ROW][C]Raw Output[/C][C]view raw output of R engine [/C][/ROW]
[ROW][C]Computing time[/C][C]2 seconds[/C][/ROW]
[ROW][C]R Server[/C][C]'Herman Ole Andreas Wold' @ wold.wessa.net[/C][/ROW]
[/TABLE]
Source: https://freestatistics.org/blog/index.php?pk=270849&T=0

Globally Unique Identifier (entire table): ba.freestatistics.org/blog/index.php?pk=270849&T=0

As an alternative you can also use a QR Code:  

The GUIDs for individual cells are displayed in the table below:

Summary of computational transaction
Raw Inputview raw input (R code)
Raw Outputview raw output of R engine
Computing time2 seconds
R Server'Herman Ole Andreas Wold' @ wold.wessa.net


Two Sample t-test (unpaired)
Mean of Sample 133.956322426638
Mean of Sample 230.3680600357823
t-stat1.60367613085914
df285
p-value0.109893058245938
H0 value0
Alternativetwo.sided
CI Level0.95
CI[-0.81590490552699,7.99242968723855]
F-test to compare two variances
F-stat1.70051223752422
df162
p-value0.00213032279729042
H0 value1
Alternativetwo.sided
CI Level0.95
CI[1.21436839699696,2.36306459386322]

\begin{tabular}{lllllllll}
\hline
Two Sample t-test (unpaired) \tabularnewline
Mean of Sample 1 & 33.956322426638 \tabularnewline
Mean of Sample 2 & 30.3680600357823 \tabularnewline
t-stat & 1.60367613085914 \tabularnewline
df & 285 \tabularnewline
p-value & 0.109893058245938 \tabularnewline
H0 value & 0 \tabularnewline
Alternative & two.sided \tabularnewline
CI Level & 0.95 \tabularnewline
CI & [-0.81590490552699,7.99242968723855] \tabularnewline
F-test to compare two variances \tabularnewline
F-stat & 1.70051223752422 \tabularnewline
df & 162 \tabularnewline
p-value & 0.00213032279729042 \tabularnewline
H0 value & 1 \tabularnewline
Alternative & two.sided \tabularnewline
CI Level & 0.95 \tabularnewline
CI & [1.21436839699696,2.36306459386322] \tabularnewline
\hline
\end{tabular}
%Source: https://freestatistics.org/blog/index.php?pk=270849&T=1

[TABLE]
[ROW][C]Two Sample t-test (unpaired)[/C][/ROW]
[ROW][C]Mean of Sample 1[/C][C]33.956322426638[/C][/ROW]
[ROW][C]Mean of Sample 2[/C][C]30.3680600357823[/C][/ROW]
[ROW][C]t-stat[/C][C]1.60367613085914[/C][/ROW]
[ROW][C]df[/C][C]285[/C][/ROW]
[ROW][C]p-value[/C][C]0.109893058245938[/C][/ROW]
[ROW][C]H0 value[/C][C]0[/C][/ROW]
[ROW][C]Alternative[/C][C]two.sided[/C][/ROW]
[ROW][C]CI Level[/C][C]0.95[/C][/ROW]
[ROW][C]CI[/C][C][-0.81590490552699,7.99242968723855][/C][/ROW]
[ROW][C]F-test to compare two variances[/C][/ROW]
[ROW][C]F-stat[/C][C]1.70051223752422[/C][/ROW]
[ROW][C]df[/C][C]162[/C][/ROW]
[ROW][C]p-value[/C][C]0.00213032279729042[/C][/ROW]
[ROW][C]H0 value[/C][C]1[/C][/ROW]
[ROW][C]Alternative[/C][C]two.sided[/C][/ROW]
[ROW][C]CI Level[/C][C]0.95[/C][/ROW]
[ROW][C]CI[/C][C][1.21436839699696,2.36306459386322][/C][/ROW]
[/TABLE]
Source: https://freestatistics.org/blog/index.php?pk=270849&T=1

Globally Unique Identifier (entire table): ba.freestatistics.org/blog/index.php?pk=270849&T=1

As an alternative you can also use a QR Code:  

The GUIDs for individual cells are displayed in the table below:

Two Sample t-test (unpaired)
Mean of Sample 133.956322426638
Mean of Sample 230.3680600357823
t-stat1.60367613085914
df285
p-value0.109893058245938
H0 value0
Alternativetwo.sided
CI Level0.95
CI[-0.81590490552699,7.99242968723855]
F-test to compare two variances
F-stat1.70051223752422
df162
p-value0.00213032279729042
H0 value1
Alternativetwo.sided
CI Level0.95
CI[1.21436839699696,2.36306459386322]


Welch Two Sample t-test (unpaired)
Mean of Sample 133.956322426638
Mean of Sample 230.3680600357823
t-stat1.66143566653724
df284.977417771979
p-value0.0977256330937804
H0 value0
Alternativetwo.sided
CI Level0.95
CI[-0.662796195654486,7.83932097736605]

\begin{tabular}{lllllllll}
\hline
Welch Two Sample t-test (unpaired) \tabularnewline
Mean of Sample 1 & 33.956322426638 \tabularnewline
Mean of Sample 2 & 30.3680600357823 \tabularnewline
t-stat & 1.66143566653724 \tabularnewline
df & 284.977417771979 \tabularnewline
p-value & 0.0977256330937804 \tabularnewline
H0 value & 0 \tabularnewline
Alternative & two.sided \tabularnewline
CI Level & 0.95 \tabularnewline
CI & [-0.662796195654486,7.83932097736605] \tabularnewline
\hline
\end{tabular}
%Source: https://freestatistics.org/blog/index.php?pk=270849&T=2

[TABLE]
[ROW][C]Welch Two Sample t-test (unpaired)[/C][/ROW]
[ROW][C]Mean of Sample 1[/C][C]33.956322426638[/C][/ROW]
[ROW][C]Mean of Sample 2[/C][C]30.3680600357823[/C][/ROW]
[ROW][C]t-stat[/C][C]1.66143566653724[/C][/ROW]
[ROW][C]df[/C][C]284.977417771979[/C][/ROW]
[ROW][C]p-value[/C][C]0.0977256330937804[/C][/ROW]
[ROW][C]H0 value[/C][C]0[/C][/ROW]
[ROW][C]Alternative[/C][C]two.sided[/C][/ROW]
[ROW][C]CI Level[/C][C]0.95[/C][/ROW]
[ROW][C]CI[/C][C][-0.662796195654486,7.83932097736605][/C][/ROW]
[/TABLE]
Source: https://freestatistics.org/blog/index.php?pk=270849&T=2

Globally Unique Identifier (entire table): ba.freestatistics.org/blog/index.php?pk=270849&T=2

As an alternative you can also use a QR Code:  

The GUIDs for individual cells are displayed in the table below:

Welch Two Sample t-test (unpaired)
Mean of Sample 133.956322426638
Mean of Sample 230.3680600357823
t-stat1.66143566653724
df284.977417771979
p-value0.0977256330937804
H0 value0
Alternativetwo.sided
CI Level0.95
CI[-0.662796195654486,7.83932097736605]


Wicoxon rank sum test with continuity correction (unpaired)
W10988.5
p-value0.205370100072804
H0 value0
Alternativetwo.sided
Kolmogorov-Smirnov Test to compare Distributions of two Samples
KS Statistic0.130368098159509
p-value0.182413220856091
Kolmogorov-Smirnov Test to compare Distributional Shape of two Samples
KS Statistic0.126509004551751
p-value0.20966376685999

\begin{tabular}{lllllllll}
\hline
Wicoxon rank sum test with continuity correction (unpaired) \tabularnewline
W & 10988.5 \tabularnewline
p-value & 0.205370100072804 \tabularnewline
H0 value & 0 \tabularnewline
Alternative & two.sided \tabularnewline
Kolmogorov-Smirnov Test to compare Distributions of two Samples \tabularnewline
KS Statistic & 0.130368098159509 \tabularnewline
p-value & 0.182413220856091 \tabularnewline
Kolmogorov-Smirnov Test to compare Distributional Shape of two Samples \tabularnewline
KS Statistic & 0.126509004551751 \tabularnewline
p-value & 0.20966376685999 \tabularnewline
\hline
\end{tabular}
%Source: https://freestatistics.org/blog/index.php?pk=270849&T=3

[TABLE]
[ROW][C]Wicoxon rank sum test with continuity correction (unpaired)[/C][/ROW]
[ROW][C]W[/C][C]10988.5[/C][/ROW]
[ROW][C]p-value[/C][C]0.205370100072804[/C][/ROW]
[ROW][C]H0 value[/C][C]0[/C][/ROW]
[ROW][C]Alternative[/C][C]two.sided[/C][/ROW]
[ROW][C]Kolmogorov-Smirnov Test to compare Distributions of two Samples[/C][/ROW]
[ROW][C]KS Statistic[/C][C]0.130368098159509[/C][/ROW]
[ROW][C]p-value[/C][C]0.182413220856091[/C][/ROW]
[ROW][C]Kolmogorov-Smirnov Test to compare Distributional Shape of two Samples[/C][/ROW]
[ROW][C]KS Statistic[/C][C]0.126509004551751[/C][/ROW]
[ROW][C]p-value[/C][C]0.20966376685999[/C][/ROW]
[/TABLE]
Source: https://freestatistics.org/blog/index.php?pk=270849&T=3

Globally Unique Identifier (entire table): ba.freestatistics.org/blog/index.php?pk=270849&T=3

As an alternative you can also use a QR Code:  

The GUIDs for individual cells are displayed in the table below:

Wicoxon rank sum test with continuity correction (unpaired)
W10988.5
p-value0.205370100072804
H0 value0
Alternativetwo.sided
Kolmogorov-Smirnov Test to compare Distributions of two Samples
KS Statistic0.130368098159509
p-value0.182413220856091
Kolmogorov-Smirnov Test to compare Distributional Shape of two Samples
KS Statistic0.126509004551751
p-value0.20966376685999


Parameters (Session):
par1 = 1 ; par2 = 2 ; par3 = 0.95 ; par4 = two.sided ; par5 = unpaired ; par6 = 0 ;
Parameters (R input):
par1 = 1 ; par2 = 2 ; par3 = 0.95 ; par4 = two.sided ; par5 = unpaired ; par6 = 0 ;
R code (references can be found in the software module):
par6 <- '0'
par5 <- 'paired'
par4 <- 'two.sided'
par3 <- '0.95'
par2 <- '2'
par1 <- '1'
par1 <- as.numeric(par1) #column number of first sample
par2 <- as.numeric(par2) #column number of second sample
par3 <- as.numeric(par3) #confidence (= 1 - alpha)
if (par5 == 'unpaired') paired <- FALSE else paired <- TRUE
par6 <- as.numeric(par6) #H0
z <- t(y)
if (par1 == par2) stop('Please, select two different column numbers')
if (par1 < 1) stop('Please, select a column number greater than zero for the first sample')
if (par2 < 1) stop('Please, select a column number greater than zero for the second sample')
if (par1 > length(z[1,])) stop('The column number for the first sample should be smaller')
if (par2 > length(z[1,])) stop('The column number for the second sample should be smaller')
if (par3 <= 0) stop('The confidence level should be larger than zero')
if (par3 >= 1) stop('The confidence level should be smaller than zero')
(r.t <- t.test(z[,par1],z[,par2],var.equal=TRUE,alternative=par4,paired=paired,mu=par6,conf.level=par3))
(v.t <- var.test(z[,par1],z[,par2],conf.level=par3))
(r.w <- t.test(z[,par1],z[,par2],var.equal=FALSE,alternative=par4,paired=paired,mu=par6,conf.level=par3))
(w.t <- wilcox.test(z[,par1],z[,par2],alternative=par4,paired=paired,mu=par6,conf.level=par3))
(ks.t <- ks.test(z[,par1],z[,par2],alternative=par4))
m1 <- mean(z[,par1],na.rm=T)
m2 <- mean(z[,par2],na.rm=T)
mdiff <- m1 - m2
newsam1 <- z[!is.na(z[,par1]),par1]
newsam2 <- z[,par2]+mdiff
newsam2 <- newsam2[!is.na(newsam2)]
(ks1.t <- ks.test(newsam1,newsam2,alternative=par4))
mydf <- data.frame(cbind(z[,par1],z[,par2]))
colnames(mydf) <- c('Variable 1','Variable 2')
bitmap(file='test1.png')
boxplot(mydf, notch=TRUE, ylab='value',main=main)
dev.off()
bitmap(file='test2.png')
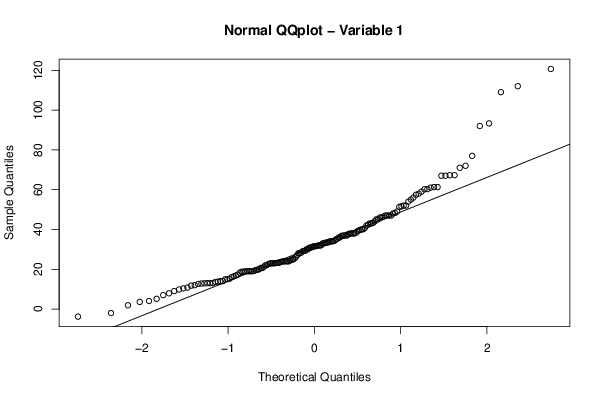
qqnorm(z[,par1],main='Normal QQplot - Variable 1')
qqline(z[,par1])
dev.off()
bitmap(file='test3.png')
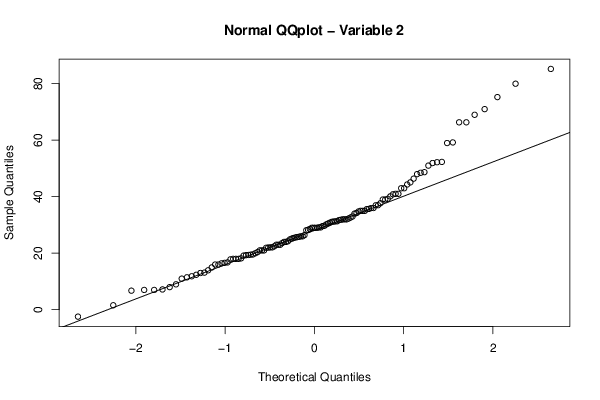
qqnorm(z[,par2],main='Normal QQplot - Variable 2')
qqline(z[,par2])
dev.off()
load(file='createtable')
a<-table.start()
a<-table.row.start(a)
a<-table.element(a,paste('Two Sample t-test (',par5,')',sep=''),2,TRUE)
a<-table.row.end(a)
if(!paired){
a<-table.row.start(a)
a<-table.element(a,'Mean of Sample 1',header=TRUE)
a<-table.element(a,r.t$estimate[[1]])
a<-table.row.end(a)
a<-table.row.start(a)
a<-table.element(a,'Mean of Sample 2',header=TRUE)
a<-table.element(a,r.t$estimate[[2]])
a<-table.row.end(a)
} else {
a<-table.row.start(a)
a<-table.element(a,'Difference: Mean1 - Mean2',header=TRUE)
a<-table.element(a,r.t$estimate)
a<-table.row.end(a)
}
a<-table.row.start(a)
a<-table.element(a,'t-stat',header=TRUE)
a<-table.element(a,r.t$statistic[[1]])
a<-table.row.end(a)
a<-table.row.start(a)
a<-table.element(a,'df',header=TRUE)
a<-table.element(a,r.t$parameter[[1]])
a<-table.row.end(a)
a<-table.row.start(a)
a<-table.element(a,'p-value',header=TRUE)
a<-table.element(a,r.t$p.value)
a<-table.row.end(a)
a<-table.row.start(a)
a<-table.element(a,'H0 value',header=TRUE)
a<-table.element(a,r.t$null.value[[1]])
a<-table.row.end(a)
a<-table.row.start(a)
a<-table.element(a,'Alternative',header=TRUE)
a<-table.element(a,r.t$alternative)
a<-table.row.end(a)
a<-table.row.start(a)
a<-table.element(a,'CI Level',header=TRUE)
a<-table.element(a,attr(r.t$conf.int,'conf.level'))
a<-table.row.end(a)
a<-table.row.start(a)
a<-table.element(a,'CI',header=TRUE)
a<-table.element(a,paste('[',r.t$conf.int[1],',',r.t$conf.int[2],']',sep=''))
a<-table.row.end(a)
a<-table.row.start(a)
a<-table.element(a,'F-test to compare two variances',2,TRUE)
a<-table.row.end(a)
a<-table.row.start(a)
a<-table.element(a,'F-stat',header=TRUE)
a<-table.element(a,v.t$statistic[[1]])
a<-table.row.end(a)
a<-table.row.start(a)
a<-table.element(a,'df',header=TRUE)
a<-table.element(a,v.t$parameter[[1]])
a<-table.row.end(a)
a<-table.row.start(a)
a<-table.element(a,'p-value',header=TRUE)
a<-table.element(a,v.t$p.value)
a<-table.row.end(a)
a<-table.row.start(a)
a<-table.element(a,'H0 value',header=TRUE)
a<-table.element(a,v.t$null.value[[1]])
a<-table.row.end(a)
a<-table.row.start(a)
a<-table.element(a,'Alternative',header=TRUE)
a<-table.element(a,v.t$alternative)
a<-table.row.end(a)
a<-table.row.start(a)
a<-table.element(a,'CI Level',header=TRUE)
a<-table.element(a,attr(v.t$conf.int,'conf.level'))
a<-table.row.end(a)
a<-table.row.start(a)
a<-table.element(a,'CI',header=TRUE)
a<-table.element(a,paste('[',v.t$conf.int[1],',',v.t$conf.int[2],']',sep=''))
a<-table.row.end(a)
a<-table.end(a)
table.save(a,file='mytable.tab')
a<-table.start()
a<-table.row.start(a)
a<-table.element(a,paste('Welch Two Sample t-test (',par5,')',sep=''),2,TRUE)
a<-table.row.end(a)
if(!paired){
a<-table.row.start(a)
a<-table.element(a,'Mean of Sample 1',header=TRUE)
a<-table.element(a,r.w$estimate[[1]])
a<-table.row.end(a)
a<-table.row.start(a)
a<-table.element(a,'Mean of Sample 2',header=TRUE)
a<-table.element(a,r.w$estimate[[2]])
a<-table.row.end(a)
} else {
a<-table.row.start(a)
a<-table.element(a,'Difference: Mean1 - Mean2',header=TRUE)
a<-table.element(a,r.w$estimate)
a<-table.row.end(a)
}
a<-table.row.start(a)
a<-table.element(a,'t-stat',header=TRUE)
a<-table.element(a,r.w$statistic[[1]])
a<-table.row.end(a)
a<-table.row.start(a)
a<-table.element(a,'df',header=TRUE)
a<-table.element(a,r.w$parameter[[1]])
a<-table.row.end(a)
a<-table.row.start(a)
a<-table.element(a,'p-value',header=TRUE)
a<-table.element(a,r.w$p.value)
a<-table.row.end(a)
a<-table.row.start(a)
a<-table.element(a,'H0 value',header=TRUE)
a<-table.element(a,r.w$null.value[[1]])
a<-table.row.end(a)
a<-table.row.start(a)
a<-table.element(a,'Alternative',header=TRUE)
a<-table.element(a,r.w$alternative)
a<-table.row.end(a)
a<-table.row.start(a)
a<-table.element(a,'CI Level',header=TRUE)
a<-table.element(a,attr(r.w$conf.int,'conf.level'))
a<-table.row.end(a)
a<-table.row.start(a)
a<-table.element(a,'CI',header=TRUE)
a<-table.element(a,paste('[',r.w$conf.int[1],',',r.w$conf.int[2],']',sep=''))
a<-table.row.end(a)
a<-table.end(a)
table.save(a,file='mytable1.tab')
a<-table.start()
a<-table.row.start(a)
a<-table.element(a,paste('Wicoxon rank sum test with continuity correction (',par5,')',sep=''),2,TRUE)
a<-table.row.end(a)
a<-table.row.start(a)
a<-table.element(a,'W',header=TRUE)
a<-table.element(a,w.t$statistic[[1]])
a<-table.row.end(a)
a<-table.row.start(a)
a<-table.element(a,'p-value',header=TRUE)
a<-table.element(a,w.t$p.value)
a<-table.row.end(a)
a<-table.row.start(a)
a<-table.element(a,'H0 value',header=TRUE)
a<-table.element(a,w.t$null.value[[1]])
a<-table.row.end(a)
a<-table.row.start(a)
a<-table.element(a,'Alternative',header=TRUE)
a<-table.element(a,w.t$alternative)
a<-table.row.end(a)
a<-table.row.start(a)
a<-table.element(a,'Kolmogorov-Smirnov Test to compare Distributions of two Samples',2,TRUE)
a<-table.row.end(a)
a<-table.row.start(a)
a<-table.element(a,'KS Statistic',header=TRUE)
a<-table.element(a,ks.t$statistic[[1]])
a<-table.row.end(a)
a<-table.row.start(a)
a<-table.element(a,'p-value',header=TRUE)
a<-table.element(a,ks.t$p.value)
a<-table.row.end(a)
a<-table.row.start(a)
a<-table.element(a,'Kolmogorov-Smirnov Test to compare Distributional Shape of two Samples',2,TRUE)
a<-table.row.end(a)
a<-table.row.start(a)
a<-table.element(a,'KS Statistic',header=TRUE)
a<-table.element(a,ks1.t$statistic[[1]])
a<-table.row.end(a)
a<-table.row.start(a)
a<-table.element(a,'p-value',header=TRUE)
a<-table.element(a,ks1.t$p.value)
a<-table.row.end(a)
a<-table.end(a)
table.save(a,file='mytable2.tab')