Free Statistics

of Irreproducible Research!

Author's title

Author*The author of this computation has been verified*
R Software Modulerwasp_multipleregression.wasp
Title produced by softwareMultiple Regression
Date of computationWed, 17 Dec 2014 19:01:00 +0000
Cite this page as followsStatistical Computations at FreeStatistics.org, Office for Research Development and Education, URL https://freestatistics.org/blog/index.php?v=date/2014/Dec/17/t1418843079db3b8ty3ioonh6t.htm/, Retrieved Sun, 19 May 2024 19:48:56 +0000
Statistical Computations at FreeStatistics.org, Office for Research Development and Education, URL https://freestatistics.org/blog/index.php?pk=270582, Retrieved Sun, 19 May 2024 19:48:56 +0000
QR Codes:

Original text written by user:
IsPrivate?No (this computation is public)
User-defined keywords
Estimated Impact34
Family? (F = Feedback message, R = changed R code, M = changed R Module, P = changed Parameters, D = changed Data)
-       [Multiple Regression] [] [2014-12-17 19:01:00] [4897fbbb7461c8caec7645a3718e7cbe] [Current]
Feedback Forum

Post a new message
Dataseries X:
7.5 12 13 0
6.5 11 11 0
1.0 13 14 1
1.0 11 15 1
5.5 10 14 1
8.5 7 11 0
6.5 10 13 1
4.5 15 16 1
2.0 12 14 1
5.0 12 14 1
0.5 10 15 1
5.0 14 13 0
2.5 6 14 0
5.0 12 11 0
5.5 14 12 1
3.5 11 14 0
4.0 12 12 0
6.5 13 15 1
4.5 11 14 0
5.5 7 12 1
4.0 11 12 1
7.5 7 12 1
4.0 12 14 1
5.5 13 16 0
2.5 9 12 0
5.5 11 12 0
3.5 12 14 1
4.5 12 15 1
4.5 5 14 0
6.0 13 13 1
5.0 6 16 0
6.5 6 15 1
5.0 12 13 1
6.0 11 16 1
4.5 6 16 0
5.0 11 15 1
5.0 12 13 1
6.5 13 12 1
7.0 14 14 1
4.5 12 14 1
8.5 14 10 1
3.5 11 16 1
6.0 10 14 0
1.5 7 14 0
3.5 7 15 0
7.5 10 16 1
5.0 12 15 0
6.5 5 13 0
6.5 10 12 0
6.5 12 12 1
7.0 11 14 0
1.5 12 15 1
4.0 11 11 0
4.5 12 14 0
0.0 10 16 1
3.5 9 13 0
4.5 7 11 0
0.0 9 12 1
3.0 10 12 0
3.5 12 14 0
3.0 14 12 1
1.0 9 13 0


Summary of computational transaction
Raw Inputview raw input (R code)
Raw Outputview raw output of R engine
Computing time5 seconds
R Server'Sir Ronald Aylmer Fisher' @ fisher.wessa.net

\begin{tabular}{lllllllll}
\hline
Summary of computational transaction \tabularnewline
Raw Input & view raw input (R code)  \tabularnewline
Raw Output & view raw output of R engine  \tabularnewline
Computing time & 5 seconds \tabularnewline
R Server & 'Sir Ronald Aylmer Fisher' @ fisher.wessa.net \tabularnewline
\hline
\end{tabular}
%Source: https://freestatistics.org/blog/index.php?pk=270582&T=0

[TABLE]
[ROW][C]Summary of computational transaction[/C][/ROW]
[ROW][C]Raw Input[/C][C]view raw input (R code) [/C][/ROW]
[ROW][C]Raw Output[/C][C]view raw output of R engine [/C][/ROW]
[ROW][C]Computing time[/C][C]5 seconds[/C][/ROW]
[ROW][C]R Server[/C][C]'Sir Ronald Aylmer Fisher' @ fisher.wessa.net[/C][/ROW]
[/TABLE]
Source: https://freestatistics.org/blog/index.php?pk=270582&T=0

Globally Unique Identifier (entire table): ba.freestatistics.org/blog/index.php?pk=270582&T=0

As an alternative you can also use a QR Code:  

The GUIDs for individual cells are displayed in the table below:

Summary of computational transaction
Raw Inputview raw input (R code)
Raw Outputview raw output of R engine
Computing time5 seconds
R Server'Sir Ronald Aylmer Fisher' @ fisher.wessa.net


Multiple Linear Regression - Estimated Regression Equation
Ex[t] = + 8.21483 + 0.0441423CONFSOFTTOT[t] -0.302088STRESSTOT[t] -0.0388239gender[t] + e[t]

\begin{tabular}{lllllllll}
\hline
Multiple Linear Regression - Estimated Regression Equation \tabularnewline
Ex[t] =  +  8.21483 +  0.0441423CONFSOFTTOT[t] -0.302088STRESSTOT[t] -0.0388239gender[t]  + e[t] \tabularnewline
\hline
\end{tabular}
%Source: https://freestatistics.org/blog/index.php?pk=270582&T=1

[TABLE]
[ROW][C]Multiple Linear Regression - Estimated Regression Equation[/C][/ROW]
[ROW][C]Ex[t] =  +  8.21483 +  0.0441423CONFSOFTTOT[t] -0.302088STRESSTOT[t] -0.0388239gender[t]  + e[t][/C][/ROW]
[/TABLE]
Source: https://freestatistics.org/blog/index.php?pk=270582&T=1

Globally Unique Identifier (entire table): ba.freestatistics.org/blog/index.php?pk=270582&T=1

As an alternative you can also use a QR Code:  

The GUIDs for individual cells are displayed in the table below:

Multiple Linear Regression - Estimated Regression Equation
Ex[t] = + 8.21483 + 0.0441423CONFSOFTTOT[t] -0.302088STRESSTOT[t] -0.0388239gender[t] + e[t]


Multiple Linear Regression - Ordinary Least Squares
VariableParameterS.D.T-STATH0: parameter = 02-tail p-value1-tail p-value
(Intercept)8.214832.636353.1160.002849690.00142485
CONFSOFTTOT0.04414230.1133880.38930.6984780.349239
STRESSTOT-0.3020880.169883-1.7780.08061150.0403058
gender-0.03882390.568938-0.068240.945830.472915

\begin{tabular}{lllllllll}
\hline
Multiple Linear Regression - Ordinary Least Squares \tabularnewline
Variable & Parameter & S.D. & T-STATH0: parameter = 0 & 2-tail p-value & 1-tail p-value \tabularnewline
(Intercept) & 8.21483 & 2.63635 & 3.116 & 0.00284969 & 0.00142485 \tabularnewline
CONFSOFTTOT & 0.0441423 & 0.113388 & 0.3893 & 0.698478 & 0.349239 \tabularnewline
STRESSTOT & -0.302088 & 0.169883 & -1.778 & 0.0806115 & 0.0403058 \tabularnewline
gender & -0.0388239 & 0.568938 & -0.06824 & 0.94583 & 0.472915 \tabularnewline
\hline
\end{tabular}
%Source: https://freestatistics.org/blog/index.php?pk=270582&T=2

[TABLE]
[ROW][C]Multiple Linear Regression - Ordinary Least Squares[/C][/ROW]
[ROW][C]Variable[/C][C]Parameter[/C][C]S.D.[/C][C]T-STATH0: parameter = 0[/C][C]2-tail p-value[/C][C]1-tail p-value[/C][/ROW]
[ROW][C](Intercept)[/C][C]8.21483[/C][C]2.63635[/C][C]3.116[/C][C]0.00284969[/C][C]0.00142485[/C][/ROW]
[ROW][C]CONFSOFTTOT[/C][C]0.0441423[/C][C]0.113388[/C][C]0.3893[/C][C]0.698478[/C][C]0.349239[/C][/ROW]
[ROW][C]STRESSTOT[/C][C]-0.302088[/C][C]0.169883[/C][C]-1.778[/C][C]0.0806115[/C][C]0.0403058[/C][/ROW]
[ROW][C]gender[/C][C]-0.0388239[/C][C]0.568938[/C][C]-0.06824[/C][C]0.94583[/C][C]0.472915[/C][/ROW]
[/TABLE]
Source: https://freestatistics.org/blog/index.php?pk=270582&T=2

Globally Unique Identifier (entire table): ba.freestatistics.org/blog/index.php?pk=270582&T=2

As an alternative you can also use a QR Code:  

The GUIDs for individual cells are displayed in the table below:

Multiple Linear Regression - Ordinary Least Squares
VariableParameterS.D.T-STATH0: parameter = 02-tail p-value1-tail p-value
(Intercept)8.214832.636353.1160.002849690.00142485
CONFSOFTTOT0.04414230.1133880.38930.6984780.349239
STRESSTOT-0.3020880.169883-1.7780.08061150.0403058
gender-0.03882390.568938-0.068240.945830.472915


Multiple Linear Regression - Regression Statistics
Multiple R0.241038
R-squared0.0580994
Adjusted R-squared0.00938039
F-TEST (value)1.19254
F-TEST (DF numerator)3
F-TEST (DF denominator)58
p-value0.320608
Multiple Linear Regression - Residual Statistics
Residual Standard Deviation2.03067
Sum Squared Residuals239.171

\begin{tabular}{lllllllll}
\hline
Multiple Linear Regression - Regression Statistics \tabularnewline
Multiple R & 0.241038 \tabularnewline
R-squared & 0.0580994 \tabularnewline
Adjusted R-squared & 0.00938039 \tabularnewline
F-TEST (value) & 1.19254 \tabularnewline
F-TEST (DF numerator) & 3 \tabularnewline
F-TEST (DF denominator) & 58 \tabularnewline
p-value & 0.320608 \tabularnewline
Multiple Linear Regression - Residual Statistics \tabularnewline
Residual Standard Deviation & 2.03067 \tabularnewline
Sum Squared Residuals & 239.171 \tabularnewline
\hline
\end{tabular}
%Source: https://freestatistics.org/blog/index.php?pk=270582&T=3

[TABLE]
[ROW][C]Multiple Linear Regression - Regression Statistics[/C][/ROW]
[ROW][C]Multiple R[/C][C]0.241038[/C][/ROW]
[ROW][C]R-squared[/C][C]0.0580994[/C][/ROW]
[ROW][C]Adjusted R-squared[/C][C]0.00938039[/C][/ROW]
[ROW][C]F-TEST (value)[/C][C]1.19254[/C][/ROW]
[ROW][C]F-TEST (DF numerator)[/C][C]3[/C][/ROW]
[ROW][C]F-TEST (DF denominator)[/C][C]58[/C][/ROW]
[ROW][C]p-value[/C][C]0.320608[/C][/ROW]
[ROW][C]Multiple Linear Regression - Residual Statistics[/C][/ROW]
[ROW][C]Residual Standard Deviation[/C][C]2.03067[/C][/ROW]
[ROW][C]Sum Squared Residuals[/C][C]239.171[/C][/ROW]
[/TABLE]
Source: https://freestatistics.org/blog/index.php?pk=270582&T=3

Globally Unique Identifier (entire table): ba.freestatistics.org/blog/index.php?pk=270582&T=3

As an alternative you can also use a QR Code:  

The GUIDs for individual cells are displayed in the table below:

Multiple Linear Regression - Regression Statistics
Multiple R0.241038
R-squared0.0580994
Adjusted R-squared0.00938039
F-TEST (value)1.19254
F-TEST (DF numerator)3
F-TEST (DF denominator)58
p-value0.320608
Multiple Linear Regression - Residual Statistics
Residual Standard Deviation2.03067
Sum Squared Residuals239.171


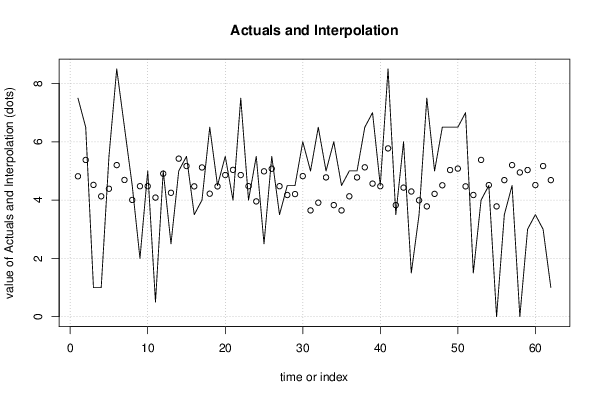
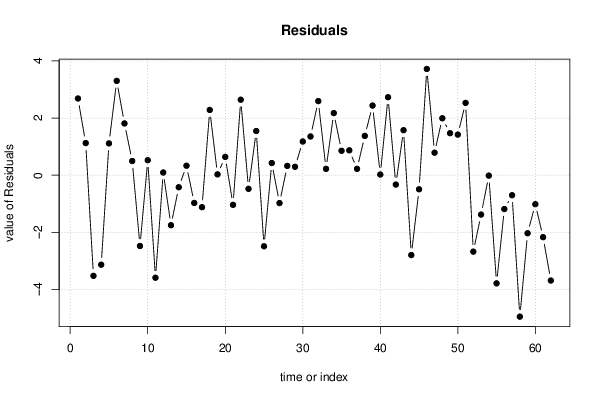
Multiple Linear Regression - Actuals, Interpolation, and Residuals
Time or IndexActualsInterpolationForecastResidualsPrediction Error
17.54.81742.6826
26.55.377431.12257
314.52063-3.52063
414.13026-3.13026
55.54.38821.1118
68.55.200863.29914
76.54.690291.80971
84.54.004740.495261
924.47649-2.47649
1054.476490.523512
110.54.08612-3.58612
1254.905680.0943161
132.54.25046-1.75046
1455.42157-0.421575
155.55.168950.331052
163.54.47117-0.971169
1745.11949-1.11949
186.54.218542.28146
194.54.471170.0288308
205.54.859950.640049
2145.03652-1.03652
227.54.859952.64005
2344.47649-0.476488
245.53.955281.54472
252.54.98706-2.48706
265.55.075340.424655
273.54.47649-0.976488
284.54.17440.3256
294.54.206320.293685
3064.822721.17728
3153.646281.35372
326.53.909552.59045
3354.778580.221425
3463.828172.17183
354.53.646280.853718
3654.130260.869742
3754.778580.221425
386.55.124811.37519
3974.564772.43523
404.54.476490.0235124
418.55.773122.72688
423.53.82817-0.32817
4364.427031.57297
441.54.2946-2.7946
453.53.99251-0.492512
467.53.784033.71597
4754.213220.786776
486.54.50841.9916
496.55.03121.4688
506.55.080661.41934
5174.471172.52883
521.54.1744-2.6744
5345.37743-1.37743
544.54.51531-0.0153115
5503.78403-3.78403
563.54.68497-1.18497
574.55.20086-0.700863
5804.94824-4.94824
5935.0312-2.0312
603.54.51531-1.01531
6135.16895-2.16895
6214.68497-3.68497

\begin{tabular}{lllllllll}
\hline
Multiple Linear Regression - Actuals, Interpolation, and Residuals \tabularnewline
Time or Index & Actuals & InterpolationForecast & ResidualsPrediction Error \tabularnewline
1 & 7.5 & 4.8174 & 2.6826 \tabularnewline
2 & 6.5 & 5.37743 & 1.12257 \tabularnewline
3 & 1 & 4.52063 & -3.52063 \tabularnewline
4 & 1 & 4.13026 & -3.13026 \tabularnewline
5 & 5.5 & 4.3882 & 1.1118 \tabularnewline
6 & 8.5 & 5.20086 & 3.29914 \tabularnewline
7 & 6.5 & 4.69029 & 1.80971 \tabularnewline
8 & 4.5 & 4.00474 & 0.495261 \tabularnewline
9 & 2 & 4.47649 & -2.47649 \tabularnewline
10 & 5 & 4.47649 & 0.523512 \tabularnewline
11 & 0.5 & 4.08612 & -3.58612 \tabularnewline
12 & 5 & 4.90568 & 0.0943161 \tabularnewline
13 & 2.5 & 4.25046 & -1.75046 \tabularnewline
14 & 5 & 5.42157 & -0.421575 \tabularnewline
15 & 5.5 & 5.16895 & 0.331052 \tabularnewline
16 & 3.5 & 4.47117 & -0.971169 \tabularnewline
17 & 4 & 5.11949 & -1.11949 \tabularnewline
18 & 6.5 & 4.21854 & 2.28146 \tabularnewline
19 & 4.5 & 4.47117 & 0.0288308 \tabularnewline
20 & 5.5 & 4.85995 & 0.640049 \tabularnewline
21 & 4 & 5.03652 & -1.03652 \tabularnewline
22 & 7.5 & 4.85995 & 2.64005 \tabularnewline
23 & 4 & 4.47649 & -0.476488 \tabularnewline
24 & 5.5 & 3.95528 & 1.54472 \tabularnewline
25 & 2.5 & 4.98706 & -2.48706 \tabularnewline
26 & 5.5 & 5.07534 & 0.424655 \tabularnewline
27 & 3.5 & 4.47649 & -0.976488 \tabularnewline
28 & 4.5 & 4.1744 & 0.3256 \tabularnewline
29 & 4.5 & 4.20632 & 0.293685 \tabularnewline
30 & 6 & 4.82272 & 1.17728 \tabularnewline
31 & 5 & 3.64628 & 1.35372 \tabularnewline
32 & 6.5 & 3.90955 & 2.59045 \tabularnewline
33 & 5 & 4.77858 & 0.221425 \tabularnewline
34 & 6 & 3.82817 & 2.17183 \tabularnewline
35 & 4.5 & 3.64628 & 0.853718 \tabularnewline
36 & 5 & 4.13026 & 0.869742 \tabularnewline
37 & 5 & 4.77858 & 0.221425 \tabularnewline
38 & 6.5 & 5.12481 & 1.37519 \tabularnewline
39 & 7 & 4.56477 & 2.43523 \tabularnewline
40 & 4.5 & 4.47649 & 0.0235124 \tabularnewline
41 & 8.5 & 5.77312 & 2.72688 \tabularnewline
42 & 3.5 & 3.82817 & -0.32817 \tabularnewline
43 & 6 & 4.42703 & 1.57297 \tabularnewline
44 & 1.5 & 4.2946 & -2.7946 \tabularnewline
45 & 3.5 & 3.99251 & -0.492512 \tabularnewline
46 & 7.5 & 3.78403 & 3.71597 \tabularnewline
47 & 5 & 4.21322 & 0.786776 \tabularnewline
48 & 6.5 & 4.5084 & 1.9916 \tabularnewline
49 & 6.5 & 5.0312 & 1.4688 \tabularnewline
50 & 6.5 & 5.08066 & 1.41934 \tabularnewline
51 & 7 & 4.47117 & 2.52883 \tabularnewline
52 & 1.5 & 4.1744 & -2.6744 \tabularnewline
53 & 4 & 5.37743 & -1.37743 \tabularnewline
54 & 4.5 & 4.51531 & -0.0153115 \tabularnewline
55 & 0 & 3.78403 & -3.78403 \tabularnewline
56 & 3.5 & 4.68497 & -1.18497 \tabularnewline
57 & 4.5 & 5.20086 & -0.700863 \tabularnewline
58 & 0 & 4.94824 & -4.94824 \tabularnewline
59 & 3 & 5.0312 & -2.0312 \tabularnewline
60 & 3.5 & 4.51531 & -1.01531 \tabularnewline
61 & 3 & 5.16895 & -2.16895 \tabularnewline
62 & 1 & 4.68497 & -3.68497 \tabularnewline
\hline
\end{tabular}
%Source: https://freestatistics.org/blog/index.php?pk=270582&T=4

[TABLE]
[ROW][C]Multiple Linear Regression - Actuals, Interpolation, and Residuals[/C][/ROW]
[ROW][C]Time or Index[/C][C]Actuals[/C][C]InterpolationForecast[/C][C]ResidualsPrediction Error[/C][/ROW]
[ROW][C]1[/C][C]7.5[/C][C]4.8174[/C][C]2.6826[/C][/ROW]
[ROW][C]2[/C][C]6.5[/C][C]5.37743[/C][C]1.12257[/C][/ROW]
[ROW][C]3[/C][C]1[/C][C]4.52063[/C][C]-3.52063[/C][/ROW]
[ROW][C]4[/C][C]1[/C][C]4.13026[/C][C]-3.13026[/C][/ROW]
[ROW][C]5[/C][C]5.5[/C][C]4.3882[/C][C]1.1118[/C][/ROW]
[ROW][C]6[/C][C]8.5[/C][C]5.20086[/C][C]3.29914[/C][/ROW]
[ROW][C]7[/C][C]6.5[/C][C]4.69029[/C][C]1.80971[/C][/ROW]
[ROW][C]8[/C][C]4.5[/C][C]4.00474[/C][C]0.495261[/C][/ROW]
[ROW][C]9[/C][C]2[/C][C]4.47649[/C][C]-2.47649[/C][/ROW]
[ROW][C]10[/C][C]5[/C][C]4.47649[/C][C]0.523512[/C][/ROW]
[ROW][C]11[/C][C]0.5[/C][C]4.08612[/C][C]-3.58612[/C][/ROW]
[ROW][C]12[/C][C]5[/C][C]4.90568[/C][C]0.0943161[/C][/ROW]
[ROW][C]13[/C][C]2.5[/C][C]4.25046[/C][C]-1.75046[/C][/ROW]
[ROW][C]14[/C][C]5[/C][C]5.42157[/C][C]-0.421575[/C][/ROW]
[ROW][C]15[/C][C]5.5[/C][C]5.16895[/C][C]0.331052[/C][/ROW]
[ROW][C]16[/C][C]3.5[/C][C]4.47117[/C][C]-0.971169[/C][/ROW]
[ROW][C]17[/C][C]4[/C][C]5.11949[/C][C]-1.11949[/C][/ROW]
[ROW][C]18[/C][C]6.5[/C][C]4.21854[/C][C]2.28146[/C][/ROW]
[ROW][C]19[/C][C]4.5[/C][C]4.47117[/C][C]0.0288308[/C][/ROW]
[ROW][C]20[/C][C]5.5[/C][C]4.85995[/C][C]0.640049[/C][/ROW]
[ROW][C]21[/C][C]4[/C][C]5.03652[/C][C]-1.03652[/C][/ROW]
[ROW][C]22[/C][C]7.5[/C][C]4.85995[/C][C]2.64005[/C][/ROW]
[ROW][C]23[/C][C]4[/C][C]4.47649[/C][C]-0.476488[/C][/ROW]
[ROW][C]24[/C][C]5.5[/C][C]3.95528[/C][C]1.54472[/C][/ROW]
[ROW][C]25[/C][C]2.5[/C][C]4.98706[/C][C]-2.48706[/C][/ROW]
[ROW][C]26[/C][C]5.5[/C][C]5.07534[/C][C]0.424655[/C][/ROW]
[ROW][C]27[/C][C]3.5[/C][C]4.47649[/C][C]-0.976488[/C][/ROW]
[ROW][C]28[/C][C]4.5[/C][C]4.1744[/C][C]0.3256[/C][/ROW]
[ROW][C]29[/C][C]4.5[/C][C]4.20632[/C][C]0.293685[/C][/ROW]
[ROW][C]30[/C][C]6[/C][C]4.82272[/C][C]1.17728[/C][/ROW]
[ROW][C]31[/C][C]5[/C][C]3.64628[/C][C]1.35372[/C][/ROW]
[ROW][C]32[/C][C]6.5[/C][C]3.90955[/C][C]2.59045[/C][/ROW]
[ROW][C]33[/C][C]5[/C][C]4.77858[/C][C]0.221425[/C][/ROW]
[ROW][C]34[/C][C]6[/C][C]3.82817[/C][C]2.17183[/C][/ROW]
[ROW][C]35[/C][C]4.5[/C][C]3.64628[/C][C]0.853718[/C][/ROW]
[ROW][C]36[/C][C]5[/C][C]4.13026[/C][C]0.869742[/C][/ROW]
[ROW][C]37[/C][C]5[/C][C]4.77858[/C][C]0.221425[/C][/ROW]
[ROW][C]38[/C][C]6.5[/C][C]5.12481[/C][C]1.37519[/C][/ROW]
[ROW][C]39[/C][C]7[/C][C]4.56477[/C][C]2.43523[/C][/ROW]
[ROW][C]40[/C][C]4.5[/C][C]4.47649[/C][C]0.0235124[/C][/ROW]
[ROW][C]41[/C][C]8.5[/C][C]5.77312[/C][C]2.72688[/C][/ROW]
[ROW][C]42[/C][C]3.5[/C][C]3.82817[/C][C]-0.32817[/C][/ROW]
[ROW][C]43[/C][C]6[/C][C]4.42703[/C][C]1.57297[/C][/ROW]
[ROW][C]44[/C][C]1.5[/C][C]4.2946[/C][C]-2.7946[/C][/ROW]
[ROW][C]45[/C][C]3.5[/C][C]3.99251[/C][C]-0.492512[/C][/ROW]
[ROW][C]46[/C][C]7.5[/C][C]3.78403[/C][C]3.71597[/C][/ROW]
[ROW][C]47[/C][C]5[/C][C]4.21322[/C][C]0.786776[/C][/ROW]
[ROW][C]48[/C][C]6.5[/C][C]4.5084[/C][C]1.9916[/C][/ROW]
[ROW][C]49[/C][C]6.5[/C][C]5.0312[/C][C]1.4688[/C][/ROW]
[ROW][C]50[/C][C]6.5[/C][C]5.08066[/C][C]1.41934[/C][/ROW]
[ROW][C]51[/C][C]7[/C][C]4.47117[/C][C]2.52883[/C][/ROW]
[ROW][C]52[/C][C]1.5[/C][C]4.1744[/C][C]-2.6744[/C][/ROW]
[ROW][C]53[/C][C]4[/C][C]5.37743[/C][C]-1.37743[/C][/ROW]
[ROW][C]54[/C][C]4.5[/C][C]4.51531[/C][C]-0.0153115[/C][/ROW]
[ROW][C]55[/C][C]0[/C][C]3.78403[/C][C]-3.78403[/C][/ROW]
[ROW][C]56[/C][C]3.5[/C][C]4.68497[/C][C]-1.18497[/C][/ROW]
[ROW][C]57[/C][C]4.5[/C][C]5.20086[/C][C]-0.700863[/C][/ROW]
[ROW][C]58[/C][C]0[/C][C]4.94824[/C][C]-4.94824[/C][/ROW]
[ROW][C]59[/C][C]3[/C][C]5.0312[/C][C]-2.0312[/C][/ROW]
[ROW][C]60[/C][C]3.5[/C][C]4.51531[/C][C]-1.01531[/C][/ROW]
[ROW][C]61[/C][C]3[/C][C]5.16895[/C][C]-2.16895[/C][/ROW]
[ROW][C]62[/C][C]1[/C][C]4.68497[/C][C]-3.68497[/C][/ROW]
[/TABLE]
Source: https://freestatistics.org/blog/index.php?pk=270582&T=4

Globally Unique Identifier (entire table): ba.freestatistics.org/blog/index.php?pk=270582&T=4

As an alternative you can also use a QR Code:  

The GUIDs for individual cells are displayed in the table below:

Multiple Linear Regression - Actuals, Interpolation, and Residuals
Time or IndexActualsInterpolationForecastResidualsPrediction Error
17.54.81742.6826
26.55.377431.12257
314.52063-3.52063
414.13026-3.13026
55.54.38821.1118
68.55.200863.29914
76.54.690291.80971
84.54.004740.495261
924.47649-2.47649
1054.476490.523512
110.54.08612-3.58612
1254.905680.0943161
132.54.25046-1.75046
1455.42157-0.421575
155.55.168950.331052
163.54.47117-0.971169
1745.11949-1.11949
186.54.218542.28146
194.54.471170.0288308
205.54.859950.640049
2145.03652-1.03652
227.54.859952.64005
2344.47649-0.476488
245.53.955281.54472
252.54.98706-2.48706
265.55.075340.424655
273.54.47649-0.976488
284.54.17440.3256
294.54.206320.293685
3064.822721.17728
3153.646281.35372
326.53.909552.59045
3354.778580.221425
3463.828172.17183
354.53.646280.853718
3654.130260.869742
3754.778580.221425
386.55.124811.37519
3974.564772.43523
404.54.476490.0235124
418.55.773122.72688
423.53.82817-0.32817
4364.427031.57297
441.54.2946-2.7946
453.53.99251-0.492512
467.53.784033.71597
4754.213220.786776
486.54.50841.9916
496.55.03121.4688
506.55.080661.41934
5174.471172.52883
521.54.1744-2.6744
5345.37743-1.37743
544.54.51531-0.0153115
5503.78403-3.78403
563.54.68497-1.18497
574.55.20086-0.700863
5804.94824-4.94824
5935.0312-2.0312
603.54.51531-1.01531
6135.16895-2.16895
6214.68497-3.68497


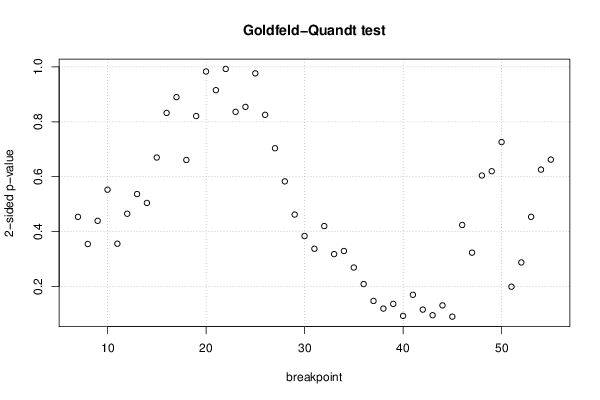
Goldfeld-Quandt test for Heteroskedasticity
p-valuesAlternative Hypothesis
breakpoint indexgreater2-sidedless
70.7732380.4535230.226762
80.8226640.3546720.177336
90.7804280.4391450.219572
100.723770.5524590.27623
110.8221610.3556790.177839
120.7675160.4649680.232484
130.7316040.5367920.268396
140.747830.5043410.25217
150.6650760.6698470.334924
160.5838420.8323160.416158
170.5550950.8898090.444905
180.6695420.6609170.330458
190.5895410.8209180.410459
200.5083280.9833440.491672
210.4576190.9152380.542381
220.4962990.9925990.503701
230.4181690.8363390.581831
240.4271770.8543550.572823
250.4882610.9765220.511739
260.4127150.825430.587285
270.3518430.7036860.648157
280.2914890.5829790.708511
290.2309680.4619370.769032
300.19190.3838010.8081
310.1686980.3373970.831302
320.2099990.4199980.790001
330.1589510.3179030.841049
340.1645970.3291940.835403
350.1344910.2689830.865509
360.1043690.2087390.895631
370.07355340.1471070.926447
380.05969010.119380.94031
390.06820480.136410.931795
400.04634920.09269830.953651
410.08481130.1696230.915189
420.05778270.1155650.942217
430.04756940.09513870.952431
440.06559540.1311910.934405
450.04497850.08995690.955022
460.2119710.4239420.788029
470.1616110.3232210.838389
480.3021520.6043030.697848
490.3099450.6198890.690055
500.6369630.7260740.363037
510.9004930.1990140.099507
520.8562590.2874820.143741
530.7731240.4537510.226876
540.6871130.6257750.312887
550.6689330.6621350.331067

\begin{tabular}{lllllllll}
\hline
Goldfeld-Quandt test for Heteroskedasticity \tabularnewline
p-values & Alternative Hypothesis \tabularnewline
breakpoint index & greater & 2-sided & less \tabularnewline
7 & 0.773238 & 0.453523 & 0.226762 \tabularnewline
8 & 0.822664 & 0.354672 & 0.177336 \tabularnewline
9 & 0.780428 & 0.439145 & 0.219572 \tabularnewline
10 & 0.72377 & 0.552459 & 0.27623 \tabularnewline
11 & 0.822161 & 0.355679 & 0.177839 \tabularnewline
12 & 0.767516 & 0.464968 & 0.232484 \tabularnewline
13 & 0.731604 & 0.536792 & 0.268396 \tabularnewline
14 & 0.74783 & 0.504341 & 0.25217 \tabularnewline
15 & 0.665076 & 0.669847 & 0.334924 \tabularnewline
16 & 0.583842 & 0.832316 & 0.416158 \tabularnewline
17 & 0.555095 & 0.889809 & 0.444905 \tabularnewline
18 & 0.669542 & 0.660917 & 0.330458 \tabularnewline
19 & 0.589541 & 0.820918 & 0.410459 \tabularnewline
20 & 0.508328 & 0.983344 & 0.491672 \tabularnewline
21 & 0.457619 & 0.915238 & 0.542381 \tabularnewline
22 & 0.496299 & 0.992599 & 0.503701 \tabularnewline
23 & 0.418169 & 0.836339 & 0.581831 \tabularnewline
24 & 0.427177 & 0.854355 & 0.572823 \tabularnewline
25 & 0.488261 & 0.976522 & 0.511739 \tabularnewline
26 & 0.412715 & 0.82543 & 0.587285 \tabularnewline
27 & 0.351843 & 0.703686 & 0.648157 \tabularnewline
28 & 0.291489 & 0.582979 & 0.708511 \tabularnewline
29 & 0.230968 & 0.461937 & 0.769032 \tabularnewline
30 & 0.1919 & 0.383801 & 0.8081 \tabularnewline
31 & 0.168698 & 0.337397 & 0.831302 \tabularnewline
32 & 0.209999 & 0.419998 & 0.790001 \tabularnewline
33 & 0.158951 & 0.317903 & 0.841049 \tabularnewline
34 & 0.164597 & 0.329194 & 0.835403 \tabularnewline
35 & 0.134491 & 0.268983 & 0.865509 \tabularnewline
36 & 0.104369 & 0.208739 & 0.895631 \tabularnewline
37 & 0.0735534 & 0.147107 & 0.926447 \tabularnewline
38 & 0.0596901 & 0.11938 & 0.94031 \tabularnewline
39 & 0.0682048 & 0.13641 & 0.931795 \tabularnewline
40 & 0.0463492 & 0.0926983 & 0.953651 \tabularnewline
41 & 0.0848113 & 0.169623 & 0.915189 \tabularnewline
42 & 0.0577827 & 0.115565 & 0.942217 \tabularnewline
43 & 0.0475694 & 0.0951387 & 0.952431 \tabularnewline
44 & 0.0655954 & 0.131191 & 0.934405 \tabularnewline
45 & 0.0449785 & 0.0899569 & 0.955022 \tabularnewline
46 & 0.211971 & 0.423942 & 0.788029 \tabularnewline
47 & 0.161611 & 0.323221 & 0.838389 \tabularnewline
48 & 0.302152 & 0.604303 & 0.697848 \tabularnewline
49 & 0.309945 & 0.619889 & 0.690055 \tabularnewline
50 & 0.636963 & 0.726074 & 0.363037 \tabularnewline
51 & 0.900493 & 0.199014 & 0.099507 \tabularnewline
52 & 0.856259 & 0.287482 & 0.143741 \tabularnewline
53 & 0.773124 & 0.453751 & 0.226876 \tabularnewline
54 & 0.687113 & 0.625775 & 0.312887 \tabularnewline
55 & 0.668933 & 0.662135 & 0.331067 \tabularnewline
\hline
\end{tabular}
%Source: https://freestatistics.org/blog/index.php?pk=270582&T=5

[TABLE]
[ROW][C]Goldfeld-Quandt test for Heteroskedasticity[/C][/ROW]
[ROW][C]p-values[/C][C]Alternative Hypothesis[/C][/ROW]
[ROW][C]breakpoint index[/C][C]greater[/C][C]2-sided[/C][C]less[/C][/ROW]
[ROW][C]7[/C][C]0.773238[/C][C]0.453523[/C][C]0.226762[/C][/ROW]
[ROW][C]8[/C][C]0.822664[/C][C]0.354672[/C][C]0.177336[/C][/ROW]
[ROW][C]9[/C][C]0.780428[/C][C]0.439145[/C][C]0.219572[/C][/ROW]
[ROW][C]10[/C][C]0.72377[/C][C]0.552459[/C][C]0.27623[/C][/ROW]
[ROW][C]11[/C][C]0.822161[/C][C]0.355679[/C][C]0.177839[/C][/ROW]
[ROW][C]12[/C][C]0.767516[/C][C]0.464968[/C][C]0.232484[/C][/ROW]
[ROW][C]13[/C][C]0.731604[/C][C]0.536792[/C][C]0.268396[/C][/ROW]
[ROW][C]14[/C][C]0.74783[/C][C]0.504341[/C][C]0.25217[/C][/ROW]
[ROW][C]15[/C][C]0.665076[/C][C]0.669847[/C][C]0.334924[/C][/ROW]
[ROW][C]16[/C][C]0.583842[/C][C]0.832316[/C][C]0.416158[/C][/ROW]
[ROW][C]17[/C][C]0.555095[/C][C]0.889809[/C][C]0.444905[/C][/ROW]
[ROW][C]18[/C][C]0.669542[/C][C]0.660917[/C][C]0.330458[/C][/ROW]
[ROW][C]19[/C][C]0.589541[/C][C]0.820918[/C][C]0.410459[/C][/ROW]
[ROW][C]20[/C][C]0.508328[/C][C]0.983344[/C][C]0.491672[/C][/ROW]
[ROW][C]21[/C][C]0.457619[/C][C]0.915238[/C][C]0.542381[/C][/ROW]
[ROW][C]22[/C][C]0.496299[/C][C]0.992599[/C][C]0.503701[/C][/ROW]
[ROW][C]23[/C][C]0.418169[/C][C]0.836339[/C][C]0.581831[/C][/ROW]
[ROW][C]24[/C][C]0.427177[/C][C]0.854355[/C][C]0.572823[/C][/ROW]
[ROW][C]25[/C][C]0.488261[/C][C]0.976522[/C][C]0.511739[/C][/ROW]
[ROW][C]26[/C][C]0.412715[/C][C]0.82543[/C][C]0.587285[/C][/ROW]
[ROW][C]27[/C][C]0.351843[/C][C]0.703686[/C][C]0.648157[/C][/ROW]
[ROW][C]28[/C][C]0.291489[/C][C]0.582979[/C][C]0.708511[/C][/ROW]
[ROW][C]29[/C][C]0.230968[/C][C]0.461937[/C][C]0.769032[/C][/ROW]
[ROW][C]30[/C][C]0.1919[/C][C]0.383801[/C][C]0.8081[/C][/ROW]
[ROW][C]31[/C][C]0.168698[/C][C]0.337397[/C][C]0.831302[/C][/ROW]
[ROW][C]32[/C][C]0.209999[/C][C]0.419998[/C][C]0.790001[/C][/ROW]
[ROW][C]33[/C][C]0.158951[/C][C]0.317903[/C][C]0.841049[/C][/ROW]
[ROW][C]34[/C][C]0.164597[/C][C]0.329194[/C][C]0.835403[/C][/ROW]
[ROW][C]35[/C][C]0.134491[/C][C]0.268983[/C][C]0.865509[/C][/ROW]
[ROW][C]36[/C][C]0.104369[/C][C]0.208739[/C][C]0.895631[/C][/ROW]
[ROW][C]37[/C][C]0.0735534[/C][C]0.147107[/C][C]0.926447[/C][/ROW]
[ROW][C]38[/C][C]0.0596901[/C][C]0.11938[/C][C]0.94031[/C][/ROW]
[ROW][C]39[/C][C]0.0682048[/C][C]0.13641[/C][C]0.931795[/C][/ROW]
[ROW][C]40[/C][C]0.0463492[/C][C]0.0926983[/C][C]0.953651[/C][/ROW]
[ROW][C]41[/C][C]0.0848113[/C][C]0.169623[/C][C]0.915189[/C][/ROW]
[ROW][C]42[/C][C]0.0577827[/C][C]0.115565[/C][C]0.942217[/C][/ROW]
[ROW][C]43[/C][C]0.0475694[/C][C]0.0951387[/C][C]0.952431[/C][/ROW]
[ROW][C]44[/C][C]0.0655954[/C][C]0.131191[/C][C]0.934405[/C][/ROW]
[ROW][C]45[/C][C]0.0449785[/C][C]0.0899569[/C][C]0.955022[/C][/ROW]
[ROW][C]46[/C][C]0.211971[/C][C]0.423942[/C][C]0.788029[/C][/ROW]
[ROW][C]47[/C][C]0.161611[/C][C]0.323221[/C][C]0.838389[/C][/ROW]
[ROW][C]48[/C][C]0.302152[/C][C]0.604303[/C][C]0.697848[/C][/ROW]
[ROW][C]49[/C][C]0.309945[/C][C]0.619889[/C][C]0.690055[/C][/ROW]
[ROW][C]50[/C][C]0.636963[/C][C]0.726074[/C][C]0.363037[/C][/ROW]
[ROW][C]51[/C][C]0.900493[/C][C]0.199014[/C][C]0.099507[/C][/ROW]
[ROW][C]52[/C][C]0.856259[/C][C]0.287482[/C][C]0.143741[/C][/ROW]
[ROW][C]53[/C][C]0.773124[/C][C]0.453751[/C][C]0.226876[/C][/ROW]
[ROW][C]54[/C][C]0.687113[/C][C]0.625775[/C][C]0.312887[/C][/ROW]
[ROW][C]55[/C][C]0.668933[/C][C]0.662135[/C][C]0.331067[/C][/ROW]
[/TABLE]
Source: https://freestatistics.org/blog/index.php?pk=270582&T=5

Globally Unique Identifier (entire table): ba.freestatistics.org/blog/index.php?pk=270582&T=5

As an alternative you can also use a QR Code:  

The GUIDs for individual cells are displayed in the table below:

Goldfeld-Quandt test for Heteroskedasticity
p-valuesAlternative Hypothesis
breakpoint indexgreater2-sidedless
70.7732380.4535230.226762
80.8226640.3546720.177336
90.7804280.4391450.219572
100.723770.5524590.27623
110.8221610.3556790.177839
120.7675160.4649680.232484
130.7316040.5367920.268396
140.747830.5043410.25217
150.6650760.6698470.334924
160.5838420.8323160.416158
170.5550950.8898090.444905
180.6695420.6609170.330458
190.5895410.8209180.410459
200.5083280.9833440.491672
210.4576190.9152380.542381
220.4962990.9925990.503701
230.4181690.8363390.581831
240.4271770.8543550.572823
250.4882610.9765220.511739
260.4127150.825430.587285
270.3518430.7036860.648157
280.2914890.5829790.708511
290.2309680.4619370.769032
300.19190.3838010.8081
310.1686980.3373970.831302
320.2099990.4199980.790001
330.1589510.3179030.841049
340.1645970.3291940.835403
350.1344910.2689830.865509
360.1043690.2087390.895631
370.07355340.1471070.926447
380.05969010.119380.94031
390.06820480.136410.931795
400.04634920.09269830.953651
410.08481130.1696230.915189
420.05778270.1155650.942217
430.04756940.09513870.952431
440.06559540.1311910.934405
450.04497850.08995690.955022
460.2119710.4239420.788029
470.1616110.3232210.838389
480.3021520.6043030.697848
490.3099450.6198890.690055
500.6369630.7260740.363037
510.9004930.1990140.099507
520.8562590.2874820.143741
530.7731240.4537510.226876
540.6871130.6257750.312887
550.6689330.6621350.331067


Meta Analysis of Goldfeld-Quandt test for Heteroskedasticity
Description# significant tests% significant testsOK/NOK
1% type I error level00OK
5% type I error level00OK
10% type I error level30.0612245OK

\begin{tabular}{lllllllll}
\hline
Meta Analysis of Goldfeld-Quandt test for Heteroskedasticity \tabularnewline
Description & # significant tests & % significant tests & OK/NOK \tabularnewline
1% type I error level & 0 & 0 & OK \tabularnewline
5% type I error level & 0 & 0 & OK \tabularnewline
10% type I error level & 3 & 0.0612245 & OK \tabularnewline
\hline
\end{tabular}
%Source: https://freestatistics.org/blog/index.php?pk=270582&T=6

[TABLE]
[ROW][C]Meta Analysis of Goldfeld-Quandt test for Heteroskedasticity[/C][/ROW]
[ROW][C]Description[/C][C]# significant tests[/C][C]% significant tests[/C][C]OK/NOK[/C][/ROW]
[ROW][C]1% type I error level[/C][C]0[/C][C]0[/C][C]OK[/C][/ROW]
[ROW][C]5% type I error level[/C][C]0[/C][C]0[/C][C]OK[/C][/ROW]
[ROW][C]10% type I error level[/C][C]3[/C][C]0.0612245[/C][C]OK[/C][/ROW]
[/TABLE]
Source: https://freestatistics.org/blog/index.php?pk=270582&T=6

Globally Unique Identifier (entire table): ba.freestatistics.org/blog/index.php?pk=270582&T=6

As an alternative you can also use a QR Code:  

The GUIDs for individual cells are displayed in the table below:

Meta Analysis of Goldfeld-Quandt test for Heteroskedasticity
Description# significant tests% significant testsOK/NOK
1% type I error level00OK
5% type I error level00OK
10% type I error level30.0612245OK


Parameters (Session):
par1 = 1 ; par2 = Do not include Seasonal Dummies ; par3 = No Linear Trend ;
Parameters (R input):
par1 = 1 ; par2 = Do not include Seasonal Dummies ; par3 = No Linear Trend ;
R code (references can be found in the software module):
library(lattice)
library(lmtest)
n25 <- 25 #minimum number of obs. for Goldfeld-Quandt test
par1 <- as.numeric(par1)
x <- t(y)
k <- length(x[1,])
n <- length(x[,1])
x1 <- cbind(x[,par1], x[,1:k!=par1])
mycolnames <- c(colnames(x)[par1], colnames(x)[1:k!=par1])
colnames(x1) <- mycolnames #colnames(x)[par1]
x <- x1
if (par3 == 'First Differences'){
x2 <- array(0, dim=c(n-1,k), dimnames=list(1:(n-1), paste('(1-B)',colnames(x),sep='')))
for (i in 1:n-1) {
for (j in 1:k) {
x2[i,j] <- x[i+1,j] - x[i,j]
}
}
x <- x2
}
if (par2 == 'Include Monthly Dummies'){
x2 <- array(0, dim=c(n,11), dimnames=list(1:n, paste('M', seq(1:11), sep ='')))
for (i in 1:11){
x2[seq(i,n,12),i] <- 1
}
x <- cbind(x, x2)
}
if (par2 == 'Include Quarterly Dummies'){
x2 <- array(0, dim=c(n,3), dimnames=list(1:n, paste('Q', seq(1:3), sep ='')))
for (i in 1:3){
x2[seq(i,n,4),i] <- 1
}
x <- cbind(x, x2)
}
k <- length(x[1,])
if (par3 == 'Linear Trend'){
x <- cbind(x, c(1:n))
colnames(x)[k+1] <- 't'
}
x
k <- length(x[1,])
df <- as.data.frame(x)
(mylm <- lm(df))
(mysum <- summary(mylm))
if (n > n25) {
kp3 <- k + 3
nmkm3 <- n - k - 3
gqarr <- array(NA, dim=c(nmkm3-kp3+1,3))
numgqtests <- 0
numsignificant1 <- 0
numsignificant5 <- 0
numsignificant10 <- 0
for (mypoint in kp3:nmkm3) {
j <- 0
numgqtests <- numgqtests + 1
for (myalt in c('greater', 'two.sided', 'less')) {
j <- j + 1
gqarr[mypoint-kp3+1,j] <- gqtest(mylm, point=mypoint, alternative=myalt)$p.value
}
if (gqarr[mypoint-kp3+1,2] < 0.01) numsignificant1 <- numsignificant1 + 1
if (gqarr[mypoint-kp3+1,2] < 0.05) numsignificant5 <- numsignificant5 + 1
if (gqarr[mypoint-kp3+1,2] < 0.10) numsignificant10 <- numsignificant10 + 1
}
gqarr
}
bitmap(file='test0.png')
plot(x[,1], type='l', main='Actuals and Interpolation', ylab='value of Actuals and Interpolation (dots)', xlab='time or index')
points(x[,1]-mysum$resid)
grid()
dev.off()
bitmap(file='test1.png')
plot(mysum$resid, type='b', pch=19, main='Residuals', ylab='value of Residuals', xlab='time or index')
grid()
dev.off()
bitmap(file='test2.png')
hist(mysum$resid, main='Residual Histogram', xlab='values of Residuals')
grid()
dev.off()
bitmap(file='test3.png')
densityplot(~mysum$resid,col='black',main='Residual Density Plot', xlab='values of Residuals')
dev.off()
bitmap(file='test4.png')
qqnorm(mysum$resid, main='Residual Normal Q-Q Plot')
qqline(mysum$resid)
grid()
dev.off()
(myerror <- as.ts(mysum$resid))
bitmap(file='test5.png')
dum <- cbind(lag(myerror,k=1),myerror)
dum
dum1 <- dum[2:length(myerror),]
dum1
z <- as.data.frame(dum1)
z
plot(z,main=paste('Residual Lag plot, lowess, and regression line'), ylab='values of Residuals', xlab='lagged values of Residuals')
lines(lowess(z))
abline(lm(z))
grid()
dev.off()
bitmap(file='test6.png')
acf(mysum$resid, lag.max=length(mysum$resid)/2, main='Residual Autocorrelation Function')
grid()
dev.off()
bitmap(file='test7.png')
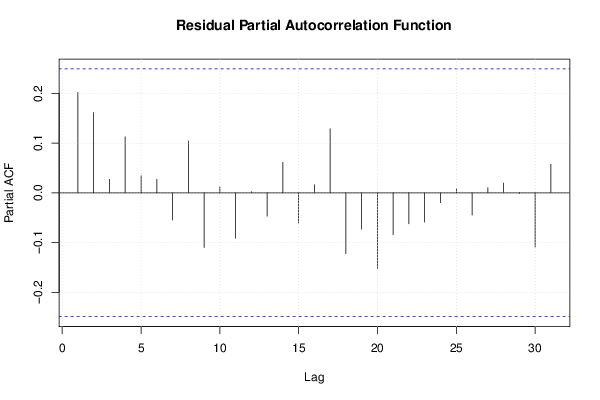
pacf(mysum$resid, lag.max=length(mysum$resid)/2, main='Residual Partial Autocorrelation Function')
grid()
dev.off()
bitmap(file='test8.png')
opar <- par(mfrow = c(2,2), oma = c(0, 0, 1.1, 0))
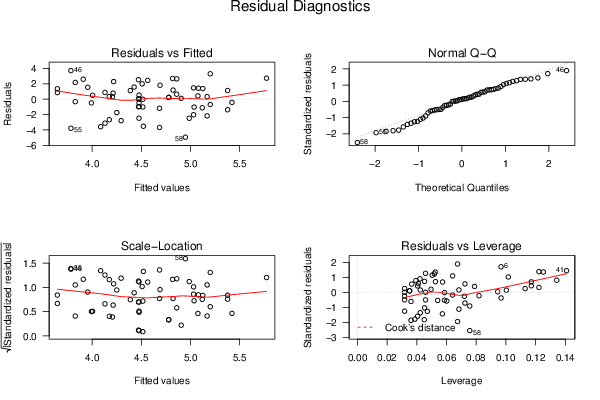
plot(mylm, las = 1, sub='Residual Diagnostics')
par(opar)
dev.off()
if (n > n25) {
bitmap(file='test9.png')
plot(kp3:nmkm3,gqarr[,2], main='Goldfeld-Quandt test',ylab='2-sided p-value',xlab='breakpoint')
grid()
dev.off()
}
load(file='createtable')
a<-table.start()
a<-table.row.start(a)
a<-table.element(a, 'Multiple Linear Regression - Estimated Regression Equation', 1, TRUE)
a<-table.row.end(a)
myeq <- colnames(x)[1]
myeq <- paste(myeq, '[t] = ', sep='')
for (i in 1:k){
if (mysum$coefficients[i,1] > 0) myeq <- paste(myeq, '+', '')
myeq <- paste(myeq, signif(mysum$coefficients[i,1],6), sep=' ')
if (rownames(mysum$coefficients)[i] != '(Intercept)') {
myeq <- paste(myeq, rownames(mysum$coefficients)[i], sep='')
if (rownames(mysum$coefficients)[i] != 't') myeq <- paste(myeq, '[t]', sep='')
}
}
myeq <- paste(myeq, ' + e[t]')
a<-table.row.start(a)
a<-table.element(a, myeq)
a<-table.row.end(a)
a<-table.end(a)
table.save(a,file='mytable1.tab')
a<-table.start()
a<-table.row.start(a)
a<-table.element(a,hyperlink('ols1.htm','Multiple Linear Regression - Ordinary Least Squares',''), 6, TRUE)
a<-table.row.end(a)
a<-table.row.start(a)
a<-table.element(a,'Variable',header=TRUE)
a<-table.element(a,'Parameter',header=TRUE)
a<-table.element(a,'S.D.',header=TRUE)
a<-table.element(a,'T-STAT
H0: parameter = 0',header=TRUE)
a<-table.element(a,'2-tail p-value',header=TRUE)
a<-table.element(a,'1-tail p-value',header=TRUE)
a<-table.row.end(a)
for (i in 1:k){
a<-table.row.start(a)
a<-table.element(a,rownames(mysum$coefficients)[i],header=TRUE)
a<-table.element(a,signif(mysum$coefficients[i,1],6))
a<-table.element(a, signif(mysum$coefficients[i,2],6))
a<-table.element(a, signif(mysum$coefficients[i,3],4))
a<-table.element(a, signif(mysum$coefficients[i,4],6))
a<-table.element(a, signif(mysum$coefficients[i,4]/2,6))
a<-table.row.end(a)
}
a<-table.end(a)
table.save(a,file='mytable2.tab')
a<-table.start()
a<-table.row.start(a)
a<-table.element(a, 'Multiple Linear Regression - Regression Statistics', 2, TRUE)
a<-table.row.end(a)
a<-table.row.start(a)
a<-table.element(a, 'Multiple R',1,TRUE)
a<-table.element(a, signif(sqrt(mysum$r.squared),6))
a<-table.row.end(a)
a<-table.row.start(a)
a<-table.element(a, 'R-squared',1,TRUE)
a<-table.element(a, signif(mysum$r.squared,6))
a<-table.row.end(a)
a<-table.row.start(a)
a<-table.element(a, 'Adjusted R-squared',1,TRUE)
a<-table.element(a, signif(mysum$adj.r.squared,6))
a<-table.row.end(a)
a<-table.row.start(a)
a<-table.element(a, 'F-TEST (value)',1,TRUE)
a<-table.element(a, signif(mysum$fstatistic[1],6))
a<-table.row.end(a)
a<-table.row.start(a)
a<-table.element(a, 'F-TEST (DF numerator)',1,TRUE)
a<-table.element(a, signif(mysum$fstatistic[2],6))
a<-table.row.end(a)
a<-table.row.start(a)
a<-table.element(a, 'F-TEST (DF denominator)',1,TRUE)
a<-table.element(a, signif(mysum$fstatistic[3],6))
a<-table.row.end(a)
a<-table.row.start(a)
a<-table.element(a, 'p-value',1,TRUE)
a<-table.element(a, signif(1-pf(mysum$fstatistic[1],mysum$fstatistic[2],mysum$fstatistic[3]),6))
a<-table.row.end(a)
a<-table.row.start(a)
a<-table.element(a, 'Multiple Linear Regression - Residual Statistics', 2, TRUE)
a<-table.row.end(a)
a<-table.row.start(a)
a<-table.element(a, 'Residual Standard Deviation',1,TRUE)
a<-table.element(a, signif(mysum$sigma,6))
a<-table.row.end(a)
a<-table.row.start(a)
a<-table.element(a, 'Sum Squared Residuals',1,TRUE)
a<-table.element(a, signif(sum(myerror*myerror),6))
a<-table.row.end(a)
a<-table.end(a)
table.save(a,file='mytable3.tab')
a<-table.start()
a<-table.row.start(a)
a<-table.element(a, 'Multiple Linear Regression - Actuals, Interpolation, and Residuals', 4, TRUE)
a<-table.row.end(a)
a<-table.row.start(a)
a<-table.element(a, 'Time or Index', 1, TRUE)
a<-table.element(a, 'Actuals', 1, TRUE)
a<-table.element(a, 'Interpolation
Forecast', 1, TRUE)
a<-table.element(a, 'Residuals
Prediction Error', 1, TRUE)
a<-table.row.end(a)
for (i in 1:n) {
a<-table.row.start(a)
a<-table.element(a,i, 1, TRUE)
a<-table.element(a,signif(x[i],6))
a<-table.element(a,signif(x[i]-mysum$resid[i],6))
a<-table.element(a,signif(mysum$resid[i],6))
a<-table.row.end(a)
}
a<-table.end(a)
table.save(a,file='mytable4.tab')
if (n > n25) {
a<-table.start()
a<-table.row.start(a)
a<-table.element(a,'Goldfeld-Quandt test for Heteroskedasticity',4,TRUE)
a<-table.row.end(a)
a<-table.row.start(a)
a<-table.element(a,'p-values',header=TRUE)
a<-table.element(a,'Alternative Hypothesis',3,header=TRUE)
a<-table.row.end(a)
a<-table.row.start(a)
a<-table.element(a,'breakpoint index',header=TRUE)
a<-table.element(a,'greater',header=TRUE)
a<-table.element(a,'2-sided',header=TRUE)
a<-table.element(a,'less',header=TRUE)
a<-table.row.end(a)
for (mypoint in kp3:nmkm3) {
a<-table.row.start(a)
a<-table.element(a,mypoint,header=TRUE)
a<-table.element(a,signif(gqarr[mypoint-kp3+1,1],6))
a<-table.element(a,signif(gqarr[mypoint-kp3+1,2],6))
a<-table.element(a,signif(gqarr[mypoint-kp3+1,3],6))
a<-table.row.end(a)
}
a<-table.end(a)
table.save(a,file='mytable5.tab')
a<-table.start()
a<-table.row.start(a)
a<-table.element(a,'Meta Analysis of Goldfeld-Quandt test for Heteroskedasticity',4,TRUE)
a<-table.row.end(a)
a<-table.row.start(a)
a<-table.element(a,'Description',header=TRUE)
a<-table.element(a,'# significant tests',header=TRUE)
a<-table.element(a,'% significant tests',header=TRUE)
a<-table.element(a,'OK/NOK',header=TRUE)
a<-table.row.end(a)
a<-table.row.start(a)
a<-table.element(a,'1% type I error level',header=TRUE)
a<-table.element(a,signif(numsignificant1,6))
a<-table.element(a,signif(numsignificant1/numgqtests,6))
if (numsignificant1/numgqtests < 0.01) dum <- 'OK' else dum <- 'NOK'
a<-table.element(a,dum)
a<-table.row.end(a)
a<-table.row.start(a)
a<-table.element(a,'5% type I error level',header=TRUE)
a<-table.element(a,signif(numsignificant5,6))
a<-table.element(a,signif(numsignificant5/numgqtests,6))
if (numsignificant5/numgqtests < 0.05) dum <- 'OK' else dum <- 'NOK'
a<-table.element(a,dum)
a<-table.row.end(a)
a<-table.row.start(a)
a<-table.element(a,'10% type I error level',header=TRUE)
a<-table.element(a,signif(numsignificant10,6))
a<-table.element(a,signif(numsignificant10/numgqtests,6))
if (numsignificant10/numgqtests < 0.1) dum <- 'OK' else dum <- 'NOK'
a<-table.element(a,dum)
a<-table.row.end(a)
a<-table.end(a)
table.save(a,file='mytable6.tab')
}