Free Statistics

of Irreproducible Research!

Author's title

Author*The author of this computation has been verified*
R Software Modulerwasp_density.wasp
Title produced by softwareKernel Density Estimation
Date of computationTue, 16 Dec 2014 12:57:47 +0000
Cite this page as followsStatistical Computations at FreeStatistics.org, Office for Research Development and Education, URL https://freestatistics.org/blog/index.php?v=date/2014/Dec/16/t14187346806sp9as6lmh0w2lc.htm/, Retrieved Sun, 19 May 2024 16:38:41 +0000
Statistical Computations at FreeStatistics.org, Office for Research Development and Education, URL https://freestatistics.org/blog/index.php?pk=269452, Retrieved Sun, 19 May 2024 16:38:41 +0000
QR Codes:

Original text written by user:
IsPrivate?No (this computation is public)
User-defined keywords
Estimated Impact58
Family? (F = Feedback message, R = changed R code, M = changed R Module, P = changed Parameters, D = changed Data)
-       [Kernel Density Estimation] [] [2014-12-16 12:57:47] [6f1b1943390e6908ad1cf28c6ee297e8] [Current]
Feedback Forum

Post a new message
Dataseries X:
2.25892
-1.29359
-0.920014
-5.5369
-3.9301
-3.03206
0.803242
0.144455
0.207334
-4.96333
-3.26506
-5.01001
0.713676
-1.38976
5.29186
-1.50333
-0.645347
-1.22947
-4.36062
-3.04073
-6.41111
2.66673
-3.72189
-1.4437
-0.493127
-6.78728
0.82794
-0.98053
-2.83563
-2.34581
-3.02676
-2.22128
-1.21339
-3.31238
-1.8382
0.967164
-3.39549
-0.592319
-3.32082
-3.69849
-6.88915
-1.20984
-1.07223
-2.2627
-0.73295
-3.4012
-1.45618
-4.87817
1.61385
0.215291
-2.86699
-4.87056
-2.82001
1.30797
1.19333
-1.26289
-5.9648
3.41831
1.42682
2.44028
-1.71846
-1.57223
-6.43929
-0.730622
-2.37195
-1.00497
-3.50056
-2.89783
-0.226356
0.621659
-2.14961
-0.731829
-0.521855
0.560708
0.14111
-1.07223
1.43837
-0.796758
-3.51033
-5.06399
-2.42912
0.485059
-1.80269
-5.55018
-4.44373
-0.863355
0.225464
-2.01033
-3.68598
1.40941
0.741718
-5.71258
-2.58405
-2.55191
-6.31413
-2.48869
-4.31448
-1.06209
1.21339
-6.41604
-0.0229502
-0.710675
-2.30814
-4.18451
0.236184
-2.51068
-0.56445
-5.90941
-3.8701
-4.41413
-1.36526
-0.352548
-6.85416
-1.65857
4.32967
3.97903
3.86117
0.892669
2.22269
5.1284
2.10324
1.66783
3.1531
4.49829
-1.9124
-0.189148
3.50759
1.06244
4.05563
1.56244
0.859353
0.450244
1.10935
-0.317217
1.34258
-0.961596
4.30927
-2.20162
3.07762
3.1599
-0.182806
2.82627
0.603011
2.93143
2.60483
2.45342
0.584425
1.61117
0.656499
3.15016
-5.90039
2.35935
3.55269
2.52618
2.89267
1.61434
1.64788
2.76053
1.96022
-0.984939
2.38065
2.16261
2.75102
6.05313
4.27572
0.496705
2.28002
2.68823
1.71157
-0.70955
0.333504
5.21022
1.0561
3.58036
3.58036
4.83601
0.384742
5.1284
1.6803
-3.62932
-0.412865
-0.69278
5.20388
1.86094
-2.3469
3.33601
4.63633
-1.24151
-2.29183
1.06878
-1.15606
1.10912
-2.10733
2.30676
1.66624
3.01688
0.178487
1.86434
1.38904
2.70999
2.94255
1.96815
0.0560955
1.15785
-1.09192
3.01846
-1.25353
3.67328
2.80359
4.06244
0.922815
0.653328
-2.34056
2.04227
2.47903
-1.73993
3.43823
2.19866
-1.83263
1.28365
3.37976
-5.13136
-0.41399
2.30768
6.65402
0.69048
3.65673
3.43982
3.80722
2.97676
1.99875
5.58125
0.889499
-1.37319
-3.63748
-7.55566
0.64584
-0.0445387
0.81901
-1.28707
0.611169
-1.73358
0.785233
4.27572
-0.184161
1.73538
3.47745
-1.26849
2.93347
0.0325224
-1.71906
0.641314
1.61252
1.56356
-0.196845
4.08601
-3.7567
-3.86027
-0.0130382
-4.7882
0.496705
0.139499
-1.66059
0.785233
2.61071
0.266416
2.81742
-0.142923
3.9099
0.295437
2.33442
1.1429
2.81402
4.2603
-0.542289
1.6599
2.10754


Summary of computational transaction
Raw Inputview raw input (R code)
Raw Outputview raw output of R engine
Computing time4 seconds
R Server'Sir Ronald Aylmer Fisher' @ fisher.wessa.net
R Framework error message
Warning: there are blank lines in the 'Data' field.
Please, use NA for missing data - blank lines are simply
 deleted and are NOT treated as missing values.

\begin{tabular}{lllllllll}
\hline
Summary of computational transaction \tabularnewline
Raw Input & view raw input (R code)  \tabularnewline
Raw Output & view raw output of R engine  \tabularnewline
Computing time & 4 seconds \tabularnewline
R Server & 'Sir Ronald Aylmer Fisher' @ fisher.wessa.net \tabularnewline
R Framework error message & 
Warning: there are blank lines in the 'Data' field.
Please, use NA for missing data - blank lines are simply
 deleted and are NOT treated as missing values.
\tabularnewline \hline \end{tabular} %Source: https://freestatistics.org/blog/index.php?pk=269452&T=0

[TABLE]
[ROW][C]Summary of computational transaction[/C][/ROW]
[ROW][C]Raw Input[/C][C]view raw input (R code) [/C][/ROW]
[ROW][C]Raw Output[/C][C]view raw output of R engine [/C][/ROW]
[ROW][C]Computing time[/C][C]4 seconds[/C][/ROW]
[ROW][C]R Server[/C][C]'Sir Ronald Aylmer Fisher' @ fisher.wessa.net[/C][/ROW]
[ROW][C]R Framework error message[/C][C]
Warning: there are blank lines in the 'Data' field.
Please, use NA for missing data - blank lines are simply
 deleted and are NOT treated as missing values.
[/C][/ROW] [/TABLE] Source: https://freestatistics.org/blog/index.php?pk=269452&T=0

Globally Unique Identifier (entire table): ba.freestatistics.org/blog/index.php?pk=269452&T=0

As an alternative you can also use a QR Code:  

The GUIDs for individual cells are displayed in the table below:

Summary of computational transaction
Raw Inputview raw input (R code)
Raw Outputview raw output of R engine
Computing time4 seconds
R Server'Sir Ronald Aylmer Fisher' @ fisher.wessa.net
R Framework error message
Warning: there are blank lines in the 'Data' field.
Please, use NA for missing data - blank lines are simply
 deleted and are NOT treated as missing values.


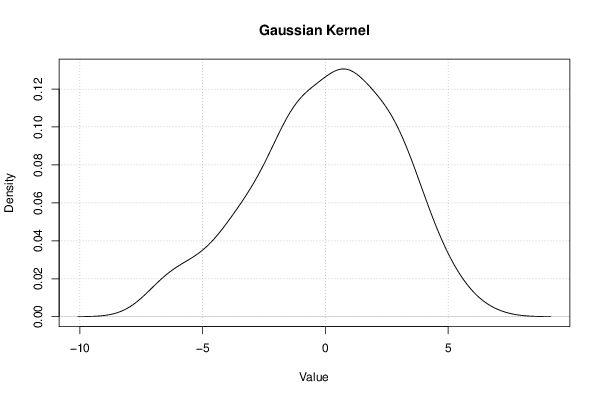
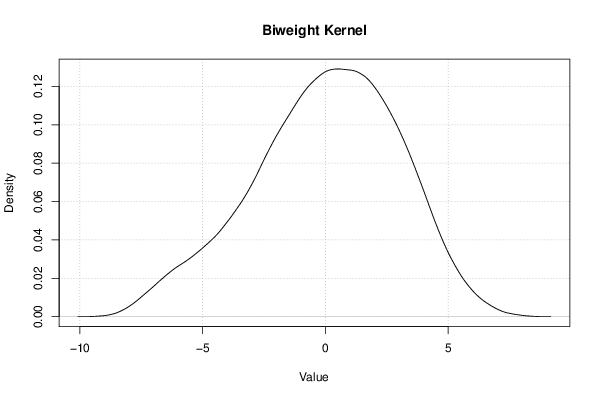
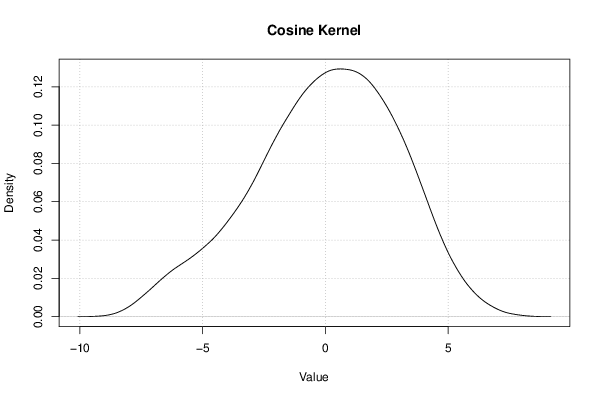
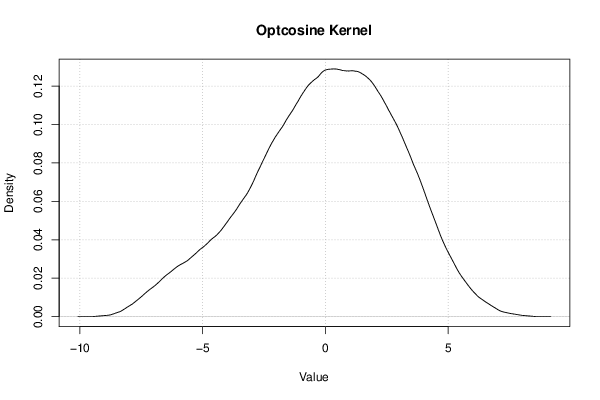
Properties of Density Trace
Bandwidth0.84196576113471
#Observations277

\begin{tabular}{lllllllll}
\hline
Properties of Density Trace \tabularnewline
Bandwidth & 0.84196576113471 \tabularnewline
#Observations & 277 \tabularnewline
\hline
\end{tabular}
%Source: https://freestatistics.org/blog/index.php?pk=269452&T=1

[TABLE]
[ROW][C]Properties of Density Trace[/C][/ROW]
[ROW][C]Bandwidth[/C][C]0.84196576113471[/C][/ROW]
[ROW][C]#Observations[/C][C]277[/C][/ROW]
[/TABLE]
Source: https://freestatistics.org/blog/index.php?pk=269452&T=1

Globally Unique Identifier (entire table): ba.freestatistics.org/blog/index.php?pk=269452&T=1

As an alternative you can also use a QR Code:  

The GUIDs for individual cells are displayed in the table below:

Properties of Density Trace
Bandwidth0.84196576113471
#Observations277


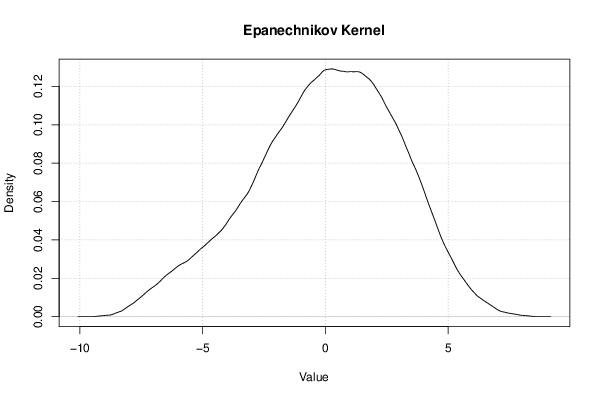
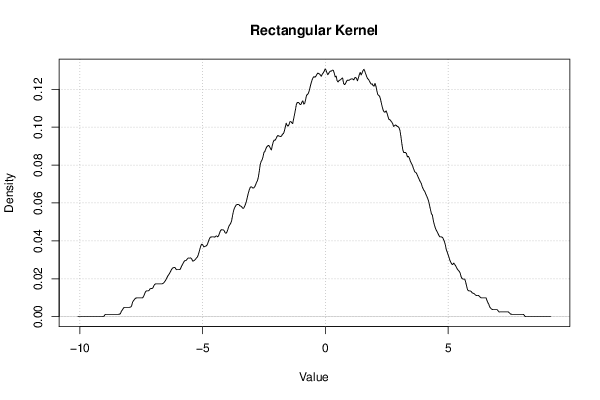
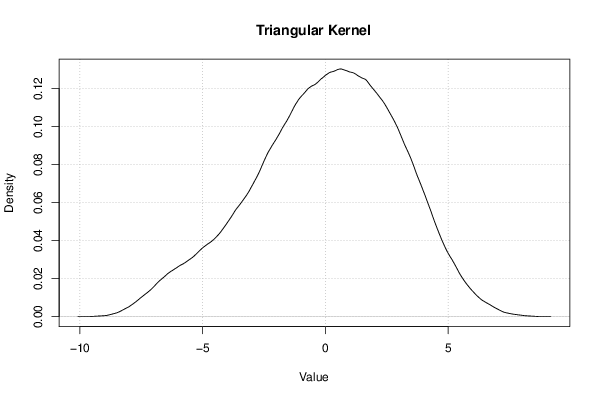
Maximum Density Values
Kernelx-valuemax. density
Gaussian0.7365311719265360.130590503987336
Epanechnikov0.2842069159545220.129095607408498
Rectangular-0.01734258802682120.130712997414411
Triangular0.6234501079335320.130392072191391
Biweight0.5103690439405280.129087761367425
Cosine0.5857564199358640.129302086566877
Optcosine0.3219006039521890.128933572104603

\begin{tabular}{lllllllll}
\hline
Maximum Density Values \tabularnewline
Kernel & x-value & max. density \tabularnewline
Gaussian & 0.736531171926536 & 0.130590503987336 \tabularnewline
Epanechnikov & 0.284206915954522 & 0.129095607408498 \tabularnewline
Rectangular & -0.0173425880268212 & 0.130712997414411 \tabularnewline
Triangular & 0.623450107933532 & 0.130392072191391 \tabularnewline
Biweight & 0.510369043940528 & 0.129087761367425 \tabularnewline
Cosine & 0.585756419935864 & 0.129302086566877 \tabularnewline
Optcosine & 0.321900603952189 & 0.128933572104603 \tabularnewline
\hline
\end{tabular}
%Source: https://freestatistics.org/blog/index.php?pk=269452&T=2

[TABLE]
[ROW][C]Maximum Density Values[/C][/ROW]
[ROW][C]Kernel[/C][C]x-value[/C][C]max. density[/C][/ROW]
[ROW][C]Gaussian[/C][C]0.736531171926536[/C][C]0.130590503987336[/C][/ROW]
[ROW][C]Epanechnikov[/C][C]0.284206915954522[/C][C]0.129095607408498[/C][/ROW]
[ROW][C]Rectangular[/C][C]-0.0173425880268212[/C][C]0.130712997414411[/C][/ROW]
[ROW][C]Triangular[/C][C]0.623450107933532[/C][C]0.130392072191391[/C][/ROW]
[ROW][C]Biweight[/C][C]0.510369043940528[/C][C]0.129087761367425[/C][/ROW]
[ROW][C]Cosine[/C][C]0.585756419935864[/C][C]0.129302086566877[/C][/ROW]
[ROW][C]Optcosine[/C][C]0.321900603952189[/C][C]0.128933572104603[/C][/ROW]
[/TABLE]
Source: https://freestatistics.org/blog/index.php?pk=269452&T=2

Globally Unique Identifier (entire table): ba.freestatistics.org/blog/index.php?pk=269452&T=2

As an alternative you can also use a QR Code:  

The GUIDs for individual cells are displayed in the table below:

Maximum Density Values
Kernelx-valuemax. density
Gaussian0.7365311719265360.130590503987336
Epanechnikov0.2842069159545220.129095607408498
Rectangular-0.01734258802682120.130712997414411
Triangular0.6234501079335320.130392072191391
Biweight0.5103690439405280.129087761367425
Cosine0.5857564199358640.129302086566877
Optcosine0.3219006039521890.128933572104603


Parameters (Session):
par1 = 0 ; par2 = no ; par3 = 512 ;
Parameters (R input):
par1 = 0 ; par2 = no ; par3 = 512 ;
R code (references can be found in the software module):
if (par1 == '0') bw <- 'nrd0'
if (par1 != '0') bw <- as.numeric(par1)
par3 <- as.numeric(par3)
mydensity <- array(NA, dim=c(par3,8))
bitmap(file='density1.png')
mydensity1<-density(x,bw=bw,kernel='gaussian',na.rm=TRUE)
mydensity[,8] = signif(mydensity1$x,3)
mydensity[,1] = signif(mydensity1$y,3)
plot(mydensity1,main='Gaussian Kernel',xlab=xlab,ylab=ylab)
grid()
dev.off()
mydensity1
bitmap(file='density2.png')
mydensity2<-density(x,bw=bw,kernel='epanechnikov',na.rm=TRUE)
mydensity[,2] = signif(mydensity2$y,3)
plot(mydensity2,main='Epanechnikov Kernel',xlab=xlab,ylab=ylab)
grid()
dev.off()
bitmap(file='density3.png')
mydensity3<-density(x,bw=bw,kernel='rectangular',na.rm=TRUE)
mydensity[,3] = signif(mydensity3$y,3)
plot(mydensity3,main='Rectangular Kernel',xlab=xlab,ylab=ylab)
grid()
dev.off()
bitmap(file='density4.png')
mydensity4<-density(x,bw=bw,kernel='triangular',na.rm=TRUE)
mydensity[,4] = signif(mydensity4$y,3)
plot(mydensity4,main='Triangular Kernel',xlab=xlab,ylab=ylab)
grid()
dev.off()
bitmap(file='density5.png')
mydensity5<-density(x,bw=bw,kernel='biweight',na.rm=TRUE)
mydensity[,5] = signif(mydensity5$y,3)
plot(mydensity5,main='Biweight Kernel',xlab=xlab,ylab=ylab)
grid()
dev.off()
bitmap(file='density6.png')
mydensity6<-density(x,bw=bw,kernel='cosine',na.rm=TRUE)
mydensity[,6] = signif(mydensity6$y,3)
plot(mydensity6,main='Cosine Kernel',xlab=xlab,ylab=ylab)
grid()
dev.off()
bitmap(file='density7.png')
mydensity7<-density(x,bw=bw,kernel='optcosine',na.rm=TRUE)
mydensity[,7] = signif(mydensity7$y,3)
plot(mydensity7,main='Optcosine Kernel',xlab=xlab,ylab=ylab)
grid()
dev.off()
load(file='createtable')
a<-table.start()
a<-table.row.start(a)
a<-table.element(a,'Properties of Density Trace',2,TRUE)
a<-table.row.end(a)
a<-table.row.start(a)
a<-table.element(a,'Bandwidth',header=TRUE)
a<-table.element(a,mydensity1$bw)
a<-table.row.end(a)
a<-table.row.start(a)
a<-table.element(a,'#Observations',header=TRUE)
a<-table.element(a,mydensity1$n)
a<-table.row.end(a)
a<-table.end(a)
table.save(a,file='mytable.tab')
a<-table.start()
a<-table.row.start(a)
a<-table.element(a,'Maximum Density Values',3,TRUE)
a<-table.row.end(a)
a<-table.row.start(a)
a<-table.element(a,'Kernel',1,TRUE)
a<-table.element(a,'x-value',1,TRUE)
a<-table.element(a,'max. density',1,TRUE)
a<-table.row.end(a)
a<-table.row.start(a)
a<-table.element(a,'Gaussian',1,TRUE)
a<-table.element(a,mydensity1$x[mydensity1$y==max(mydensity1$y)],1)
a<-table.element(a,mydensity1$y[mydensity1$y==max(mydensity1$y)],1)
a<-table.row.end(a)
a<-table.row.start(a)
a<-table.element(a,'Epanechnikov',1,TRUE)
a<-table.element(a,mydensity2$x[mydensity2$y==max(mydensity2$y)],1)
a<-table.element(a,mydensity2$y[mydensity2$y==max(mydensity2$y)],1)
a<-table.row.end(a)
a<-table.row.start(a)
a<-table.element(a,'Rectangular',1,TRUE)
a<-table.element(a,mydensity3$x[mydensity3$y==max(mydensity3$y)],1)
a<-table.element(a,mydensity3$y[mydensity3$y==max(mydensity3$y)],1)
a<-table.row.end(a)
a<-table.row.start(a)
a<-table.element(a,'Triangular',1,TRUE)
a<-table.element(a,mydensity4$x[mydensity4$y==max(mydensity4$y)],1)
a<-table.element(a,mydensity4$y[mydensity4$y==max(mydensity4$y)],1)
a<-table.row.end(a)
a<-table.row.start(a)
a<-table.element(a,'Biweight',1,TRUE)
a<-table.element(a,mydensity5$x[mydensity5$y==max(mydensity5$y)],1)
a<-table.element(a,mydensity5$y[mydensity5$y==max(mydensity5$y)],1)
a<-table.row.end(a)
a<-table.row.start(a)
a<-table.element(a,'Cosine',1,TRUE)
a<-table.element(a,mydensity6$x[mydensity6$y==max(mydensity6$y)],1)
a<-table.element(a,mydensity6$y[mydensity6$y==max(mydensity6$y)],1)
a<-table.row.end(a)
a<-table.row.start(a)
a<-table.element(a,'Optcosine',1,TRUE)
a<-table.element(a,mydensity7$x[mydensity7$y==max(mydensity7$y)],1)
a<-table.element(a,mydensity7$y[mydensity7$y==max(mydensity7$y)],1)
a<-table.row.end(a)
a<-table.end(a)
table.save(a,file='mytable2.tab')
if (par2=='yes') {
a<-table.start()
a<-table.row.start(a)
a<-table.element(a,'Kernel Density Values',8,TRUE)
a<-table.row.end(a)
a<-table.row.start(a)
a<-table.element(a,'x-value',1,TRUE)
a<-table.element(a,'Gaussian',1,TRUE)
a<-table.element(a,'Epanechnikov',1,TRUE)
a<-table.element(a,'Rectangular',1,TRUE)
a<-table.element(a,'Triangular',1,TRUE)
a<-table.element(a,'Biweight',1,TRUE)
a<-table.element(a,'Cosine',1,TRUE)
a<-table.element(a,'Optcosine',1,TRUE)
a<-table.row.end(a)
for(i in 1:par3) {
a<-table.row.start(a)
a<-table.element(a,mydensity[i,8],1,TRUE)
for(j in 1:7) {
a<-table.element(a,mydensity[i,j],1)
}
a<-table.row.end(a)
}
a<-table.end(a)
table.save(a,file='mytable1.tab')
}