Free Statistics

of Irreproducible Research!

Author's title

Author*The author of this computation has been verified*
R Software Modulerwasp_multipleregression.wasp
Title produced by softwareMultiple Regression
Date of computationTue, 16 Dec 2014 08:38:02 +0000
Cite this page as followsStatistical Computations at FreeStatistics.org, Office for Research Development and Education, URL https://freestatistics.org/blog/index.php?v=date/2014/Dec/16/t1418719122m8im5g660dykarl.htm/, Retrieved Sun, 19 May 2024 14:44:15 +0000
Statistical Computations at FreeStatistics.org, Office for Research Development and Education, URL https://freestatistics.org/blog/index.php?pk=269168, Retrieved Sun, 19 May 2024 14:44:15 +0000
QR Codes:

Original text written by user:
IsPrivate?No (this computation is public)
User-defined keywords
Estimated Impact86
Family? (F = Feedback message, R = changed R code, M = changed R Module, P = changed Parameters, D = changed Data)
-       [Multiple Regression] [] [2014-12-16 08:38:02] [c7f962214140f976f2c4b1bb2571d9df] [Current]
Feedback Forum

Post a new message
Dataseries X:
-5 1146
0 278
1 108
2 78
3 42
4 35
5 43
6 45
7 27
8 47
9 26
10 29
11 53
12 24
13 43
14 54
15 66
16 94
17 120
18 156
19 180
20 182
21 222
22 170
23 194
24 210
25 226
26 202
27 213
28 251
29 258
30 274
31 253
32 290
33 281
34 313
35 323
36 374
37 397
38 451
39 510
40 555
41 577
42 685
43 743
44 810
45 930
46 1075
47 1125
48 1239
49 1372
50 1549
51 1658
52 1920
53 2015
54 2276
55 2260
56 2637
57 2655
58 2950
59 3120
60 3290
61 3469
62 3635
63 3835
64 4157
65 4315
66 4351
67 4244
68 4309
69 4266
70 4492
71 4973
72 5747
73 6354
74 6541
75 7035
76 7684
77 8338
78 9352
79 10097
80 11189
81 11542
82 12090
83 12313
84 12717
85 13240
86 13270
87 13161
88 12810
89 11963
90 10756
91 9163
92 6601
93 4552
94 3368
95 3035
96 2686
97 2261
98 1699
99 1186
100 795
101 527
102 319
103 178
104 232


Summary of computational transaction
Raw Inputview raw input (R code)
Raw Outputview raw output of R engine
Computing time5 seconds
R Server'Sir Maurice George Kendall' @ kendall.wessa.net

\begin{tabular}{lllllllll}
\hline
Summary of computational transaction \tabularnewline
Raw Input & view raw input (R code)  \tabularnewline
Raw Output & view raw output of R engine  \tabularnewline
Computing time & 5 seconds \tabularnewline
R Server & 'Sir Maurice George Kendall' @ kendall.wessa.net \tabularnewline
\hline
\end{tabular}
%Source: https://freestatistics.org/blog/index.php?pk=269168&T=0

[TABLE]
[ROW][C]Summary of computational transaction[/C][/ROW]
[ROW][C]Raw Input[/C][C]view raw input (R code) [/C][/ROW]
[ROW][C]Raw Output[/C][C]view raw output of R engine [/C][/ROW]
[ROW][C]Computing time[/C][C]5 seconds[/C][/ROW]
[ROW][C]R Server[/C][C]'Sir Maurice George Kendall' @ kendall.wessa.net[/C][/ROW]
[/TABLE]
Source: https://freestatistics.org/blog/index.php?pk=269168&T=0

Globally Unique Identifier (entire table): ba.freestatistics.org/blog/index.php?pk=269168&T=0

As an alternative you can also use a QR Code:  

The GUIDs for individual cells are displayed in the table below:

Summary of computational transaction
Raw Inputview raw input (R code)
Raw Outputview raw output of R engine
Computing time5 seconds
R Server'Sir Maurice George Kendall' @ kendall.wessa.net


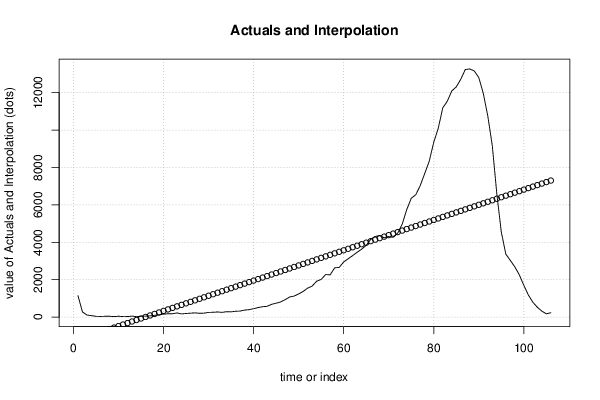
Multiple Linear Regression - Estimated Regression Equation
dx_BE[t] = -1127.98 + 81.0526x_BE[t] + e[t]

\begin{tabular}{lllllllll}
\hline
Multiple Linear Regression - Estimated Regression Equation \tabularnewline
dx_BE[t] =  -1127.98 +  81.0526x_BE[t]  + e[t] \tabularnewline
\hline
\end{tabular}
%Source: https://freestatistics.org/blog/index.php?pk=269168&T=1

[TABLE]
[ROW][C]Multiple Linear Regression - Estimated Regression Equation[/C][/ROW]
[ROW][C]dx_BE[t] =  -1127.98 +  81.0526x_BE[t]  + e[t][/C][/ROW]
[/TABLE]
Source: https://freestatistics.org/blog/index.php?pk=269168&T=1

Globally Unique Identifier (entire table): ba.freestatistics.org/blog/index.php?pk=269168&T=1

As an alternative you can also use a QR Code:  

The GUIDs for individual cells are displayed in the table below:

Multiple Linear Regression - Estimated Regression Equation
dx_BE[t] = -1127.98 + 81.0526x_BE[t] + e[t]


Multiple Linear Regression - Ordinary Least Squares
VariableParameterS.D.T-STATH0: parameter = 02-tail p-value1-tail p-value
(Intercept)-1127.98580.161-1.9440.05456650.0272832
x_BE81.05269.684538.3692.85412e-131.42706e-13

\begin{tabular}{lllllllll}
\hline
Multiple Linear Regression - Ordinary Least Squares \tabularnewline
Variable & Parameter & S.D. & T-STATH0: parameter = 0 & 2-tail p-value & 1-tail p-value \tabularnewline
(Intercept) & -1127.98 & 580.161 & -1.944 & 0.0545665 & 0.0272832 \tabularnewline
x_BE & 81.0526 & 9.68453 & 8.369 & 2.85412e-13 & 1.42706e-13 \tabularnewline
\hline
\end{tabular}
%Source: https://freestatistics.org/blog/index.php?pk=269168&T=2

[TABLE]
[ROW][C]Multiple Linear Regression - Ordinary Least Squares[/C][/ROW]
[ROW][C]Variable[/C][C]Parameter[/C][C]S.D.[/C][C]T-STATH0: parameter = 0[/C][C]2-tail p-value[/C][C]1-tail p-value[/C][/ROW]
[ROW][C](Intercept)[/C][C]-1127.98[/C][C]580.161[/C][C]-1.944[/C][C]0.0545665[/C][C]0.0272832[/C][/ROW]
[ROW][C]x_BE[/C][C]81.0526[/C][C]9.68453[/C][C]8.369[/C][C]2.85412e-13[/C][C]1.42706e-13[/C][/ROW]
[/TABLE]
Source: https://freestatistics.org/blog/index.php?pk=269168&T=2

Globally Unique Identifier (entire table): ba.freestatistics.org/blog/index.php?pk=269168&T=2

As an alternative you can also use a QR Code:  

The GUIDs for individual cells are displayed in the table below:

Multiple Linear Regression - Ordinary Least Squares
VariableParameterS.D.T-STATH0: parameter = 02-tail p-value1-tail p-value
(Intercept)-1127.98580.161-1.9440.05456650.0272832
x_BE81.05269.684538.3692.85412e-131.42706e-13


Multiple Linear Regression - Regression Statistics
Multiple R0.634392
R-squared0.402453
Adjusted R-squared0.396708
F-TEST (value)70.045
F-TEST (DF numerator)1
F-TEST (DF denominator)104
p-value2.85438e-13
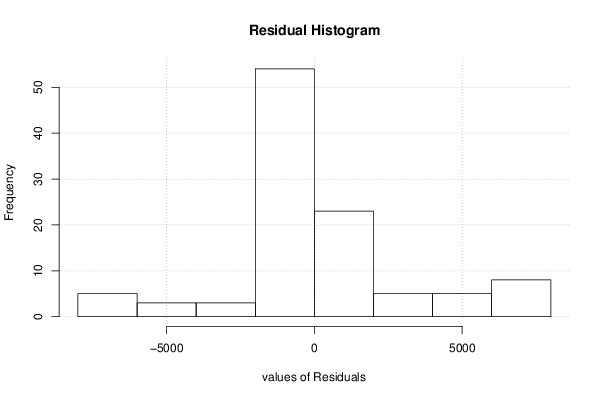
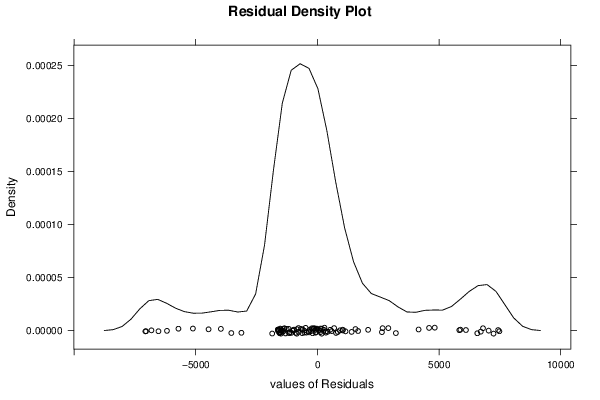
Multiple Linear Regression - Residual Statistics
Residual Standard Deviation3057.59
Sum Squared Residuals972279000

\begin{tabular}{lllllllll}
\hline
Multiple Linear Regression - Regression Statistics \tabularnewline
Multiple R & 0.634392 \tabularnewline
R-squared & 0.402453 \tabularnewline
Adjusted R-squared & 0.396708 \tabularnewline
F-TEST (value) & 70.045 \tabularnewline
F-TEST (DF numerator) & 1 \tabularnewline
F-TEST (DF denominator) & 104 \tabularnewline
p-value & 2.85438e-13 \tabularnewline
Multiple Linear Regression - Residual Statistics \tabularnewline
Residual Standard Deviation & 3057.59 \tabularnewline
Sum Squared Residuals & 972279000 \tabularnewline
\hline
\end{tabular}
%Source: https://freestatistics.org/blog/index.php?pk=269168&T=3

[TABLE]
[ROW][C]Multiple Linear Regression - Regression Statistics[/C][/ROW]
[ROW][C]Multiple R[/C][C]0.634392[/C][/ROW]
[ROW][C]R-squared[/C][C]0.402453[/C][/ROW]
[ROW][C]Adjusted R-squared[/C][C]0.396708[/C][/ROW]
[ROW][C]F-TEST (value)[/C][C]70.045[/C][/ROW]
[ROW][C]F-TEST (DF numerator)[/C][C]1[/C][/ROW]
[ROW][C]F-TEST (DF denominator)[/C][C]104[/C][/ROW]
[ROW][C]p-value[/C][C]2.85438e-13[/C][/ROW]
[ROW][C]Multiple Linear Regression - Residual Statistics[/C][/ROW]
[ROW][C]Residual Standard Deviation[/C][C]3057.59[/C][/ROW]
[ROW][C]Sum Squared Residuals[/C][C]972279000[/C][/ROW]
[/TABLE]
Source: https://freestatistics.org/blog/index.php?pk=269168&T=3

Globally Unique Identifier (entire table): ba.freestatistics.org/blog/index.php?pk=269168&T=3

As an alternative you can also use a QR Code:  

The GUIDs for individual cells are displayed in the table below:

Multiple Linear Regression - Regression Statistics
Multiple R0.634392
R-squared0.402453
Adjusted R-squared0.396708
F-TEST (value)70.045
F-TEST (DF numerator)1
F-TEST (DF denominator)104
p-value2.85438e-13
Multiple Linear Regression - Residual Statistics
Residual Standard Deviation3057.59
Sum Squared Residuals972279000


Multiple Linear Regression - Actuals, Interpolation, and Residuals
Time or IndexActualsInterpolationForecastResidualsPrediction Error
11146-1533.242679.24
2278-1127.981405.98
3108-1046.931154.93
478-965.8741043.87
542-884.822926.822
635-803.769838.769
743-722.717765.717
845-641.664686.664
927-560.612587.612
1047-479.559526.559
1126-398.506424.506
1229-317.454346.454
1353-236.401289.401
1424-155.349179.349
1543-74.2961117.296
16546.7565347.2435
176687.8091-21.8091
1894168.862-74.8617
19120249.914-129.914
20156330.967-174.967
21180412.019-232.019
22182493.072-311.072
23222574.125-352.125
24170655.177-485.177
25194736.23-542.23
26210817.282-607.282
27226898.335-672.335
28202979.388-777.388
292131060.44-847.44
302511141.49-890.493
312581222.55-964.545
322741303.6-1029.6
332531384.65-1131.65
342901465.7-1175.7
352811546.76-1265.76
363131627.81-1314.81
373231708.86-1385.86
383741789.91-1415.91
393971870.97-1473.97
404511952.02-1501.02
415102033.07-1523.07
425552114.12-1559.12
435772195.18-1618.18
446852276.23-1591.23
457432357.28-1614.28
468102438.33-1628.33
479302519.39-1589.39
4810752600.44-1525.44
4911252681.49-1556.49
5012392762.54-1523.54
5113722843.6-1471.6
5215492924.65-1375.65
5316583005.7-1347.7
5419203086.75-1166.75
5520153167.81-1152.81
5622763248.86-972.86
5722603329.91-1069.91
5826373410.97-773.965
5926553492.02-837.018
6029503573.07-623.07
6131203654.12-534.123
6232903735.18-445.175
6334693816.23-347.228
6436353897.28-262.281
6538353978.33-143.333
6641574059.3997.6143
6743154140.44174.562
6843514221.49129.509
6942444302.54-58.5434
7043094383.6-74.596
7142664464.65-198.649
7244924545.7-53.7012
7349734626.75346.246
7457474707.811039.19
7563544788.861565.14
7665414869.911671.09
7770354950.962084.04
7876845032.022651.98
7983385113.073224.93
8093525194.124157.88
81100975275.174821.83
82111895356.235832.77
83115425437.286104.72
84120905518.336571.67
85123135599.386713.62
86127175680.447036.56
87132405761.497478.51
88132705842.547427.46
89131615923.67237.4
90128106004.656805.35
91119636085.75877.3
92107566166.754589.25
9391636247.812915.19
9466016328.86272.142
9545526409.91-1857.91
9633686490.96-3122.96
9730356572.02-3537.02
9826866653.07-3967.07
9922616734.12-4473.12
10016996815.17-5116.17
10111866896.23-5710.23
1027956977.28-6182.28
1035277058.33-6531.33
1043197139.38-6820.38
1051787220.44-7042.44
1062327301.49-7069.49

\begin{tabular}{lllllllll}
\hline
Multiple Linear Regression - Actuals, Interpolation, and Residuals \tabularnewline
Time or Index & Actuals & InterpolationForecast & ResidualsPrediction Error \tabularnewline
1 & 1146 & -1533.24 & 2679.24 \tabularnewline
2 & 278 & -1127.98 & 1405.98 \tabularnewline
3 & 108 & -1046.93 & 1154.93 \tabularnewline
4 & 78 & -965.874 & 1043.87 \tabularnewline
5 & 42 & -884.822 & 926.822 \tabularnewline
6 & 35 & -803.769 & 838.769 \tabularnewline
7 & 43 & -722.717 & 765.717 \tabularnewline
8 & 45 & -641.664 & 686.664 \tabularnewline
9 & 27 & -560.612 & 587.612 \tabularnewline
10 & 47 & -479.559 & 526.559 \tabularnewline
11 & 26 & -398.506 & 424.506 \tabularnewline
12 & 29 & -317.454 & 346.454 \tabularnewline
13 & 53 & -236.401 & 289.401 \tabularnewline
14 & 24 & -155.349 & 179.349 \tabularnewline
15 & 43 & -74.2961 & 117.296 \tabularnewline
16 & 54 & 6.75653 & 47.2435 \tabularnewline
17 & 66 & 87.8091 & -21.8091 \tabularnewline
18 & 94 & 168.862 & -74.8617 \tabularnewline
19 & 120 & 249.914 & -129.914 \tabularnewline
20 & 156 & 330.967 & -174.967 \tabularnewline
21 & 180 & 412.019 & -232.019 \tabularnewline
22 & 182 & 493.072 & -311.072 \tabularnewline
23 & 222 & 574.125 & -352.125 \tabularnewline
24 & 170 & 655.177 & -485.177 \tabularnewline
25 & 194 & 736.23 & -542.23 \tabularnewline
26 & 210 & 817.282 & -607.282 \tabularnewline
27 & 226 & 898.335 & -672.335 \tabularnewline
28 & 202 & 979.388 & -777.388 \tabularnewline
29 & 213 & 1060.44 & -847.44 \tabularnewline
30 & 251 & 1141.49 & -890.493 \tabularnewline
31 & 258 & 1222.55 & -964.545 \tabularnewline
32 & 274 & 1303.6 & -1029.6 \tabularnewline
33 & 253 & 1384.65 & -1131.65 \tabularnewline
34 & 290 & 1465.7 & -1175.7 \tabularnewline
35 & 281 & 1546.76 & -1265.76 \tabularnewline
36 & 313 & 1627.81 & -1314.81 \tabularnewline
37 & 323 & 1708.86 & -1385.86 \tabularnewline
38 & 374 & 1789.91 & -1415.91 \tabularnewline
39 & 397 & 1870.97 & -1473.97 \tabularnewline
40 & 451 & 1952.02 & -1501.02 \tabularnewline
41 & 510 & 2033.07 & -1523.07 \tabularnewline
42 & 555 & 2114.12 & -1559.12 \tabularnewline
43 & 577 & 2195.18 & -1618.18 \tabularnewline
44 & 685 & 2276.23 & -1591.23 \tabularnewline
45 & 743 & 2357.28 & -1614.28 \tabularnewline
46 & 810 & 2438.33 & -1628.33 \tabularnewline
47 & 930 & 2519.39 & -1589.39 \tabularnewline
48 & 1075 & 2600.44 & -1525.44 \tabularnewline
49 & 1125 & 2681.49 & -1556.49 \tabularnewline
50 & 1239 & 2762.54 & -1523.54 \tabularnewline
51 & 1372 & 2843.6 & -1471.6 \tabularnewline
52 & 1549 & 2924.65 & -1375.65 \tabularnewline
53 & 1658 & 3005.7 & -1347.7 \tabularnewline
54 & 1920 & 3086.75 & -1166.75 \tabularnewline
55 & 2015 & 3167.81 & -1152.81 \tabularnewline
56 & 2276 & 3248.86 & -972.86 \tabularnewline
57 & 2260 & 3329.91 & -1069.91 \tabularnewline
58 & 2637 & 3410.97 & -773.965 \tabularnewline
59 & 2655 & 3492.02 & -837.018 \tabularnewline
60 & 2950 & 3573.07 & -623.07 \tabularnewline
61 & 3120 & 3654.12 & -534.123 \tabularnewline
62 & 3290 & 3735.18 & -445.175 \tabularnewline
63 & 3469 & 3816.23 & -347.228 \tabularnewline
64 & 3635 & 3897.28 & -262.281 \tabularnewline
65 & 3835 & 3978.33 & -143.333 \tabularnewline
66 & 4157 & 4059.39 & 97.6143 \tabularnewline
67 & 4315 & 4140.44 & 174.562 \tabularnewline
68 & 4351 & 4221.49 & 129.509 \tabularnewline
69 & 4244 & 4302.54 & -58.5434 \tabularnewline
70 & 4309 & 4383.6 & -74.596 \tabularnewline
71 & 4266 & 4464.65 & -198.649 \tabularnewline
72 & 4492 & 4545.7 & -53.7012 \tabularnewline
73 & 4973 & 4626.75 & 346.246 \tabularnewline
74 & 5747 & 4707.81 & 1039.19 \tabularnewline
75 & 6354 & 4788.86 & 1565.14 \tabularnewline
76 & 6541 & 4869.91 & 1671.09 \tabularnewline
77 & 7035 & 4950.96 & 2084.04 \tabularnewline
78 & 7684 & 5032.02 & 2651.98 \tabularnewline
79 & 8338 & 5113.07 & 3224.93 \tabularnewline
80 & 9352 & 5194.12 & 4157.88 \tabularnewline
81 & 10097 & 5275.17 & 4821.83 \tabularnewline
82 & 11189 & 5356.23 & 5832.77 \tabularnewline
83 & 11542 & 5437.28 & 6104.72 \tabularnewline
84 & 12090 & 5518.33 & 6571.67 \tabularnewline
85 & 12313 & 5599.38 & 6713.62 \tabularnewline
86 & 12717 & 5680.44 & 7036.56 \tabularnewline
87 & 13240 & 5761.49 & 7478.51 \tabularnewline
88 & 13270 & 5842.54 & 7427.46 \tabularnewline
89 & 13161 & 5923.6 & 7237.4 \tabularnewline
90 & 12810 & 6004.65 & 6805.35 \tabularnewline
91 & 11963 & 6085.7 & 5877.3 \tabularnewline
92 & 10756 & 6166.75 & 4589.25 \tabularnewline
93 & 9163 & 6247.81 & 2915.19 \tabularnewline
94 & 6601 & 6328.86 & 272.142 \tabularnewline
95 & 4552 & 6409.91 & -1857.91 \tabularnewline
96 & 3368 & 6490.96 & -3122.96 \tabularnewline
97 & 3035 & 6572.02 & -3537.02 \tabularnewline
98 & 2686 & 6653.07 & -3967.07 \tabularnewline
99 & 2261 & 6734.12 & -4473.12 \tabularnewline
100 & 1699 & 6815.17 & -5116.17 \tabularnewline
101 & 1186 & 6896.23 & -5710.23 \tabularnewline
102 & 795 & 6977.28 & -6182.28 \tabularnewline
103 & 527 & 7058.33 & -6531.33 \tabularnewline
104 & 319 & 7139.38 & -6820.38 \tabularnewline
105 & 178 & 7220.44 & -7042.44 \tabularnewline
106 & 232 & 7301.49 & -7069.49 \tabularnewline
\hline
\end{tabular}
%Source: https://freestatistics.org/blog/index.php?pk=269168&T=4

[TABLE]
[ROW][C]Multiple Linear Regression - Actuals, Interpolation, and Residuals[/C][/ROW]
[ROW][C]Time or Index[/C][C]Actuals[/C][C]InterpolationForecast[/C][C]ResidualsPrediction Error[/C][/ROW]
[ROW][C]1[/C][C]1146[/C][C]-1533.24[/C][C]2679.24[/C][/ROW]
[ROW][C]2[/C][C]278[/C][C]-1127.98[/C][C]1405.98[/C][/ROW]
[ROW][C]3[/C][C]108[/C][C]-1046.93[/C][C]1154.93[/C][/ROW]
[ROW][C]4[/C][C]78[/C][C]-965.874[/C][C]1043.87[/C][/ROW]
[ROW][C]5[/C][C]42[/C][C]-884.822[/C][C]926.822[/C][/ROW]
[ROW][C]6[/C][C]35[/C][C]-803.769[/C][C]838.769[/C][/ROW]
[ROW][C]7[/C][C]43[/C][C]-722.717[/C][C]765.717[/C][/ROW]
[ROW][C]8[/C][C]45[/C][C]-641.664[/C][C]686.664[/C][/ROW]
[ROW][C]9[/C][C]27[/C][C]-560.612[/C][C]587.612[/C][/ROW]
[ROW][C]10[/C][C]47[/C][C]-479.559[/C][C]526.559[/C][/ROW]
[ROW][C]11[/C][C]26[/C][C]-398.506[/C][C]424.506[/C][/ROW]
[ROW][C]12[/C][C]29[/C][C]-317.454[/C][C]346.454[/C][/ROW]
[ROW][C]13[/C][C]53[/C][C]-236.401[/C][C]289.401[/C][/ROW]
[ROW][C]14[/C][C]24[/C][C]-155.349[/C][C]179.349[/C][/ROW]
[ROW][C]15[/C][C]43[/C][C]-74.2961[/C][C]117.296[/C][/ROW]
[ROW][C]16[/C][C]54[/C][C]6.75653[/C][C]47.2435[/C][/ROW]
[ROW][C]17[/C][C]66[/C][C]87.8091[/C][C]-21.8091[/C][/ROW]
[ROW][C]18[/C][C]94[/C][C]168.862[/C][C]-74.8617[/C][/ROW]
[ROW][C]19[/C][C]120[/C][C]249.914[/C][C]-129.914[/C][/ROW]
[ROW][C]20[/C][C]156[/C][C]330.967[/C][C]-174.967[/C][/ROW]
[ROW][C]21[/C][C]180[/C][C]412.019[/C][C]-232.019[/C][/ROW]
[ROW][C]22[/C][C]182[/C][C]493.072[/C][C]-311.072[/C][/ROW]
[ROW][C]23[/C][C]222[/C][C]574.125[/C][C]-352.125[/C][/ROW]
[ROW][C]24[/C][C]170[/C][C]655.177[/C][C]-485.177[/C][/ROW]
[ROW][C]25[/C][C]194[/C][C]736.23[/C][C]-542.23[/C][/ROW]
[ROW][C]26[/C][C]210[/C][C]817.282[/C][C]-607.282[/C][/ROW]
[ROW][C]27[/C][C]226[/C][C]898.335[/C][C]-672.335[/C][/ROW]
[ROW][C]28[/C][C]202[/C][C]979.388[/C][C]-777.388[/C][/ROW]
[ROW][C]29[/C][C]213[/C][C]1060.44[/C][C]-847.44[/C][/ROW]
[ROW][C]30[/C][C]251[/C][C]1141.49[/C][C]-890.493[/C][/ROW]
[ROW][C]31[/C][C]258[/C][C]1222.55[/C][C]-964.545[/C][/ROW]
[ROW][C]32[/C][C]274[/C][C]1303.6[/C][C]-1029.6[/C][/ROW]
[ROW][C]33[/C][C]253[/C][C]1384.65[/C][C]-1131.65[/C][/ROW]
[ROW][C]34[/C][C]290[/C][C]1465.7[/C][C]-1175.7[/C][/ROW]
[ROW][C]35[/C][C]281[/C][C]1546.76[/C][C]-1265.76[/C][/ROW]
[ROW][C]36[/C][C]313[/C][C]1627.81[/C][C]-1314.81[/C][/ROW]
[ROW][C]37[/C][C]323[/C][C]1708.86[/C][C]-1385.86[/C][/ROW]
[ROW][C]38[/C][C]374[/C][C]1789.91[/C][C]-1415.91[/C][/ROW]
[ROW][C]39[/C][C]397[/C][C]1870.97[/C][C]-1473.97[/C][/ROW]
[ROW][C]40[/C][C]451[/C][C]1952.02[/C][C]-1501.02[/C][/ROW]
[ROW][C]41[/C][C]510[/C][C]2033.07[/C][C]-1523.07[/C][/ROW]
[ROW][C]42[/C][C]555[/C][C]2114.12[/C][C]-1559.12[/C][/ROW]
[ROW][C]43[/C][C]577[/C][C]2195.18[/C][C]-1618.18[/C][/ROW]
[ROW][C]44[/C][C]685[/C][C]2276.23[/C][C]-1591.23[/C][/ROW]
[ROW][C]45[/C][C]743[/C][C]2357.28[/C][C]-1614.28[/C][/ROW]
[ROW][C]46[/C][C]810[/C][C]2438.33[/C][C]-1628.33[/C][/ROW]
[ROW][C]47[/C][C]930[/C][C]2519.39[/C][C]-1589.39[/C][/ROW]
[ROW][C]48[/C][C]1075[/C][C]2600.44[/C][C]-1525.44[/C][/ROW]
[ROW][C]49[/C][C]1125[/C][C]2681.49[/C][C]-1556.49[/C][/ROW]
[ROW][C]50[/C][C]1239[/C][C]2762.54[/C][C]-1523.54[/C][/ROW]
[ROW][C]51[/C][C]1372[/C][C]2843.6[/C][C]-1471.6[/C][/ROW]
[ROW][C]52[/C][C]1549[/C][C]2924.65[/C][C]-1375.65[/C][/ROW]
[ROW][C]53[/C][C]1658[/C][C]3005.7[/C][C]-1347.7[/C][/ROW]
[ROW][C]54[/C][C]1920[/C][C]3086.75[/C][C]-1166.75[/C][/ROW]
[ROW][C]55[/C][C]2015[/C][C]3167.81[/C][C]-1152.81[/C][/ROW]
[ROW][C]56[/C][C]2276[/C][C]3248.86[/C][C]-972.86[/C][/ROW]
[ROW][C]57[/C][C]2260[/C][C]3329.91[/C][C]-1069.91[/C][/ROW]
[ROW][C]58[/C][C]2637[/C][C]3410.97[/C][C]-773.965[/C][/ROW]
[ROW][C]59[/C][C]2655[/C][C]3492.02[/C][C]-837.018[/C][/ROW]
[ROW][C]60[/C][C]2950[/C][C]3573.07[/C][C]-623.07[/C][/ROW]
[ROW][C]61[/C][C]3120[/C][C]3654.12[/C][C]-534.123[/C][/ROW]
[ROW][C]62[/C][C]3290[/C][C]3735.18[/C][C]-445.175[/C][/ROW]
[ROW][C]63[/C][C]3469[/C][C]3816.23[/C][C]-347.228[/C][/ROW]
[ROW][C]64[/C][C]3635[/C][C]3897.28[/C][C]-262.281[/C][/ROW]
[ROW][C]65[/C][C]3835[/C][C]3978.33[/C][C]-143.333[/C][/ROW]
[ROW][C]66[/C][C]4157[/C][C]4059.39[/C][C]97.6143[/C][/ROW]
[ROW][C]67[/C][C]4315[/C][C]4140.44[/C][C]174.562[/C][/ROW]
[ROW][C]68[/C][C]4351[/C][C]4221.49[/C][C]129.509[/C][/ROW]
[ROW][C]69[/C][C]4244[/C][C]4302.54[/C][C]-58.5434[/C][/ROW]
[ROW][C]70[/C][C]4309[/C][C]4383.6[/C][C]-74.596[/C][/ROW]
[ROW][C]71[/C][C]4266[/C][C]4464.65[/C][C]-198.649[/C][/ROW]
[ROW][C]72[/C][C]4492[/C][C]4545.7[/C][C]-53.7012[/C][/ROW]
[ROW][C]73[/C][C]4973[/C][C]4626.75[/C][C]346.246[/C][/ROW]
[ROW][C]74[/C][C]5747[/C][C]4707.81[/C][C]1039.19[/C][/ROW]
[ROW][C]75[/C][C]6354[/C][C]4788.86[/C][C]1565.14[/C][/ROW]
[ROW][C]76[/C][C]6541[/C][C]4869.91[/C][C]1671.09[/C][/ROW]
[ROW][C]77[/C][C]7035[/C][C]4950.96[/C][C]2084.04[/C][/ROW]
[ROW][C]78[/C][C]7684[/C][C]5032.02[/C][C]2651.98[/C][/ROW]
[ROW][C]79[/C][C]8338[/C][C]5113.07[/C][C]3224.93[/C][/ROW]
[ROW][C]80[/C][C]9352[/C][C]5194.12[/C][C]4157.88[/C][/ROW]
[ROW][C]81[/C][C]10097[/C][C]5275.17[/C][C]4821.83[/C][/ROW]
[ROW][C]82[/C][C]11189[/C][C]5356.23[/C][C]5832.77[/C][/ROW]
[ROW][C]83[/C][C]11542[/C][C]5437.28[/C][C]6104.72[/C][/ROW]
[ROW][C]84[/C][C]12090[/C][C]5518.33[/C][C]6571.67[/C][/ROW]
[ROW][C]85[/C][C]12313[/C][C]5599.38[/C][C]6713.62[/C][/ROW]
[ROW][C]86[/C][C]12717[/C][C]5680.44[/C][C]7036.56[/C][/ROW]
[ROW][C]87[/C][C]13240[/C][C]5761.49[/C][C]7478.51[/C][/ROW]
[ROW][C]88[/C][C]13270[/C][C]5842.54[/C][C]7427.46[/C][/ROW]
[ROW][C]89[/C][C]13161[/C][C]5923.6[/C][C]7237.4[/C][/ROW]
[ROW][C]90[/C][C]12810[/C][C]6004.65[/C][C]6805.35[/C][/ROW]
[ROW][C]91[/C][C]11963[/C][C]6085.7[/C][C]5877.3[/C][/ROW]
[ROW][C]92[/C][C]10756[/C][C]6166.75[/C][C]4589.25[/C][/ROW]
[ROW][C]93[/C][C]9163[/C][C]6247.81[/C][C]2915.19[/C][/ROW]
[ROW][C]94[/C][C]6601[/C][C]6328.86[/C][C]272.142[/C][/ROW]
[ROW][C]95[/C][C]4552[/C][C]6409.91[/C][C]-1857.91[/C][/ROW]
[ROW][C]96[/C][C]3368[/C][C]6490.96[/C][C]-3122.96[/C][/ROW]
[ROW][C]97[/C][C]3035[/C][C]6572.02[/C][C]-3537.02[/C][/ROW]
[ROW][C]98[/C][C]2686[/C][C]6653.07[/C][C]-3967.07[/C][/ROW]
[ROW][C]99[/C][C]2261[/C][C]6734.12[/C][C]-4473.12[/C][/ROW]
[ROW][C]100[/C][C]1699[/C][C]6815.17[/C][C]-5116.17[/C][/ROW]
[ROW][C]101[/C][C]1186[/C][C]6896.23[/C][C]-5710.23[/C][/ROW]
[ROW][C]102[/C][C]795[/C][C]6977.28[/C][C]-6182.28[/C][/ROW]
[ROW][C]103[/C][C]527[/C][C]7058.33[/C][C]-6531.33[/C][/ROW]
[ROW][C]104[/C][C]319[/C][C]7139.38[/C][C]-6820.38[/C][/ROW]
[ROW][C]105[/C][C]178[/C][C]7220.44[/C][C]-7042.44[/C][/ROW]
[ROW][C]106[/C][C]232[/C][C]7301.49[/C][C]-7069.49[/C][/ROW]
[/TABLE]
Source: https://freestatistics.org/blog/index.php?pk=269168&T=4

Globally Unique Identifier (entire table): ba.freestatistics.org/blog/index.php?pk=269168&T=4

As an alternative you can also use a QR Code:  

The GUIDs for individual cells are displayed in the table below:

Multiple Linear Regression - Actuals, Interpolation, and Residuals
Time or IndexActualsInterpolationForecastResidualsPrediction Error
11146-1533.242679.24
2278-1127.981405.98
3108-1046.931154.93
478-965.8741043.87
542-884.822926.822
635-803.769838.769
743-722.717765.717
845-641.664686.664
927-560.612587.612
1047-479.559526.559
1126-398.506424.506
1229-317.454346.454
1353-236.401289.401
1424-155.349179.349
1543-74.2961117.296
16546.7565347.2435
176687.8091-21.8091
1894168.862-74.8617
19120249.914-129.914
20156330.967-174.967
21180412.019-232.019
22182493.072-311.072
23222574.125-352.125
24170655.177-485.177
25194736.23-542.23
26210817.282-607.282
27226898.335-672.335
28202979.388-777.388
292131060.44-847.44
302511141.49-890.493
312581222.55-964.545
322741303.6-1029.6
332531384.65-1131.65
342901465.7-1175.7
352811546.76-1265.76
363131627.81-1314.81
373231708.86-1385.86
383741789.91-1415.91
393971870.97-1473.97
404511952.02-1501.02
415102033.07-1523.07
425552114.12-1559.12
435772195.18-1618.18
446852276.23-1591.23
457432357.28-1614.28
468102438.33-1628.33
479302519.39-1589.39
4810752600.44-1525.44
4911252681.49-1556.49
5012392762.54-1523.54
5113722843.6-1471.6
5215492924.65-1375.65
5316583005.7-1347.7
5419203086.75-1166.75
5520153167.81-1152.81
5622763248.86-972.86
5722603329.91-1069.91
5826373410.97-773.965
5926553492.02-837.018
6029503573.07-623.07
6131203654.12-534.123
6232903735.18-445.175
6334693816.23-347.228
6436353897.28-262.281
6538353978.33-143.333
6641574059.3997.6143
6743154140.44174.562
6843514221.49129.509
6942444302.54-58.5434
7043094383.6-74.596
7142664464.65-198.649
7244924545.7-53.7012
7349734626.75346.246
7457474707.811039.19
7563544788.861565.14
7665414869.911671.09
7770354950.962084.04
7876845032.022651.98
7983385113.073224.93
8093525194.124157.88
81100975275.174821.83
82111895356.235832.77
83115425437.286104.72
84120905518.336571.67
85123135599.386713.62
86127175680.447036.56
87132405761.497478.51
88132705842.547427.46
89131615923.67237.4
90128106004.656805.35
91119636085.75877.3
92107566166.754589.25
9391636247.812915.19
9466016328.86272.142
9545526409.91-1857.91
9633686490.96-3122.96
9730356572.02-3537.02
9826866653.07-3967.07
9922616734.12-4473.12
10016996815.17-5116.17
10111866896.23-5710.23
1027956977.28-6182.28
1035277058.33-6531.33
1043197139.38-6820.38
1051787220.44-7042.44
1062327301.49-7069.49


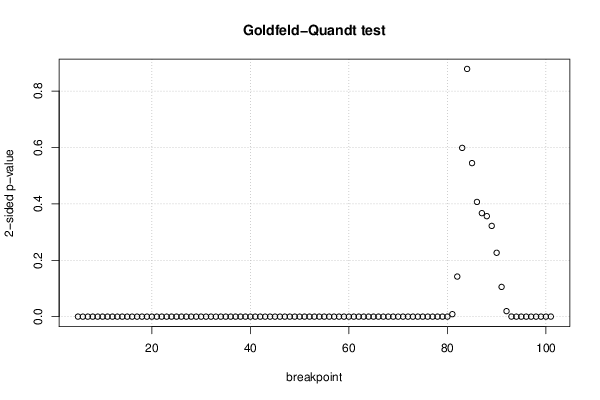
Goldfeld-Quandt test for Heteroskedasticity
p-valuesAlternative Hypothesis
breakpoint indexgreater2-sidedless
55.97606e-050.0001195210.99994
68.25002e-061.65e-050.999992
71.31566e-062.63132e-060.999999
82.02149e-074.04299e-071
92.64137e-085.28273e-081
103.76389e-097.52779e-091
114.48334e-108.96668e-101
125.23336e-111.04667e-101
136.50588e-121.30118e-111
146.63269e-131.32654e-121
157.04642e-141.40928e-131
167.40691e-151.48138e-141
177.68251e-161.5365e-151
188.36372e-171.67274e-161
199.32154e-181.86431e-171
201.0997e-182.19939e-181
211.2771e-192.5542e-191
221.32385e-202.6477e-201
231.46243e-212.92486e-211
241.19338e-222.38676e-221
259.89491e-241.97898e-231
268.08517e-251.61703e-241
276.50401e-261.3008e-251
284.56339e-279.12677e-271
293.14291e-286.28582e-281
302.30209e-294.60419e-291
311.62064e-303.24127e-301
321.13108e-312.26217e-311
337.04739e-331.40948e-321
344.64964e-349.29929e-341
352.84339e-355.68679e-351
361.82015e-363.6403e-361
371.14129e-372.28257e-371
388.08746e-391.61749e-381
395.83703e-401.16741e-391
404.94189e-419.88377e-411
415.10467e-421.02093e-411
425.91302e-431.1826e-421
436.62181e-441.32436e-431
441.27562e-442.55124e-441
452.86774e-455.73549e-451
467.91236e-461.58247e-451
474.08291e-468.16583e-461
484.64271e-469.28543e-461
494.10118e-468.20237e-461
505.15288e-461.03058e-451
519.92809e-461.98562e-451
523.81781e-457.63562e-451
531.34541e-442.69082e-441
541.47537e-432.95073e-431
559.51051e-431.9021e-421
561.32193e-412.64387e-411
575.15306e-411.03061e-401
588.05857e-401.61171e-391
594.52233e-399.04466e-391
604.92676e-389.85351e-381
614.68797e-379.37594e-371
624.00962e-368.01924e-361
633.27983e-356.55966e-351
642.48788e-344.97575e-341
652.02081e-334.04162e-331
662.56182e-325.12364e-321
672.77317e-315.54633e-311
682.05451e-304.10902e-301
699.91509e-301.98302e-291
705.576e-291.1152e-281
713.80464e-287.60929e-281
725.21253e-271.04251e-261
732.12998e-254.25995e-251
744.05882e-238.11764e-231
752.11151e-204.22302e-201
761.34455e-172.68909e-171
771.67732e-143.35465e-141
783.31527e-116.63054e-111
795.78962e-081.15792e-071
803.79706e-057.59412e-050.999962
810.004395770.008791540.995604
820.0710890.1421780.928911
830.2991870.5983730.700813
840.5608280.8783440.439172
850.7277640.5444720.272236
860.796620.406760.20338
870.816490.367020.18351
880.8218440.3563120.178156
890.8391180.3217640.160882
900.8867360.2265280.113264
910.9472560.1054880.0527438
920.9902340.0195330.00976648
930.9998770.0002451830.000122591
9419.38423e-074.69211e-07
9511.95489e-079.77443e-08
960.9999991.06739e-065.33695e-07
970.9999984.82089e-062.41045e-06
980.9999931.4557e-057.2785e-06
990.9999882.41754e-051.20877e-05
1000.9999764.85862e-052.42931e-05
1010.9998930.0002132980.000106649

\begin{tabular}{lllllllll}
\hline
Goldfeld-Quandt test for Heteroskedasticity \tabularnewline
p-values & Alternative Hypothesis \tabularnewline
breakpoint index & greater & 2-sided & less \tabularnewline
5 & 5.97606e-05 & 0.000119521 & 0.99994 \tabularnewline
6 & 8.25002e-06 & 1.65e-05 & 0.999992 \tabularnewline
7 & 1.31566e-06 & 2.63132e-06 & 0.999999 \tabularnewline
8 & 2.02149e-07 & 4.04299e-07 & 1 \tabularnewline
9 & 2.64137e-08 & 5.28273e-08 & 1 \tabularnewline
10 & 3.76389e-09 & 7.52779e-09 & 1 \tabularnewline
11 & 4.48334e-10 & 8.96668e-10 & 1 \tabularnewline
12 & 5.23336e-11 & 1.04667e-10 & 1 \tabularnewline
13 & 6.50588e-12 & 1.30118e-11 & 1 \tabularnewline
14 & 6.63269e-13 & 1.32654e-12 & 1 \tabularnewline
15 & 7.04642e-14 & 1.40928e-13 & 1 \tabularnewline
16 & 7.40691e-15 & 1.48138e-14 & 1 \tabularnewline
17 & 7.68251e-16 & 1.5365e-15 & 1 \tabularnewline
18 & 8.36372e-17 & 1.67274e-16 & 1 \tabularnewline
19 & 9.32154e-18 & 1.86431e-17 & 1 \tabularnewline
20 & 1.0997e-18 & 2.19939e-18 & 1 \tabularnewline
21 & 1.2771e-19 & 2.5542e-19 & 1 \tabularnewline
22 & 1.32385e-20 & 2.6477e-20 & 1 \tabularnewline
23 & 1.46243e-21 & 2.92486e-21 & 1 \tabularnewline
24 & 1.19338e-22 & 2.38676e-22 & 1 \tabularnewline
25 & 9.89491e-24 & 1.97898e-23 & 1 \tabularnewline
26 & 8.08517e-25 & 1.61703e-24 & 1 \tabularnewline
27 & 6.50401e-26 & 1.3008e-25 & 1 \tabularnewline
28 & 4.56339e-27 & 9.12677e-27 & 1 \tabularnewline
29 & 3.14291e-28 & 6.28582e-28 & 1 \tabularnewline
30 & 2.30209e-29 & 4.60419e-29 & 1 \tabularnewline
31 & 1.62064e-30 & 3.24127e-30 & 1 \tabularnewline
32 & 1.13108e-31 & 2.26217e-31 & 1 \tabularnewline
33 & 7.04739e-33 & 1.40948e-32 & 1 \tabularnewline
34 & 4.64964e-34 & 9.29929e-34 & 1 \tabularnewline
35 & 2.84339e-35 & 5.68679e-35 & 1 \tabularnewline
36 & 1.82015e-36 & 3.6403e-36 & 1 \tabularnewline
37 & 1.14129e-37 & 2.28257e-37 & 1 \tabularnewline
38 & 8.08746e-39 & 1.61749e-38 & 1 \tabularnewline
39 & 5.83703e-40 & 1.16741e-39 & 1 \tabularnewline
40 & 4.94189e-41 & 9.88377e-41 & 1 \tabularnewline
41 & 5.10467e-42 & 1.02093e-41 & 1 \tabularnewline
42 & 5.91302e-43 & 1.1826e-42 & 1 \tabularnewline
43 & 6.62181e-44 & 1.32436e-43 & 1 \tabularnewline
44 & 1.27562e-44 & 2.55124e-44 & 1 \tabularnewline
45 & 2.86774e-45 & 5.73549e-45 & 1 \tabularnewline
46 & 7.91236e-46 & 1.58247e-45 & 1 \tabularnewline
47 & 4.08291e-46 & 8.16583e-46 & 1 \tabularnewline
48 & 4.64271e-46 & 9.28543e-46 & 1 \tabularnewline
49 & 4.10118e-46 & 8.20237e-46 & 1 \tabularnewline
50 & 5.15288e-46 & 1.03058e-45 & 1 \tabularnewline
51 & 9.92809e-46 & 1.98562e-45 & 1 \tabularnewline
52 & 3.81781e-45 & 7.63562e-45 & 1 \tabularnewline
53 & 1.34541e-44 & 2.69082e-44 & 1 \tabularnewline
54 & 1.47537e-43 & 2.95073e-43 & 1 \tabularnewline
55 & 9.51051e-43 & 1.9021e-42 & 1 \tabularnewline
56 & 1.32193e-41 & 2.64387e-41 & 1 \tabularnewline
57 & 5.15306e-41 & 1.03061e-40 & 1 \tabularnewline
58 & 8.05857e-40 & 1.61171e-39 & 1 \tabularnewline
59 & 4.52233e-39 & 9.04466e-39 & 1 \tabularnewline
60 & 4.92676e-38 & 9.85351e-38 & 1 \tabularnewline
61 & 4.68797e-37 & 9.37594e-37 & 1 \tabularnewline
62 & 4.00962e-36 & 8.01924e-36 & 1 \tabularnewline
63 & 3.27983e-35 & 6.55966e-35 & 1 \tabularnewline
64 & 2.48788e-34 & 4.97575e-34 & 1 \tabularnewline
65 & 2.02081e-33 & 4.04162e-33 & 1 \tabularnewline
66 & 2.56182e-32 & 5.12364e-32 & 1 \tabularnewline
67 & 2.77317e-31 & 5.54633e-31 & 1 \tabularnewline
68 & 2.05451e-30 & 4.10902e-30 & 1 \tabularnewline
69 & 9.91509e-30 & 1.98302e-29 & 1 \tabularnewline
70 & 5.576e-29 & 1.1152e-28 & 1 \tabularnewline
71 & 3.80464e-28 & 7.60929e-28 & 1 \tabularnewline
72 & 5.21253e-27 & 1.04251e-26 & 1 \tabularnewline
73 & 2.12998e-25 & 4.25995e-25 & 1 \tabularnewline
74 & 4.05882e-23 & 8.11764e-23 & 1 \tabularnewline
75 & 2.11151e-20 & 4.22302e-20 & 1 \tabularnewline
76 & 1.34455e-17 & 2.68909e-17 & 1 \tabularnewline
77 & 1.67732e-14 & 3.35465e-14 & 1 \tabularnewline
78 & 3.31527e-11 & 6.63054e-11 & 1 \tabularnewline
79 & 5.78962e-08 & 1.15792e-07 & 1 \tabularnewline
80 & 3.79706e-05 & 7.59412e-05 & 0.999962 \tabularnewline
81 & 0.00439577 & 0.00879154 & 0.995604 \tabularnewline
82 & 0.071089 & 0.142178 & 0.928911 \tabularnewline
83 & 0.299187 & 0.598373 & 0.700813 \tabularnewline
84 & 0.560828 & 0.878344 & 0.439172 \tabularnewline
85 & 0.727764 & 0.544472 & 0.272236 \tabularnewline
86 & 0.79662 & 0.40676 & 0.20338 \tabularnewline
87 & 0.81649 & 0.36702 & 0.18351 \tabularnewline
88 & 0.821844 & 0.356312 & 0.178156 \tabularnewline
89 & 0.839118 & 0.321764 & 0.160882 \tabularnewline
90 & 0.886736 & 0.226528 & 0.113264 \tabularnewline
91 & 0.947256 & 0.105488 & 0.0527438 \tabularnewline
92 & 0.990234 & 0.019533 & 0.00976648 \tabularnewline
93 & 0.999877 & 0.000245183 & 0.000122591 \tabularnewline
94 & 1 & 9.38423e-07 & 4.69211e-07 \tabularnewline
95 & 1 & 1.95489e-07 & 9.77443e-08 \tabularnewline
96 & 0.999999 & 1.06739e-06 & 5.33695e-07 \tabularnewline
97 & 0.999998 & 4.82089e-06 & 2.41045e-06 \tabularnewline
98 & 0.999993 & 1.4557e-05 & 7.2785e-06 \tabularnewline
99 & 0.999988 & 2.41754e-05 & 1.20877e-05 \tabularnewline
100 & 0.999976 & 4.85862e-05 & 2.42931e-05 \tabularnewline
101 & 0.999893 & 0.000213298 & 0.000106649 \tabularnewline
\hline
\end{tabular}
%Source: https://freestatistics.org/blog/index.php?pk=269168&T=5

[TABLE]
[ROW][C]Goldfeld-Quandt test for Heteroskedasticity[/C][/ROW]
[ROW][C]p-values[/C][C]Alternative Hypothesis[/C][/ROW]
[ROW][C]breakpoint index[/C][C]greater[/C][C]2-sided[/C][C]less[/C][/ROW]
[ROW][C]5[/C][C]5.97606e-05[/C][C]0.000119521[/C][C]0.99994[/C][/ROW]
[ROW][C]6[/C][C]8.25002e-06[/C][C]1.65e-05[/C][C]0.999992[/C][/ROW]
[ROW][C]7[/C][C]1.31566e-06[/C][C]2.63132e-06[/C][C]0.999999[/C][/ROW]
[ROW][C]8[/C][C]2.02149e-07[/C][C]4.04299e-07[/C][C]1[/C][/ROW]
[ROW][C]9[/C][C]2.64137e-08[/C][C]5.28273e-08[/C][C]1[/C][/ROW]
[ROW][C]10[/C][C]3.76389e-09[/C][C]7.52779e-09[/C][C]1[/C][/ROW]
[ROW][C]11[/C][C]4.48334e-10[/C][C]8.96668e-10[/C][C]1[/C][/ROW]
[ROW][C]12[/C][C]5.23336e-11[/C][C]1.04667e-10[/C][C]1[/C][/ROW]
[ROW][C]13[/C][C]6.50588e-12[/C][C]1.30118e-11[/C][C]1[/C][/ROW]
[ROW][C]14[/C][C]6.63269e-13[/C][C]1.32654e-12[/C][C]1[/C][/ROW]
[ROW][C]15[/C][C]7.04642e-14[/C][C]1.40928e-13[/C][C]1[/C][/ROW]
[ROW][C]16[/C][C]7.40691e-15[/C][C]1.48138e-14[/C][C]1[/C][/ROW]
[ROW][C]17[/C][C]7.68251e-16[/C][C]1.5365e-15[/C][C]1[/C][/ROW]
[ROW][C]18[/C][C]8.36372e-17[/C][C]1.67274e-16[/C][C]1[/C][/ROW]
[ROW][C]19[/C][C]9.32154e-18[/C][C]1.86431e-17[/C][C]1[/C][/ROW]
[ROW][C]20[/C][C]1.0997e-18[/C][C]2.19939e-18[/C][C]1[/C][/ROW]
[ROW][C]21[/C][C]1.2771e-19[/C][C]2.5542e-19[/C][C]1[/C][/ROW]
[ROW][C]22[/C][C]1.32385e-20[/C][C]2.6477e-20[/C][C]1[/C][/ROW]
[ROW][C]23[/C][C]1.46243e-21[/C][C]2.92486e-21[/C][C]1[/C][/ROW]
[ROW][C]24[/C][C]1.19338e-22[/C][C]2.38676e-22[/C][C]1[/C][/ROW]
[ROW][C]25[/C][C]9.89491e-24[/C][C]1.97898e-23[/C][C]1[/C][/ROW]
[ROW][C]26[/C][C]8.08517e-25[/C][C]1.61703e-24[/C][C]1[/C][/ROW]
[ROW][C]27[/C][C]6.50401e-26[/C][C]1.3008e-25[/C][C]1[/C][/ROW]
[ROW][C]28[/C][C]4.56339e-27[/C][C]9.12677e-27[/C][C]1[/C][/ROW]
[ROW][C]29[/C][C]3.14291e-28[/C][C]6.28582e-28[/C][C]1[/C][/ROW]
[ROW][C]30[/C][C]2.30209e-29[/C][C]4.60419e-29[/C][C]1[/C][/ROW]
[ROW][C]31[/C][C]1.62064e-30[/C][C]3.24127e-30[/C][C]1[/C][/ROW]
[ROW][C]32[/C][C]1.13108e-31[/C][C]2.26217e-31[/C][C]1[/C][/ROW]
[ROW][C]33[/C][C]7.04739e-33[/C][C]1.40948e-32[/C][C]1[/C][/ROW]
[ROW][C]34[/C][C]4.64964e-34[/C][C]9.29929e-34[/C][C]1[/C][/ROW]
[ROW][C]35[/C][C]2.84339e-35[/C][C]5.68679e-35[/C][C]1[/C][/ROW]
[ROW][C]36[/C][C]1.82015e-36[/C][C]3.6403e-36[/C][C]1[/C][/ROW]
[ROW][C]37[/C][C]1.14129e-37[/C][C]2.28257e-37[/C][C]1[/C][/ROW]
[ROW][C]38[/C][C]8.08746e-39[/C][C]1.61749e-38[/C][C]1[/C][/ROW]
[ROW][C]39[/C][C]5.83703e-40[/C][C]1.16741e-39[/C][C]1[/C][/ROW]
[ROW][C]40[/C][C]4.94189e-41[/C][C]9.88377e-41[/C][C]1[/C][/ROW]
[ROW][C]41[/C][C]5.10467e-42[/C][C]1.02093e-41[/C][C]1[/C][/ROW]
[ROW][C]42[/C][C]5.91302e-43[/C][C]1.1826e-42[/C][C]1[/C][/ROW]
[ROW][C]43[/C][C]6.62181e-44[/C][C]1.32436e-43[/C][C]1[/C][/ROW]
[ROW][C]44[/C][C]1.27562e-44[/C][C]2.55124e-44[/C][C]1[/C][/ROW]
[ROW][C]45[/C][C]2.86774e-45[/C][C]5.73549e-45[/C][C]1[/C][/ROW]
[ROW][C]46[/C][C]7.91236e-46[/C][C]1.58247e-45[/C][C]1[/C][/ROW]
[ROW][C]47[/C][C]4.08291e-46[/C][C]8.16583e-46[/C][C]1[/C][/ROW]
[ROW][C]48[/C][C]4.64271e-46[/C][C]9.28543e-46[/C][C]1[/C][/ROW]
[ROW][C]49[/C][C]4.10118e-46[/C][C]8.20237e-46[/C][C]1[/C][/ROW]
[ROW][C]50[/C][C]5.15288e-46[/C][C]1.03058e-45[/C][C]1[/C][/ROW]
[ROW][C]51[/C][C]9.92809e-46[/C][C]1.98562e-45[/C][C]1[/C][/ROW]
[ROW][C]52[/C][C]3.81781e-45[/C][C]7.63562e-45[/C][C]1[/C][/ROW]
[ROW][C]53[/C][C]1.34541e-44[/C][C]2.69082e-44[/C][C]1[/C][/ROW]
[ROW][C]54[/C][C]1.47537e-43[/C][C]2.95073e-43[/C][C]1[/C][/ROW]
[ROW][C]55[/C][C]9.51051e-43[/C][C]1.9021e-42[/C][C]1[/C][/ROW]
[ROW][C]56[/C][C]1.32193e-41[/C][C]2.64387e-41[/C][C]1[/C][/ROW]
[ROW][C]57[/C][C]5.15306e-41[/C][C]1.03061e-40[/C][C]1[/C][/ROW]
[ROW][C]58[/C][C]8.05857e-40[/C][C]1.61171e-39[/C][C]1[/C][/ROW]
[ROW][C]59[/C][C]4.52233e-39[/C][C]9.04466e-39[/C][C]1[/C][/ROW]
[ROW][C]60[/C][C]4.92676e-38[/C][C]9.85351e-38[/C][C]1[/C][/ROW]
[ROW][C]61[/C][C]4.68797e-37[/C][C]9.37594e-37[/C][C]1[/C][/ROW]
[ROW][C]62[/C][C]4.00962e-36[/C][C]8.01924e-36[/C][C]1[/C][/ROW]
[ROW][C]63[/C][C]3.27983e-35[/C][C]6.55966e-35[/C][C]1[/C][/ROW]
[ROW][C]64[/C][C]2.48788e-34[/C][C]4.97575e-34[/C][C]1[/C][/ROW]
[ROW][C]65[/C][C]2.02081e-33[/C][C]4.04162e-33[/C][C]1[/C][/ROW]
[ROW][C]66[/C][C]2.56182e-32[/C][C]5.12364e-32[/C][C]1[/C][/ROW]
[ROW][C]67[/C][C]2.77317e-31[/C][C]5.54633e-31[/C][C]1[/C][/ROW]
[ROW][C]68[/C][C]2.05451e-30[/C][C]4.10902e-30[/C][C]1[/C][/ROW]
[ROW][C]69[/C][C]9.91509e-30[/C][C]1.98302e-29[/C][C]1[/C][/ROW]
[ROW][C]70[/C][C]5.576e-29[/C][C]1.1152e-28[/C][C]1[/C][/ROW]
[ROW][C]71[/C][C]3.80464e-28[/C][C]7.60929e-28[/C][C]1[/C][/ROW]
[ROW][C]72[/C][C]5.21253e-27[/C][C]1.04251e-26[/C][C]1[/C][/ROW]
[ROW][C]73[/C][C]2.12998e-25[/C][C]4.25995e-25[/C][C]1[/C][/ROW]
[ROW][C]74[/C][C]4.05882e-23[/C][C]8.11764e-23[/C][C]1[/C][/ROW]
[ROW][C]75[/C][C]2.11151e-20[/C][C]4.22302e-20[/C][C]1[/C][/ROW]
[ROW][C]76[/C][C]1.34455e-17[/C][C]2.68909e-17[/C][C]1[/C][/ROW]
[ROW][C]77[/C][C]1.67732e-14[/C][C]3.35465e-14[/C][C]1[/C][/ROW]
[ROW][C]78[/C][C]3.31527e-11[/C][C]6.63054e-11[/C][C]1[/C][/ROW]
[ROW][C]79[/C][C]5.78962e-08[/C][C]1.15792e-07[/C][C]1[/C][/ROW]
[ROW][C]80[/C][C]3.79706e-05[/C][C]7.59412e-05[/C][C]0.999962[/C][/ROW]
[ROW][C]81[/C][C]0.00439577[/C][C]0.00879154[/C][C]0.995604[/C][/ROW]
[ROW][C]82[/C][C]0.071089[/C][C]0.142178[/C][C]0.928911[/C][/ROW]
[ROW][C]83[/C][C]0.299187[/C][C]0.598373[/C][C]0.700813[/C][/ROW]
[ROW][C]84[/C][C]0.560828[/C][C]0.878344[/C][C]0.439172[/C][/ROW]
[ROW][C]85[/C][C]0.727764[/C][C]0.544472[/C][C]0.272236[/C][/ROW]
[ROW][C]86[/C][C]0.79662[/C][C]0.40676[/C][C]0.20338[/C][/ROW]
[ROW][C]87[/C][C]0.81649[/C][C]0.36702[/C][C]0.18351[/C][/ROW]
[ROW][C]88[/C][C]0.821844[/C][C]0.356312[/C][C]0.178156[/C][/ROW]
[ROW][C]89[/C][C]0.839118[/C][C]0.321764[/C][C]0.160882[/C][/ROW]
[ROW][C]90[/C][C]0.886736[/C][C]0.226528[/C][C]0.113264[/C][/ROW]
[ROW][C]91[/C][C]0.947256[/C][C]0.105488[/C][C]0.0527438[/C][/ROW]
[ROW][C]92[/C][C]0.990234[/C][C]0.019533[/C][C]0.00976648[/C][/ROW]
[ROW][C]93[/C][C]0.999877[/C][C]0.000245183[/C][C]0.000122591[/C][/ROW]
[ROW][C]94[/C][C]1[/C][C]9.38423e-07[/C][C]4.69211e-07[/C][/ROW]
[ROW][C]95[/C][C]1[/C][C]1.95489e-07[/C][C]9.77443e-08[/C][/ROW]
[ROW][C]96[/C][C]0.999999[/C][C]1.06739e-06[/C][C]5.33695e-07[/C][/ROW]
[ROW][C]97[/C][C]0.999998[/C][C]4.82089e-06[/C][C]2.41045e-06[/C][/ROW]
[ROW][C]98[/C][C]0.999993[/C][C]1.4557e-05[/C][C]7.2785e-06[/C][/ROW]
[ROW][C]99[/C][C]0.999988[/C][C]2.41754e-05[/C][C]1.20877e-05[/C][/ROW]
[ROW][C]100[/C][C]0.999976[/C][C]4.85862e-05[/C][C]2.42931e-05[/C][/ROW]
[ROW][C]101[/C][C]0.999893[/C][C]0.000213298[/C][C]0.000106649[/C][/ROW]
[/TABLE]
Source: https://freestatistics.org/blog/index.php?pk=269168&T=5

Globally Unique Identifier (entire table): ba.freestatistics.org/blog/index.php?pk=269168&T=5

As an alternative you can also use a QR Code:  

The GUIDs for individual cells are displayed in the table below:

Goldfeld-Quandt test for Heteroskedasticity
p-valuesAlternative Hypothesis
breakpoint indexgreater2-sidedless
55.97606e-050.0001195210.99994
68.25002e-061.65e-050.999992
71.31566e-062.63132e-060.999999
82.02149e-074.04299e-071
92.64137e-085.28273e-081
103.76389e-097.52779e-091
114.48334e-108.96668e-101
125.23336e-111.04667e-101
136.50588e-121.30118e-111
146.63269e-131.32654e-121
157.04642e-141.40928e-131
167.40691e-151.48138e-141
177.68251e-161.5365e-151
188.36372e-171.67274e-161
199.32154e-181.86431e-171
201.0997e-182.19939e-181
211.2771e-192.5542e-191
221.32385e-202.6477e-201
231.46243e-212.92486e-211
241.19338e-222.38676e-221
259.89491e-241.97898e-231
268.08517e-251.61703e-241
276.50401e-261.3008e-251
284.56339e-279.12677e-271
293.14291e-286.28582e-281
302.30209e-294.60419e-291
311.62064e-303.24127e-301
321.13108e-312.26217e-311
337.04739e-331.40948e-321
344.64964e-349.29929e-341
352.84339e-355.68679e-351
361.82015e-363.6403e-361
371.14129e-372.28257e-371
388.08746e-391.61749e-381
395.83703e-401.16741e-391
404.94189e-419.88377e-411
415.10467e-421.02093e-411
425.91302e-431.1826e-421
436.62181e-441.32436e-431
441.27562e-442.55124e-441
452.86774e-455.73549e-451
467.91236e-461.58247e-451
474.08291e-468.16583e-461
484.64271e-469.28543e-461
494.10118e-468.20237e-461
505.15288e-461.03058e-451
519.92809e-461.98562e-451
523.81781e-457.63562e-451
531.34541e-442.69082e-441
541.47537e-432.95073e-431
559.51051e-431.9021e-421
561.32193e-412.64387e-411
575.15306e-411.03061e-401
588.05857e-401.61171e-391
594.52233e-399.04466e-391
604.92676e-389.85351e-381
614.68797e-379.37594e-371
624.00962e-368.01924e-361
633.27983e-356.55966e-351
642.48788e-344.97575e-341
652.02081e-334.04162e-331
662.56182e-325.12364e-321
672.77317e-315.54633e-311
682.05451e-304.10902e-301
699.91509e-301.98302e-291
705.576e-291.1152e-281
713.80464e-287.60929e-281
725.21253e-271.04251e-261
732.12998e-254.25995e-251
744.05882e-238.11764e-231
752.11151e-204.22302e-201
761.34455e-172.68909e-171
771.67732e-143.35465e-141
783.31527e-116.63054e-111
795.78962e-081.15792e-071
803.79706e-057.59412e-050.999962
810.004395770.008791540.995604
820.0710890.1421780.928911
830.2991870.5983730.700813
840.5608280.8783440.439172
850.7277640.5444720.272236
860.796620.406760.20338
870.816490.367020.18351
880.8218440.3563120.178156
890.8391180.3217640.160882
900.8867360.2265280.113264
910.9472560.1054880.0527438
920.9902340.0195330.00976648
930.9998770.0002451830.000122591
9419.38423e-074.69211e-07
9511.95489e-079.77443e-08
960.9999991.06739e-065.33695e-07
970.9999984.82089e-062.41045e-06
980.9999931.4557e-057.2785e-06
990.9999882.41754e-051.20877e-05
1000.9999764.85862e-052.42931e-05
1010.9998930.0002132980.000106649


Meta Analysis of Goldfeld-Quandt test for Heteroskedasticity
Description# significant tests% significant testsOK/NOK
1% type I error level860.886598NOK
5% type I error level870.896907NOK
10% type I error level870.896907NOK

\begin{tabular}{lllllllll}
\hline
Meta Analysis of Goldfeld-Quandt test for Heteroskedasticity \tabularnewline
Description & # significant tests & % significant tests & OK/NOK \tabularnewline
1% type I error level & 86 & 0.886598 & NOK \tabularnewline
5% type I error level & 87 & 0.896907 & NOK \tabularnewline
10% type I error level & 87 & 0.896907 & NOK \tabularnewline
\hline
\end{tabular}
%Source: https://freestatistics.org/blog/index.php?pk=269168&T=6

[TABLE]
[ROW][C]Meta Analysis of Goldfeld-Quandt test for Heteroskedasticity[/C][/ROW]
[ROW][C]Description[/C][C]# significant tests[/C][C]% significant tests[/C][C]OK/NOK[/C][/ROW]
[ROW][C]1% type I error level[/C][C]86[/C][C]0.886598[/C][C]NOK[/C][/ROW]
[ROW][C]5% type I error level[/C][C]87[/C][C]0.896907[/C][C]NOK[/C][/ROW]
[ROW][C]10% type I error level[/C][C]87[/C][C]0.896907[/C][C]NOK[/C][/ROW]
[/TABLE]
Source: https://freestatistics.org/blog/index.php?pk=269168&T=6

Globally Unique Identifier (entire table): ba.freestatistics.org/blog/index.php?pk=269168&T=6

As an alternative you can also use a QR Code:  

The GUIDs for individual cells are displayed in the table below:

Meta Analysis of Goldfeld-Quandt test for Heteroskedasticity
Description# significant tests% significant testsOK/NOK
1% type I error level860.886598NOK
5% type I error level870.896907NOK
10% type I error level870.896907NOK


Parameters (Session):
par1 = 2 ; par2 = Do not include Seasonal Dummies ; par3 = No Linear Trend ;
Parameters (R input):
par1 = 2 ; par2 = Do not include Seasonal Dummies ; par3 = No Linear Trend ;
R code (references can be found in the software module):
library(lattice)
library(lmtest)
n25 <- 25 #minimum number of obs. for Goldfeld-Quandt test
par1 <- as.numeric(par1)
x <- t(y)
k <- length(x[1,])
n <- length(x[,1])
x1 <- cbind(x[,par1], x[,1:k!=par1])
mycolnames <- c(colnames(x)[par1], colnames(x)[1:k!=par1])
colnames(x1) <- mycolnames #colnames(x)[par1]
x <- x1
if (par3 == 'First Differences'){
x2 <- array(0, dim=c(n-1,k), dimnames=list(1:(n-1), paste('(1-B)',colnames(x),sep='')))
for (i in 1:n-1) {
for (j in 1:k) {
x2[i,j] <- x[i+1,j] - x[i,j]
}
}
x <- x2
}
if (par2 == 'Include Monthly Dummies'){
x2 <- array(0, dim=c(n,11), dimnames=list(1:n, paste('M', seq(1:11), sep ='')))
for (i in 1:11){
x2[seq(i,n,12),i] <- 1
}
x <- cbind(x, x2)
}
if (par2 == 'Include Quarterly Dummies'){
x2 <- array(0, dim=c(n,3), dimnames=list(1:n, paste('Q', seq(1:3), sep ='')))
for (i in 1:3){
x2[seq(i,n,4),i] <- 1
}
x <- cbind(x, x2)
}
k <- length(x[1,])
if (par3 == 'Linear Trend'){
x <- cbind(x, c(1:n))
colnames(x)[k+1] <- 't'
}
x
k <- length(x[1,])
df <- as.data.frame(x)
(mylm <- lm(df))
(mysum <- summary(mylm))
if (n > n25) {
kp3 <- k + 3
nmkm3 <- n - k - 3
gqarr <- array(NA, dim=c(nmkm3-kp3+1,3))
numgqtests <- 0
numsignificant1 <- 0
numsignificant5 <- 0
numsignificant10 <- 0
for (mypoint in kp3:nmkm3) {
j <- 0
numgqtests <- numgqtests + 1
for (myalt in c('greater', 'two.sided', 'less')) {
j <- j + 1
gqarr[mypoint-kp3+1,j] <- gqtest(mylm, point=mypoint, alternative=myalt)$p.value
}
if (gqarr[mypoint-kp3+1,2] < 0.01) numsignificant1 <- numsignificant1 + 1
if (gqarr[mypoint-kp3+1,2] < 0.05) numsignificant5 <- numsignificant5 + 1
if (gqarr[mypoint-kp3+1,2] < 0.10) numsignificant10 <- numsignificant10 + 1
}
gqarr
}
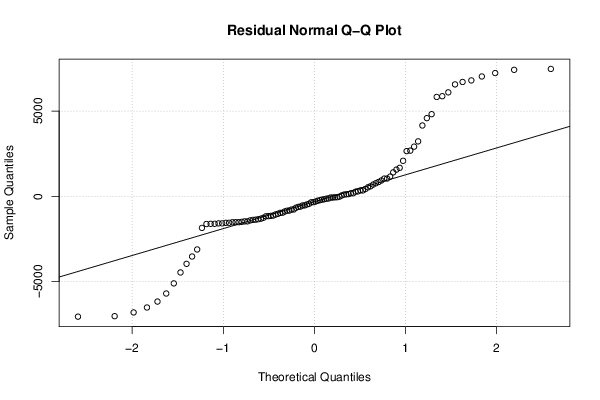
bitmap(file='test0.png')
plot(x[,1], type='l', main='Actuals and Interpolation', ylab='value of Actuals and Interpolation (dots)', xlab='time or index')
points(x[,1]-mysum$resid)
grid()
dev.off()
bitmap(file='test1.png')
plot(mysum$resid, type='b', pch=19, main='Residuals', ylab='value of Residuals', xlab='time or index')
grid()
dev.off()
bitmap(file='test2.png')
hist(mysum$resid, main='Residual Histogram', xlab='values of Residuals')
grid()
dev.off()
bitmap(file='test3.png')
densityplot(~mysum$resid,col='black',main='Residual Density Plot', xlab='values of Residuals')
dev.off()
bitmap(file='test4.png')
qqnorm(mysum$resid, main='Residual Normal Q-Q Plot')
qqline(mysum$resid)
grid()
dev.off()
(myerror <- as.ts(mysum$resid))
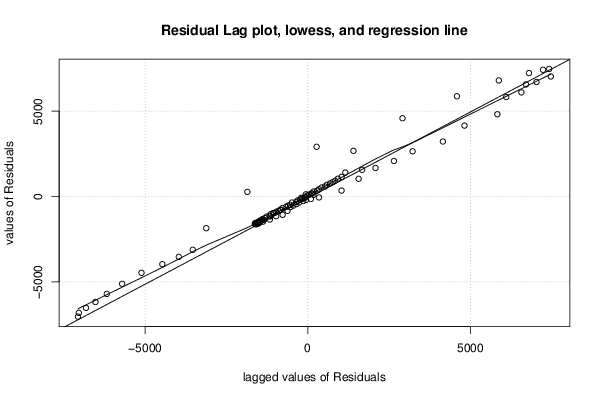
bitmap(file='test5.png')
dum <- cbind(lag(myerror,k=1),myerror)
dum
dum1 <- dum[2:length(myerror),]
dum1
z <- as.data.frame(dum1)
z
plot(z,main=paste('Residual Lag plot, lowess, and regression line'), ylab='values of Residuals', xlab='lagged values of Residuals')
lines(lowess(z))
abline(lm(z))
grid()
dev.off()
bitmap(file='test6.png')
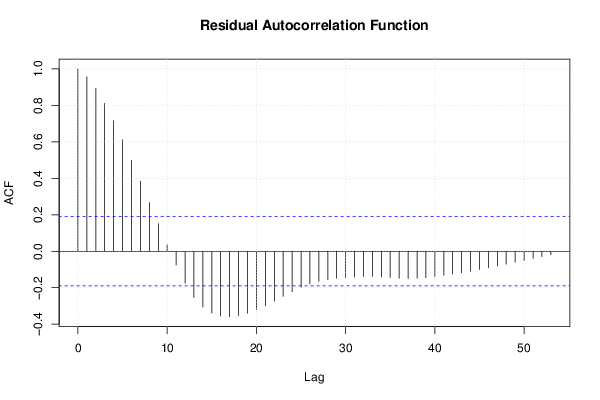
acf(mysum$resid, lag.max=length(mysum$resid)/2, main='Residual Autocorrelation Function')
grid()
dev.off()
bitmap(file='test7.png')
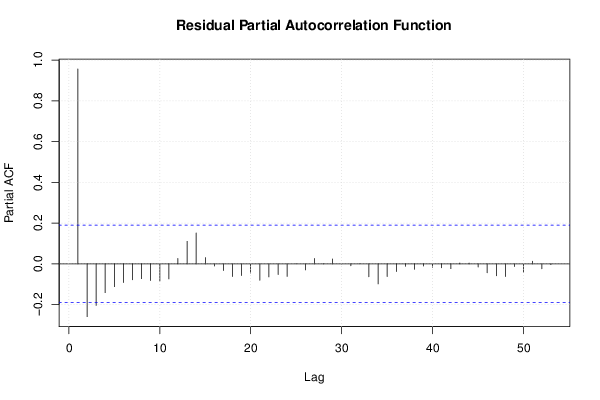
pacf(mysum$resid, lag.max=length(mysum$resid)/2, main='Residual Partial Autocorrelation Function')
grid()
dev.off()
bitmap(file='test8.png')
opar <- par(mfrow = c(2,2), oma = c(0, 0, 1.1, 0))
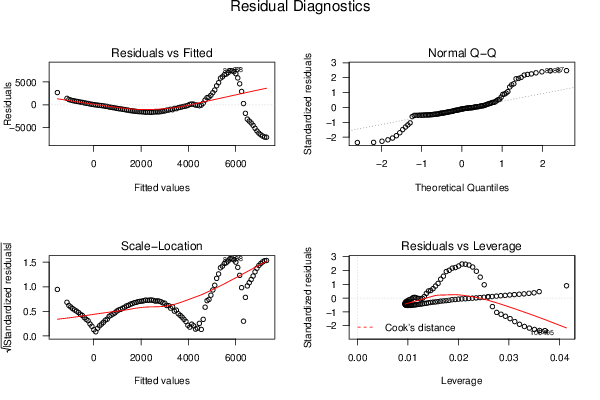
plot(mylm, las = 1, sub='Residual Diagnostics')
par(opar)
dev.off()
if (n > n25) {
bitmap(file='test9.png')
plot(kp3:nmkm3,gqarr[,2], main='Goldfeld-Quandt test',ylab='2-sided p-value',xlab='breakpoint')
grid()
dev.off()
}
load(file='createtable')
a<-table.start()
a<-table.row.start(a)
a<-table.element(a, 'Multiple Linear Regression - Estimated Regression Equation', 1, TRUE)
a<-table.row.end(a)
myeq <- colnames(x)[1]
myeq <- paste(myeq, '[t] = ', sep='')
for (i in 1:k){
if (mysum$coefficients[i,1] > 0) myeq <- paste(myeq, '+', '')
myeq <- paste(myeq, signif(mysum$coefficients[i,1],6), sep=' ')
if (rownames(mysum$coefficients)[i] != '(Intercept)') {
myeq <- paste(myeq, rownames(mysum$coefficients)[i], sep='')
if (rownames(mysum$coefficients)[i] != 't') myeq <- paste(myeq, '[t]', sep='')
}
}
myeq <- paste(myeq, ' + e[t]')
a<-table.row.start(a)
a<-table.element(a, myeq)
a<-table.row.end(a)
a<-table.end(a)
table.save(a,file='mytable1.tab')
a<-table.start()
a<-table.row.start(a)
a<-table.element(a,hyperlink('ols1.htm','Multiple Linear Regression - Ordinary Least Squares',''), 6, TRUE)
a<-table.row.end(a)
a<-table.row.start(a)
a<-table.element(a,'Variable',header=TRUE)
a<-table.element(a,'Parameter',header=TRUE)
a<-table.element(a,'S.D.',header=TRUE)
a<-table.element(a,'T-STAT
H0: parameter = 0',header=TRUE)
a<-table.element(a,'2-tail p-value',header=TRUE)
a<-table.element(a,'1-tail p-value',header=TRUE)
a<-table.row.end(a)
for (i in 1:k){
a<-table.row.start(a)
a<-table.element(a,rownames(mysum$coefficients)[i],header=TRUE)
a<-table.element(a,signif(mysum$coefficients[i,1],6))
a<-table.element(a, signif(mysum$coefficients[i,2],6))
a<-table.element(a, signif(mysum$coefficients[i,3],4))
a<-table.element(a, signif(mysum$coefficients[i,4],6))
a<-table.element(a, signif(mysum$coefficients[i,4]/2,6))
a<-table.row.end(a)
}
a<-table.end(a)
table.save(a,file='mytable2.tab')
a<-table.start()
a<-table.row.start(a)
a<-table.element(a, 'Multiple Linear Regression - Regression Statistics', 2, TRUE)
a<-table.row.end(a)
a<-table.row.start(a)
a<-table.element(a, 'Multiple R',1,TRUE)
a<-table.element(a, signif(sqrt(mysum$r.squared),6))
a<-table.row.end(a)
a<-table.row.start(a)
a<-table.element(a, 'R-squared',1,TRUE)
a<-table.element(a, signif(mysum$r.squared,6))
a<-table.row.end(a)
a<-table.row.start(a)
a<-table.element(a, 'Adjusted R-squared',1,TRUE)
a<-table.element(a, signif(mysum$adj.r.squared,6))
a<-table.row.end(a)
a<-table.row.start(a)
a<-table.element(a, 'F-TEST (value)',1,TRUE)
a<-table.element(a, signif(mysum$fstatistic[1],6))
a<-table.row.end(a)
a<-table.row.start(a)
a<-table.element(a, 'F-TEST (DF numerator)',1,TRUE)
a<-table.element(a, signif(mysum$fstatistic[2],6))
a<-table.row.end(a)
a<-table.row.start(a)
a<-table.element(a, 'F-TEST (DF denominator)',1,TRUE)
a<-table.element(a, signif(mysum$fstatistic[3],6))
a<-table.row.end(a)
a<-table.row.start(a)
a<-table.element(a, 'p-value',1,TRUE)
a<-table.element(a, signif(1-pf(mysum$fstatistic[1],mysum$fstatistic[2],mysum$fstatistic[3]),6))
a<-table.row.end(a)
a<-table.row.start(a)
a<-table.element(a, 'Multiple Linear Regression - Residual Statistics', 2, TRUE)
a<-table.row.end(a)
a<-table.row.start(a)
a<-table.element(a, 'Residual Standard Deviation',1,TRUE)
a<-table.element(a, signif(mysum$sigma,6))
a<-table.row.end(a)
a<-table.row.start(a)
a<-table.element(a, 'Sum Squared Residuals',1,TRUE)
a<-table.element(a, signif(sum(myerror*myerror),6))
a<-table.row.end(a)
a<-table.end(a)
table.save(a,file='mytable3.tab')
a<-table.start()
a<-table.row.start(a)
a<-table.element(a, 'Multiple Linear Regression - Actuals, Interpolation, and Residuals', 4, TRUE)
a<-table.row.end(a)
a<-table.row.start(a)
a<-table.element(a, 'Time or Index', 1, TRUE)
a<-table.element(a, 'Actuals', 1, TRUE)
a<-table.element(a, 'Interpolation
Forecast', 1, TRUE)
a<-table.element(a, 'Residuals
Prediction Error', 1, TRUE)
a<-table.row.end(a)
for (i in 1:n) {
a<-table.row.start(a)
a<-table.element(a,i, 1, TRUE)
a<-table.element(a,signif(x[i],6))
a<-table.element(a,signif(x[i]-mysum$resid[i],6))
a<-table.element(a,signif(mysum$resid[i],6))
a<-table.row.end(a)
}
a<-table.end(a)
table.save(a,file='mytable4.tab')
if (n > n25) {
a<-table.start()
a<-table.row.start(a)
a<-table.element(a,'Goldfeld-Quandt test for Heteroskedasticity',4,TRUE)
a<-table.row.end(a)
a<-table.row.start(a)
a<-table.element(a,'p-values',header=TRUE)
a<-table.element(a,'Alternative Hypothesis',3,header=TRUE)
a<-table.row.end(a)
a<-table.row.start(a)
a<-table.element(a,'breakpoint index',header=TRUE)
a<-table.element(a,'greater',header=TRUE)
a<-table.element(a,'2-sided',header=TRUE)
a<-table.element(a,'less',header=TRUE)
a<-table.row.end(a)
for (mypoint in kp3:nmkm3) {
a<-table.row.start(a)
a<-table.element(a,mypoint,header=TRUE)
a<-table.element(a,signif(gqarr[mypoint-kp3+1,1],6))
a<-table.element(a,signif(gqarr[mypoint-kp3+1,2],6))
a<-table.element(a,signif(gqarr[mypoint-kp3+1,3],6))
a<-table.row.end(a)
}
a<-table.end(a)
table.save(a,file='mytable5.tab')
a<-table.start()
a<-table.row.start(a)
a<-table.element(a,'Meta Analysis of Goldfeld-Quandt test for Heteroskedasticity',4,TRUE)
a<-table.row.end(a)
a<-table.row.start(a)
a<-table.element(a,'Description',header=TRUE)
a<-table.element(a,'# significant tests',header=TRUE)
a<-table.element(a,'% significant tests',header=TRUE)
a<-table.element(a,'OK/NOK',header=TRUE)
a<-table.row.end(a)
a<-table.row.start(a)
a<-table.element(a,'1% type I error level',header=TRUE)
a<-table.element(a,signif(numsignificant1,6))
a<-table.element(a,signif(numsignificant1/numgqtests,6))
if (numsignificant1/numgqtests < 0.01) dum <- 'OK' else dum <- 'NOK'
a<-table.element(a,dum)
a<-table.row.end(a)
a<-table.row.start(a)
a<-table.element(a,'5% type I error level',header=TRUE)
a<-table.element(a,signif(numsignificant5,6))
a<-table.element(a,signif(numsignificant5/numgqtests,6))
if (numsignificant5/numgqtests < 0.05) dum <- 'OK' else dum <- 'NOK'
a<-table.element(a,dum)
a<-table.row.end(a)
a<-table.row.start(a)
a<-table.element(a,'10% type I error level',header=TRUE)
a<-table.element(a,signif(numsignificant10,6))
a<-table.element(a,signif(numsignificant10/numgqtests,6))
if (numsignificant10/numgqtests < 0.1) dum <- 'OK' else dum <- 'NOK'
a<-table.element(a,dum)
a<-table.row.end(a)
a<-table.end(a)
table.save(a,file='mytable6.tab')
}