Free Statistics

of Irreproducible Research!

Author's title

Author*The author of this computation has been verified*
R Software Modulerwasp_bootstrapplot1.wasp
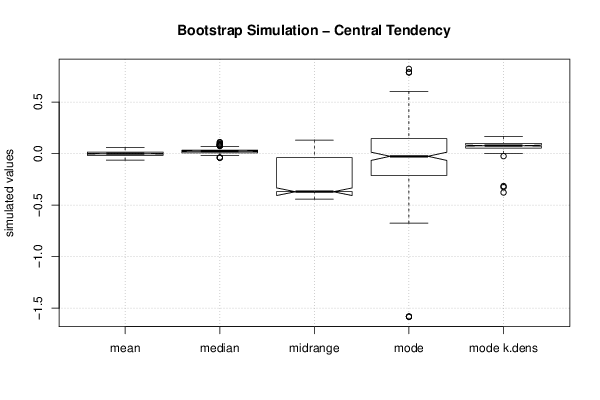
Title produced by softwareBootstrap Plot - Central Tendency
Date of computationMon, 15 Dec 2014 09:23:35 +0000
Cite this page as followsStatistical Computations at FreeStatistics.org, Office for Research Development and Education, URL https://freestatistics.org/blog/index.php?v=date/2014/Dec/15/t1418635454fs14dgz5dxzpriv.htm/, Retrieved Sun, 19 May 2024 13:53:55 +0000
Statistical Computations at FreeStatistics.org, Office for Research Development and Education, URL https://freestatistics.org/blog/index.php?pk=267975, Retrieved Sun, 19 May 2024 13:53:55 +0000
QR Codes:

Original text written by user:
IsPrivate?No (this computation is public)
User-defined keywordsBootstrap Plot Peer Review score
Estimated Impact99
Family? (F = Feedback message, R = changed R code, M = changed R Module, P = changed Parameters, D = changed Data)
-       [Bootstrap Plot - Central Tendency] [Paper data] [2014-12-15 09:23:35] [99d5c1073827aabbadf7ab1e7da1d584] [Current]
Feedback Forum

Post a new message
Dataseries X:
-0.363775
-0.398342
0.124934
0.0261302
0.123816
0.119241
-0.898823
-0.0400656
-0.0939613
0.176012
0.215448
-0.119396
0.401362
0.0896237
0.420572
0.482284
0.697433
0.354247
0.00257601
-0.177932
0.0126273
0.114433
-0.0173765
-0.155306
-0.168492
0.0514652
0.126363
-0.0128281
0.0406277
-0.282883
0.0225639
0.732045
0.419224
0.124464
0.212527
-0.12691
0.390346
0.13894
0.601462
-0.403895
-0.362991
0.00378725
-0.0122793
-0.421003
0.160199
-0.400386
-0.30977
0.0546595
0.00722687
-0.0399991
-0.128741
-0.29043
-0.467973
0.787328
-0.166158
-0.292864
0.82076
0.461377
0.405049
-0.197139
0.38293
-0.0147158
0.327501
-0.269976
-0.269976
0.0967822
-0.0919844
-0.0693304
0.1857
-0.334839
-0.390246
-0.142001
0.00749042
0.241211
0.145391
0.109747
0.166313
0.0329052
0.0155809
-0.675546
-0.640804
0.111204
0.126167
0.089197
-0.0745407
0.0669867
0.105864
-0.335564
-0.0403367
0.109753
-1.58286
0.226415
0.320067
-0.0563292
0.84125
0.313318
-0.222429
-0.453083
-0.663599
0.563799
0.370634
-0.227636
0.0760165
0.209831
-0.0116676
0.0239226
0.300877
0.465369
0.0328649
-0.519641
-0.579891
0.121312
0.348926
-0.375148
0.13857
0.556968
-0.308337
-0.531907
0.417077
-0.216324
-0.202086
0.132854
-0.31167
0.378199
-0.344134
-0.332537
-0.516584
-0.414998
-0.351289
0.29512
0.209786
-0.260902
0.126806
0.292265
0.323552
-0.166158
0.645944
-0.234037
0.0281076
-0.292959
-0.0619789
0.676576
0.539556
0.305965
-0.21531
-0.489063
-0.191953
-0.310878
0.158413
0.249361
-0.412873
0.235427
0.230421
-0.292864
-0.357448
-0.457631
0.323552
0.427588
0.270839
-0.00525043
0.154223
-0.085807
-0.590193
-0.136427
0.0445927
-0.419574
0.162665
0.217035
-0.044231
-0.131498
0.0808169


Summary of computational transaction
Raw Inputview raw input (R code)
Raw Outputview raw output of R engine
Computing time7 seconds
R Server'Sir Maurice George Kendall' @ kendall.wessa.net

\begin{tabular}{lllllllll}
\hline
Summary of computational transaction \tabularnewline
Raw Input & view raw input (R code)  \tabularnewline
Raw Output & view raw output of R engine  \tabularnewline
Computing time & 7 seconds \tabularnewline
R Server & 'Sir Maurice George Kendall' @ kendall.wessa.net \tabularnewline
\hline
\end{tabular}
%Source: https://freestatistics.org/blog/index.php?pk=267975&T=0

[TABLE]
[ROW][C]Summary of computational transaction[/C][/ROW]
[ROW][C]Raw Input[/C][C]view raw input (R code) [/C][/ROW]
[ROW][C]Raw Output[/C][C]view raw output of R engine [/C][/ROW]
[ROW][C]Computing time[/C][C]7 seconds[/C][/ROW]
[ROW][C]R Server[/C][C]'Sir Maurice George Kendall' @ kendall.wessa.net[/C][/ROW]
[/TABLE]
Source: https://freestatistics.org/blog/index.php?pk=267975&T=0

Globally Unique Identifier (entire table): ba.freestatistics.org/blog/index.php?pk=267975&T=0

As an alternative you can also use a QR Code:  

The GUIDs for individual cells are displayed in the table below:

Summary of computational transaction
Raw Inputview raw input (R code)
Raw Outputview raw output of R engine
Computing time7 seconds
R Server'Sir Maurice George Kendall' @ kendall.wessa.net


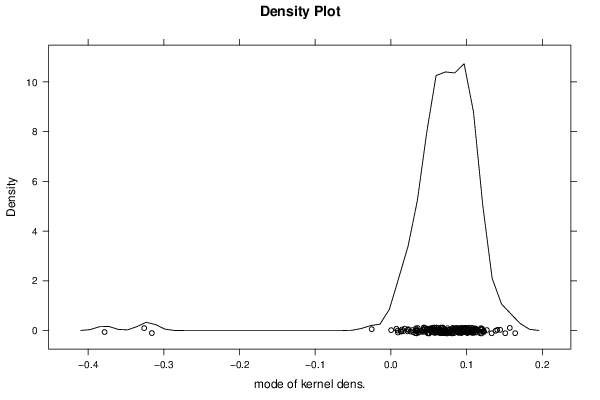
Estimation Results of Bootstrap
statisticP1P5Q1EstimateQ3P95P99S.D.IQR
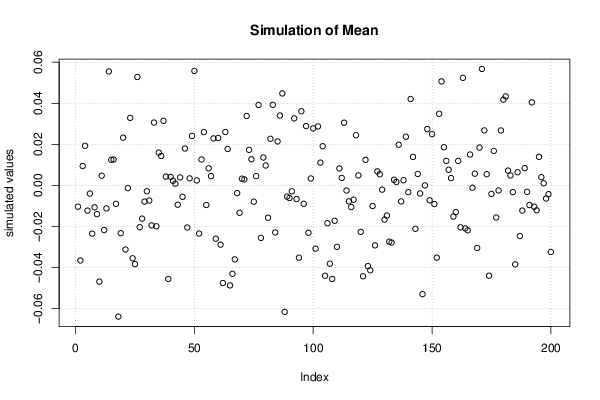
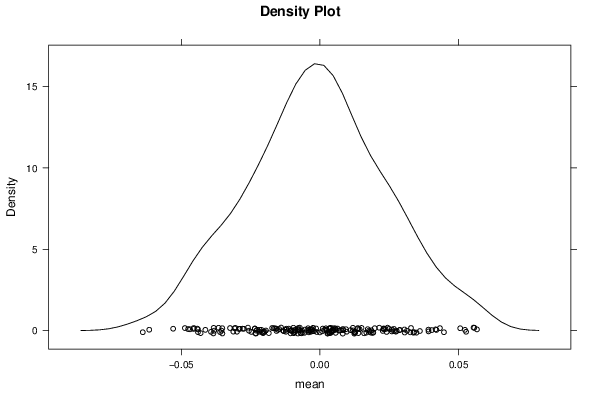
mean-0.053018-0.043968-0.017513-3.3801e-080.0145050.0404840.0554790.0247480.032017
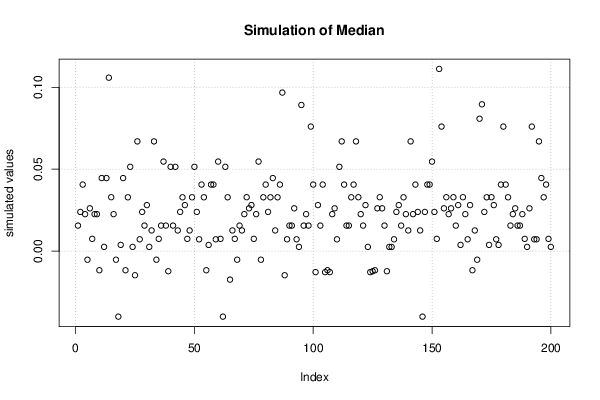
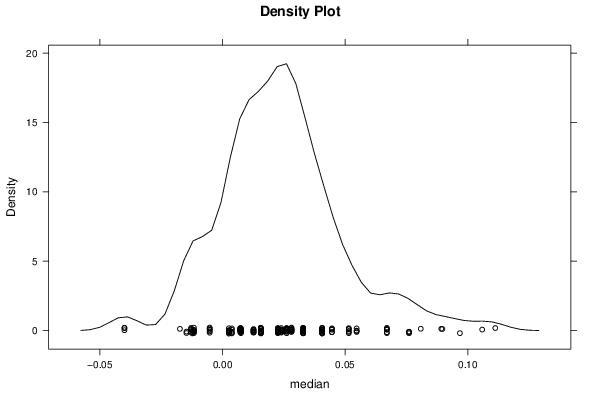
median-0.039999-0.0123070.00742450.0225640.0329050.0674380.0968730.0249040.025481
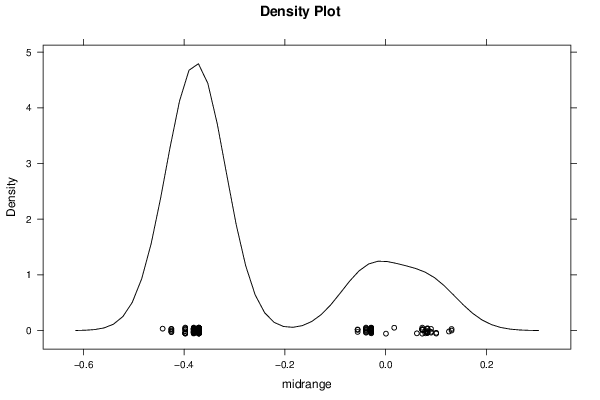
midrange-0.42541-0.39777-0.3708-0.3708-0.0390320.0828520.125580.184620.33177
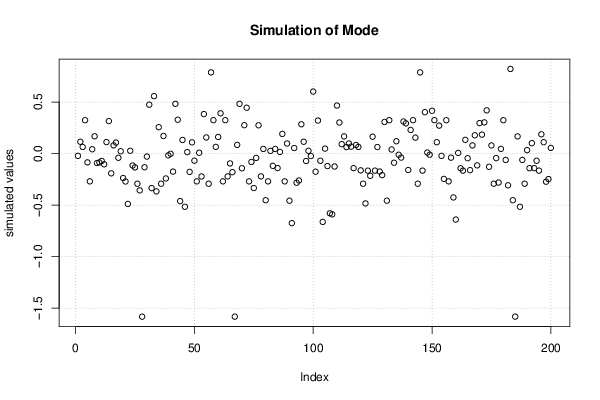
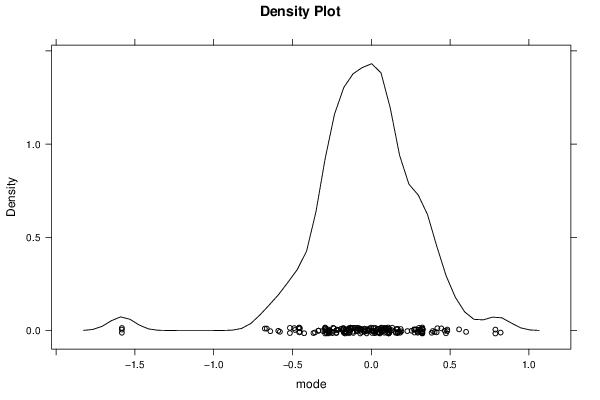
mode-1.5829-0.49044-0.21127-0.101360.13820.420490.787330.332210.34947
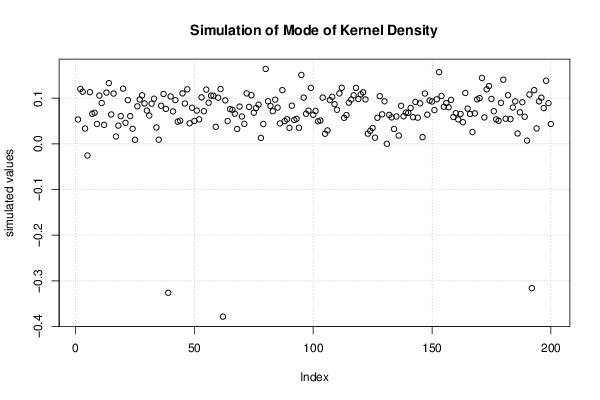
mode k.dens-0.315930.0146250.053680.0737990.098650.122510.151170.0602240.044969

\begin{tabular}{lllllllll}
\hline
Estimation Results of Bootstrap \tabularnewline
statistic & P1 & P5 & Q1 & Estimate & Q3 & P95 & P99 & S.D. & IQR \tabularnewline
mean & -0.053018 & -0.043968 & -0.017513 & -3.3801e-08 & 0.014505 & 0.040484 & 0.055479 & 0.024748 & 0.032017 \tabularnewline
median & -0.039999 & -0.012307 & 0.0074245 & 0.022564 & 0.032905 & 0.067438 & 0.096873 & 0.024904 & 0.025481 \tabularnewline
midrange & -0.42541 & -0.39777 & -0.3708 & -0.3708 & -0.039032 & 0.082852 & 0.12558 & 0.18462 & 0.33177 \tabularnewline
mode & -1.5829 & -0.49044 & -0.21127 & -0.10136 & 0.1382 & 0.42049 & 0.78733 & 0.33221 & 0.34947 \tabularnewline
mode k.dens & -0.31593 & 0.014625 & 0.05368 & 0.073799 & 0.09865 & 0.12251 & 0.15117 & 0.060224 & 0.044969 \tabularnewline
\hline
\end{tabular}
%Source: https://freestatistics.org/blog/index.php?pk=267975&T=1

[TABLE]
[ROW][C]Estimation Results of Bootstrap[/C][/ROW]
[ROW][C]statistic[/C][C]P1[/C][C]P5[/C][C]Q1[/C][C]Estimate[/C][C]Q3[/C][C]P95[/C][C]P99[/C][C]S.D.[/C][C]IQR[/C][/ROW]
[ROW][C]mean[/C][C]-0.053018[/C][C]-0.043968[/C][C]-0.017513[/C][C]-3.3801e-08[/C][C]0.014505[/C][C]0.040484[/C][C]0.055479[/C][C]0.024748[/C][C]0.032017[/C][/ROW]
[ROW][C]median[/C][C]-0.039999[/C][C]-0.012307[/C][C]0.0074245[/C][C]0.022564[/C][C]0.032905[/C][C]0.067438[/C][C]0.096873[/C][C]0.024904[/C][C]0.025481[/C][/ROW]
[ROW][C]midrange[/C][C]-0.42541[/C][C]-0.39777[/C][C]-0.3708[/C][C]-0.3708[/C][C]-0.039032[/C][C]0.082852[/C][C]0.12558[/C][C]0.18462[/C][C]0.33177[/C][/ROW]
[ROW][C]mode[/C][C]-1.5829[/C][C]-0.49044[/C][C]-0.21127[/C][C]-0.10136[/C][C]0.1382[/C][C]0.42049[/C][C]0.78733[/C][C]0.33221[/C][C]0.34947[/C][/ROW]
[ROW][C]mode k.dens[/C][C]-0.31593[/C][C]0.014625[/C][C]0.05368[/C][C]0.073799[/C][C]0.09865[/C][C]0.12251[/C][C]0.15117[/C][C]0.060224[/C][C]0.044969[/C][/ROW]
[/TABLE]
Source: https://freestatistics.org/blog/index.php?pk=267975&T=1

Globally Unique Identifier (entire table): ba.freestatistics.org/blog/index.php?pk=267975&T=1

As an alternative you can also use a QR Code:  

The GUIDs for individual cells are displayed in the table below:

Estimation Results of Bootstrap
statisticP1P5Q1EstimateQ3P95P99S.D.IQR
mean-0.053018-0.043968-0.017513-3.3801e-080.0145050.0404840.0554790.0247480.032017
median-0.039999-0.0123070.00742450.0225640.0329050.0674380.0968730.0249040.025481
midrange-0.42541-0.39777-0.3708-0.3708-0.0390320.0828520.125580.184620.33177
mode-1.5829-0.49044-0.21127-0.101360.13820.420490.787330.332210.34947
mode k.dens-0.315930.0146250.053680.0737990.098650.122510.151170.0602240.044969


Parameters (Session):
par1 = 200 ; par2 = 5 ; par3 = 0 ; par4 = P1 P5 Q1 Q3 P95 P99 ;
Parameters (R input):
par1 = 200 ; par2 = 5 ; par3 = 0 ; par4 = P1 P5 Q1 Q3 P95 P99 ;
R code (references can be found in the software module):
par1 <- as.numeric(par1)
par2 <- as.numeric(par2)
if (par3 == '0') bw <- NULL
if (par3 != '0') bw <- as.numeric(par3)
if (par1 < 10) par1 = 10
if (par1 > 5000) par1 = 5000
library(modeest)
library(lattice)
library(boot)
boot.stat <- function(s,i)
{
s.mean <- mean(s[i])
s.median <- median(s[i])
s.midrange <- (max(s[i]) + min(s[i])) / 2
s.mode <- mlv(s[i], method='mfv')$M
s.kernelmode <- mlv(s[i], method='kernel', bw=bw)$M
c(s.mean, s.median, s.midrange, s.mode, s.kernelmode)
}
(r <- boot(x,boot.stat, R=par1, stype='i'))
bitmap(file='plot1.png')
plot(r$t[,1],type='p',ylab='simulated values',main='Simulation of Mean')
grid()
dev.off()
bitmap(file='plot2.png')
plot(r$t[,2],type='p',ylab='simulated values',main='Simulation of Median')
grid()
dev.off()
bitmap(file='plot3.png')
plot(r$t[,3],type='p',ylab='simulated values',main='Simulation of Midrange')
grid()
dev.off()
bitmap(file='plot7.png')
plot(r$t[,4],type='p',ylab='simulated values',main='Simulation of Mode')
grid()
dev.off()
bitmap(file='plot8.png')
plot(r$t[,5],type='p',ylab='simulated values',main='Simulation of Mode of Kernel Density')
grid()
dev.off()
bitmap(file='plot4.png')
densityplot(~r$t[,1],col='black',main='Density Plot',xlab='mean')
dev.off()
bitmap(file='plot5.png')
densityplot(~r$t[,2],col='black',main='Density Plot',xlab='median')
dev.off()
bitmap(file='plot6.png')
densityplot(~r$t[,3],col='black',main='Density Plot',xlab='midrange')
dev.off()
bitmap(file='plot9.png')
densityplot(~r$t[,4],col='black',main='Density Plot',xlab='mode')
dev.off()
bitmap(file='plot10.png')
densityplot(~r$t[,5],col='black',main='Density Plot',xlab='mode of kernel dens.')
dev.off()
z <- data.frame(cbind(r$t[,1],r$t[,2],r$t[,3],r$t[,4],r$t[,5]))
colnames(z) <- list('mean','median','midrange','mode','mode k.dens')
bitmap(file='plot11.png')
boxplot(z,notch=TRUE,ylab='simulated values',main='Bootstrap Simulation - Central Tendency')
grid()
dev.off()
load(file='createtable')
a<-table.start()
a<-table.row.start(a)
a<-table.element(a,'Estimation Results of Bootstrap',10,TRUE)
a<-table.row.end(a)
if (par4 == 'P1 P5 Q1 Q3 P95 P99') {
myq.1 <- 0.01
myq.2 <- 0.05
myq.3 <- 0.95
myq.4 <- 0.99
myl.1 <- 'P1'
myl.2 <- 'P5'
myl.3 <- 'P95'
myl.4 <- 'P99'
}
if (par4 == 'P0.5 P2.5 Q1 Q3 P97.5 P99.5') {
myq.1 <- 0.005
myq.2 <- 0.025
myq.3 <- 0.975
myq.4 <- 0.995
myl.1 <- 'P0.5'
myl.2 <- 'P2.5'
myl.3 <- 'P97.5'
myl.4 <- 'P99.5'
}
if (par4 == 'P10 P20 Q1 Q3 P80 P90') {
myq.1 <- 0.10
myq.2 <- 0.20
myq.3 <- 0.80
myq.4 <- 0.90
myl.1 <- 'P10'
myl.2 <- 'P20'
myl.3 <- 'P80'
myl.4 <- 'P90'
}
a<-table.row.start(a)
a<-table.element(a,'statistic',header=TRUE)
a<-table.element(a,myl.1,header=TRUE)
a<-table.element(a,myl.2,header=TRUE)
a<-table.element(a,'Q1',header=TRUE)
a<-table.element(a,'Estimate',header=TRUE)
a<-table.element(a,'Q3',header=TRUE)
a<-table.element(a,myl.3,header=TRUE)
a<-table.element(a,myl.4,header=TRUE)
a<-table.element(a,'S.D.',header=TRUE)
a<-table.element(a,'IQR',header=TRUE)
a<-table.row.end(a)
a<-table.row.start(a)
a<-table.element(a,'mean',header=TRUE)
q1 <- quantile(r$t[,1],0.25)[[1]]
q3 <- quantile(r$t[,1],0.75)[[1]]
p01 <- quantile(r$t[,1],myq.1)[[1]]
p05 <- quantile(r$t[,1],myq.2)[[1]]
p95 <- quantile(r$t[,1],myq.3)[[1]]
p99 <- quantile(r$t[,1],myq.4)[[1]]
a<-table.element(a,signif(p01,par2))
a<-table.element(a,signif(p05,par2))
a<-table.element(a,signif(q1,par2))
a<-table.element(a,signif(r$t0[1],par2))
a<-table.element(a,signif(q3,par2))
a<-table.element(a,signif(p95,par2))
a<-table.element(a,signif(p99,par2))
a<-table.element( a,signif( sqrt(var(r$t[,1])),par2 ) )
a<-table.element(a,signif(q3-q1,par2))
a<-table.row.end(a)
a<-table.row.start(a)
a<-table.element(a,'median',header=TRUE)
q1 <- quantile(r$t[,2],0.25)[[1]]
q3 <- quantile(r$t[,2],0.75)[[1]]
p01 <- quantile(r$t[,2],myq.1)[[1]]
p05 <- quantile(r$t[,2],myq.2)[[1]]
p95 <- quantile(r$t[,2],myq.3)[[1]]
p99 <- quantile(r$t[,2],myq.4)[[1]]
a<-table.element(a,signif(p01,par2))
a<-table.element(a,signif(p05,par2))
a<-table.element(a,signif(q1,par2))
a<-table.element(a,signif(r$t0[2],par2))
a<-table.element(a,signif(q3,par2))
a<-table.element(a,signif(p95,par2))
a<-table.element(a,signif(p99,par2))
a<-table.element(a,signif(sqrt(var(r$t[,2])),par2))
a<-table.element(a,signif(q3-q1,par2))
a<-table.row.end(a)
a<-table.row.start(a)
a<-table.element(a,'midrange',header=TRUE)
q1 <- quantile(r$t[,3],0.25)[[1]]
q3 <- quantile(r$t[,3],0.75)[[1]]
p01 <- quantile(r$t[,3],myq.1)[[1]]
p05 <- quantile(r$t[,3],myq.2)[[1]]
p95 <- quantile(r$t[,3],myq.3)[[1]]
p99 <- quantile(r$t[,3],myq.4)[[1]]
a<-table.element(a,signif(p01,par2))
a<-table.element(a,signif(p05,par2))
a<-table.element(a,signif(q1,par2))
a<-table.element(a,signif(r$t0[3],par2))
a<-table.element(a,signif(q3,par2))
a<-table.element(a,signif(p95,par2))
a<-table.element(a,signif(p99,par2))
a<-table.element(a,signif(sqrt(var(r$t[,3])),par2))
a<-table.element(a,signif(q3-q1,par2))
a<-table.row.end(a)
a<-table.row.start(a)
a<-table.element(a,'mode',header=TRUE)
q1 <- quantile(r$t[,4],0.25)[[1]]
q3 <- quantile(r$t[,4],0.75)[[1]]
p01 <- quantile(r$t[,4],myq.1)[[1]]
p05 <- quantile(r$t[,4],myq.2)[[1]]
p95 <- quantile(r$t[,4],myq.3)[[1]]
p99 <- quantile(r$t[,4],myq.4)[[1]]
a<-table.element(a,signif(p01,par2))
a<-table.element(a,signif(p05,par2))
a<-table.element(a,signif(q1,par2))
a<-table.element(a,signif(r$t0[4],par2))
a<-table.element(a,signif(q3,par2))
a<-table.element(a,signif(p95,par2))
a<-table.element(a,signif(p99,par2))
a<-table.element(a,signif(sqrt(var(r$t[,4])),par2))
a<-table.element(a,signif(q3-q1,par2))
a<-table.row.end(a)
a<-table.row.start(a)
a<-table.element(a,'mode k.dens',header=TRUE)
q1 <- quantile(r$t[,5],0.25)[[1]]
q3 <- quantile(r$t[,5],0.75)[[1]]
p01 <- quantile(r$t[,5],myq.1)[[1]]
p05 <- quantile(r$t[,5],myq.2)[[1]]
p95 <- quantile(r$t[,5],myq.3)[[1]]
p99 <- quantile(r$t[,5],myq.4)[[1]]
a<-table.element(a,signif(p01,par2))
a<-table.element(a,signif(p05,par2))
a<-table.element(a,signif(q1,par2))
a<-table.element(a,signif(r$t0[5],par2))
a<-table.element(a,signif(q3,par2))
a<-table.element(a,signif(p95,par2))
a<-table.element(a,signif(p99,par2))
a<-table.element(a,signif(sqrt(var(r$t[,5])),par2))
a<-table.element(a,signif(q3-q1,par2))
a<-table.row.end(a)
a<-table.end(a)
table.save(a,file='mytable.tab')