Free Statistics

of Irreproducible Research!

Author's title

Author*The author of this computation has been verified*
R Software Modulerwasp_multipleregression.wasp
Title produced by softwareMultiple Regression
Date of computationFri, 12 Dec 2014 12:39:39 +0000
Cite this page as followsStatistical Computations at FreeStatistics.org, Office for Research Development and Education, URL https://freestatistics.org/blog/index.php?v=date/2014/Dec/12/t1418388024gvxzqdt69uozehq.htm/, Retrieved Sun, 19 May 2024 13:32:28 +0000
Statistical Computations at FreeStatistics.org, Office for Research Development and Education, URL https://freestatistics.org/blog/index.php?pk=266613, Retrieved Sun, 19 May 2024 13:32:28 +0000
QR Codes:

Original text written by user:
IsPrivate?No (this computation is public)
User-defined keywords
Estimated Impact103
Family? (F = Feedback message, R = changed R code, M = changed R Module, P = changed Parameters, D = changed Data)
-       [Multiple Regression] [] [2014-12-12 12:39:39] [18ce79f318750841a7d9877f42eaf4c3] [Current]
Feedback Forum

Post a new message
Dataseries X:
0	26	50	4	0	12,9
0	51	68	9	0	7,4
0	57	62	4	1	12,2
0	37	54	5	0	12,8
0	67	71	4	1	7,4
0	43	54	4	1	6,7
0	52	65	9	1	12,6
0	52	73	8	0	14,8
0	43	52	11	1	13,3
0	84	84	4	1	11,1
0	67	42	4	1	8,2
0	49	66	6	1	11,4
0	70	65	4	1	6,4
0	52	78	8	1	10,6
0	58	73	4	0	12,0
0	68	75	4	0	6,3
1	62	72	11	0	11,3
0	43	66	4	1	11,9
0	56	70	4	0	9,3
1	56	61	6	1	9,6
0	74	81	6	0	10,0
0	65	71	4	1	6,4
0	63	69	8	1	13,8
0	58	71	5	0	10,8
0	57	72	4	1	13,8
0	63	68	9	1	11,7
0	53	70	4	1	10,9
1	57	68	7	1	16,1
1	51	61	10	0	13,4
0	64	67	4	1	9,9
0	53	76	4	0	11,5
0	29	70	7	0	8,3
0	54	60	12	0	11,7
0	51	77	4	1	6,1
0	58	72	7	1	9,0
0	43	69	5	1	9,7
0	51	71	8	1	10,8
0	53	62	5	1	10,3
0	54	70	4	0	10,4
1	56	64	9	1	12,7
0	61	58	7	1	9,3
0	47	76	4	0	11,8
0	39	52	4	1	5,9
0	48	59	4	1	11,4
0	50	68	4	1	13,0
0	35	76	4	1	10,8
1	30	65	7	1	12,3
0	68	67	4	0	11,3
0	49	59	7	1	11,8
1	61	69	4	1	7,9
0	67	76	4	0	12,7
1	47	63	4	1	12,3
1	56	75	4	1	11,6
1	50	63	8	1	6,7
0	43	60	4	1	10,9
1	67	73	4	1	12,1
0	62	63	4	1	13,3
0	57	70	4	1	10,1
1	41	75	7	0	5,7
0	54	66	12	1	14,3
1	45	63	4	0	8,0
1	48	63	4	1	13,3
0	61	64	4	1	9,3
0	56	70	5	0	12,5
0	41	75	15	0	7,6
0	43	61	5	1	15,9
0	53	60	10	0	9,2
1	44	62	9	1	9,1
0	66	73	8	0	11,1
0	58	61	4	1	13,0
0	46	66	5	1	14,5
1	37	64	4	0	12,2
0	51	59	9	0	12,3
0	51	64	4	0	11,4
1	56	60	10	0	8,8
1	66	56	4	1	14,6
0	45	66	7	1	7,3
0	37	78	4	0	12,6
0	59	53	6	1	
0	42	67	7	0	13,0
1	38	59	5	1	12,6
0	66	66	4	0	13,2
1	34	68	4	0	9,9
0	53	71	4	1	7,7
1	49	66	4	0	10,5
1	55	73	4	0	13,4
1	49	72	4	0	10,9
1	59	71	6	1	4,3
1	40	59	10	0	10,3
1	58	64	7	1	11,8
1	60	66	4	1	11,2
1	63	78	4	0	11,4
1	56	68	7	0	8,6
1	54	73	4	0	13,2
1	52	62	8	1	12,6
1	34	65	11	1	5,6
1	69	68	6	1	9,9
1	32	65	14	0	8,8
1	48	60	5	1	7,7
1	67	71	4	0	9,0
1	58	65	8	1	7,3
1	57	68	9	1	11,4
1	42	64	4	1	13,6
1	64	74	4	1	7,9
1	58	69	5	1	10,7
1	66	76	4	0	10,3
1	26	68	5	1	8,3
1	61	72	4	1	9,6
1	52	67	4	1	14,2
1	51	63	7	0	8,5
1	55	59	10	0	13,5
1	50	73	4	0	4,9
1	60	66	5	0	6,4
1	56	62	4	0	9,6
1	63	69	4	0	11,6
1	61	66	4	1	11,1


Summary of computational transaction
Raw Inputview raw input (R code)
Raw Outputview raw output of R engine
Computing time6 seconds
R Server'Gwilym Jenkins' @ jenkins.wessa.net
R Framework error message
The field 'Names of X columns' contains a hard return which cannot be interpreted.
Please, resubmit your request without hard returns in the 'Names of X columns'.

\begin{tabular}{lllllllll}
\hline
Summary of computational transaction \tabularnewline
Raw Input & view raw input (R code)  \tabularnewline
Raw Output & view raw output of R engine  \tabularnewline
Computing time & 6 seconds \tabularnewline
R Server & 'Gwilym Jenkins' @ jenkins.wessa.net \tabularnewline
R Framework error message & 
The field 'Names of X columns' contains a hard return which cannot be interpreted.
Please, resubmit your request without hard returns in the 'Names of X columns'.
\tabularnewline \hline \end{tabular} %Source: https://freestatistics.org/blog/index.php?pk=266613&T=0

[TABLE]
[ROW][C]Summary of computational transaction[/C][/ROW]
[ROW][C]Raw Input[/C][C]view raw input (R code) [/C][/ROW]
[ROW][C]Raw Output[/C][C]view raw output of R engine [/C][/ROW]
[ROW][C]Computing time[/C][C]6 seconds[/C][/ROW]
[ROW][C]R Server[/C][C]'Gwilym Jenkins' @ jenkins.wessa.net[/C][/ROW]
[ROW][C]R Framework error message[/C][C]
The field 'Names of X columns' contains a hard return which cannot be interpreted.
Please, resubmit your request without hard returns in the 'Names of X columns'.
[/C][/ROW] [/TABLE] Source: https://freestatistics.org/blog/index.php?pk=266613&T=0

Globally Unique Identifier (entire table): ba.freestatistics.org/blog/index.php?pk=266613&T=0

As an alternative you can also use a QR Code:  

The GUIDs for individual cells are displayed in the table below:

Summary of computational transaction
Raw Inputview raw input (R code)
Raw Outputview raw output of R engine
Computing time6 seconds
R Server'Gwilym Jenkins' @ jenkins.wessa.net
R Framework error message
The field 'Names of X columns' contains a hard return which cannot be interpreted.
Please, resubmit your request without hard returns in the 'Names of X columns'.


Multiple Linear Regression - Estimated Regression Equation
TOT [t] = + 6.49656 -0.0419478Course_Bin[t] -0.031197AMS.I[t] + 0.0815376AMS.E[t] + 0.0799359AMS.A[t] -0.160327gender[t] + e[t]

\begin{tabular}{lllllllll}
\hline
Multiple Linear Regression - Estimated Regression Equation \tabularnewline
TOT
[t] =  +  6.49656 -0.0419478Course_Bin[t] -0.031197AMS.I[t] +  0.0815376AMS.E[t] +  0.0799359AMS.A[t] -0.160327gender[t]  + e[t] \tabularnewline
\hline
\end{tabular}
%Source: https://freestatistics.org/blog/index.php?pk=266613&T=1

[TABLE]
[ROW][C]Multiple Linear Regression - Estimated Regression Equation[/C][/ROW]
[ROW][C]TOT
[t] =  +  6.49656 -0.0419478Course_Bin[t] -0.031197AMS.I[t] +  0.0815376AMS.E[t] +  0.0799359AMS.A[t] -0.160327gender[t]  + e[t][/C][/ROW]
[/TABLE]
Source: https://freestatistics.org/blog/index.php?pk=266613&T=1

Globally Unique Identifier (entire table): ba.freestatistics.org/blog/index.php?pk=266613&T=1

As an alternative you can also use a QR Code:  

The GUIDs for individual cells are displayed in the table below:

Multiple Linear Regression - Estimated Regression Equation
TOT [t] = + 6.49656 -0.0419478Course_Bin[t] -0.031197AMS.I[t] + 0.0815376AMS.E[t] + 0.0799359AMS.A[t] -0.160327gender[t] + e[t]


Multiple Linear Regression - Ordinary Least Squares
VariableParameterS.D.T-STATH0: parameter = 02-tail p-value1-tail p-value
(Intercept)6.496562.247812.890.004639530.00231977
Course_Bin-0.04194780.0323806-1.2950.1978720.0989362
AMS.I-0.0311970.024991-1.2480.2145620.107281
AMS.E0.08153760.02813882.8980.004537460.00226873
AMS.A0.07993590.1049770.76150.4480110.224006
gender-0.1603270.141975-1.1290.2612420.130621

\begin{tabular}{lllllllll}
\hline
Multiple Linear Regression - Ordinary Least Squares \tabularnewline
Variable & Parameter & S.D. & T-STATH0: parameter = 0 & 2-tail p-value & 1-tail p-value \tabularnewline
(Intercept) & 6.49656 & 2.24781 & 2.89 & 0.00463953 & 0.00231977 \tabularnewline
Course_Bin & -0.0419478 & 0.0323806 & -1.295 & 0.197872 & 0.0989362 \tabularnewline
AMS.I & -0.031197 & 0.024991 & -1.248 & 0.214562 & 0.107281 \tabularnewline
AMS.E & 0.0815376 & 0.0281388 & 2.898 & 0.00453746 & 0.00226873 \tabularnewline
AMS.A & 0.0799359 & 0.104977 & 0.7615 & 0.448011 & 0.224006 \tabularnewline
gender & -0.160327 & 0.141975 & -1.129 & 0.261242 & 0.130621 \tabularnewline
\hline
\end{tabular}
%Source: https://freestatistics.org/blog/index.php?pk=266613&T=2

[TABLE]
[ROW][C]Multiple Linear Regression - Ordinary Least Squares[/C][/ROW]
[ROW][C]Variable[/C][C]Parameter[/C][C]S.D.[/C][C]T-STATH0: parameter = 0[/C][C]2-tail p-value[/C][C]1-tail p-value[/C][/ROW]
[ROW][C](Intercept)[/C][C]6.49656[/C][C]2.24781[/C][C]2.89[/C][C]0.00463953[/C][C]0.00231977[/C][/ROW]
[ROW][C]Course_Bin[/C][C]-0.0419478[/C][C]0.0323806[/C][C]-1.295[/C][C]0.197872[/C][C]0.0989362[/C][/ROW]
[ROW][C]AMS.I[/C][C]-0.031197[/C][C]0.024991[/C][C]-1.248[/C][C]0.214562[/C][C]0.107281[/C][/ROW]
[ROW][C]AMS.E[/C][C]0.0815376[/C][C]0.0281388[/C][C]2.898[/C][C]0.00453746[/C][C]0.00226873[/C][/ROW]
[ROW][C]AMS.A[/C][C]0.0799359[/C][C]0.104977[/C][C]0.7615[/C][C]0.448011[/C][C]0.224006[/C][/ROW]
[ROW][C]gender[/C][C]-0.160327[/C][C]0.141975[/C][C]-1.129[/C][C]0.261242[/C][C]0.130621[/C][/ROW]
[/TABLE]
Source: https://freestatistics.org/blog/index.php?pk=266613&T=2

Globally Unique Identifier (entire table): ba.freestatistics.org/blog/index.php?pk=266613&T=2

As an alternative you can also use a QR Code:  

The GUIDs for individual cells are displayed in the table below:

Multiple Linear Regression - Ordinary Least Squares
VariableParameterS.D.T-STATH0: parameter = 02-tail p-value1-tail p-value
(Intercept)6.496562.247812.890.004639530.00231977
Course_Bin-0.04194780.0323806-1.2950.1978720.0989362
AMS.I-0.0311970.024991-1.2480.2145620.107281
AMS.E0.08153760.02813882.8980.004537460.00226873
AMS.A0.07993590.1049770.76150.4480110.224006
gender-0.1603270.141975-1.1290.2612420.130621


Multiple Linear Regression - Regression Statistics
Multiple R0.888204
R-squared0.788905
Adjusted R-squared0.77931
F-TEST (value)82.2187
F-TEST (DF numerator)5
F-TEST (DF denominator)110
p-value0
Multiple Linear Regression - Residual Statistics
Residual Standard Deviation2.39592
Sum Squared Residuals631.449

\begin{tabular}{lllllllll}
\hline
Multiple Linear Regression - Regression Statistics \tabularnewline
Multiple R & 0.888204 \tabularnewline
R-squared & 0.788905 \tabularnewline
Adjusted R-squared & 0.77931 \tabularnewline
F-TEST (value) & 82.2187 \tabularnewline
F-TEST (DF numerator) & 5 \tabularnewline
F-TEST (DF denominator) & 110 \tabularnewline
p-value & 0 \tabularnewline
Multiple Linear Regression - Residual Statistics \tabularnewline
Residual Standard Deviation & 2.39592 \tabularnewline
Sum Squared Residuals & 631.449 \tabularnewline
\hline
\end{tabular}
%Source: https://freestatistics.org/blog/index.php?pk=266613&T=3

[TABLE]
[ROW][C]Multiple Linear Regression - Regression Statistics[/C][/ROW]
[ROW][C]Multiple R[/C][C]0.888204[/C][/ROW]
[ROW][C]R-squared[/C][C]0.788905[/C][/ROW]
[ROW][C]Adjusted R-squared[/C][C]0.77931[/C][/ROW]
[ROW][C]F-TEST (value)[/C][C]82.2187[/C][/ROW]
[ROW][C]F-TEST (DF numerator)[/C][C]5[/C][/ROW]
[ROW][C]F-TEST (DF denominator)[/C][C]110[/C][/ROW]
[ROW][C]p-value[/C][C]0[/C][/ROW]
[ROW][C]Multiple Linear Regression - Residual Statistics[/C][/ROW]
[ROW][C]Residual Standard Deviation[/C][C]2.39592[/C][/ROW]
[ROW][C]Sum Squared Residuals[/C][C]631.449[/C][/ROW]
[/TABLE]
Source: https://freestatistics.org/blog/index.php?pk=266613&T=3

Globally Unique Identifier (entire table): ba.freestatistics.org/blog/index.php?pk=266613&T=3

As an alternative you can also use a QR Code:  

The GUIDs for individual cells are displayed in the table below:

Multiple Linear Regression - Regression Statistics
Multiple R0.888204
R-squared0.788905
Adjusted R-squared0.77931
F-TEST (value)82.2187
F-TEST (DF numerator)5
F-TEST (DF denominator)110
p-value0
Multiple Linear Regression - Residual Statistics
Residual Standard Deviation2.39592
Sum Squared Residuals631.449


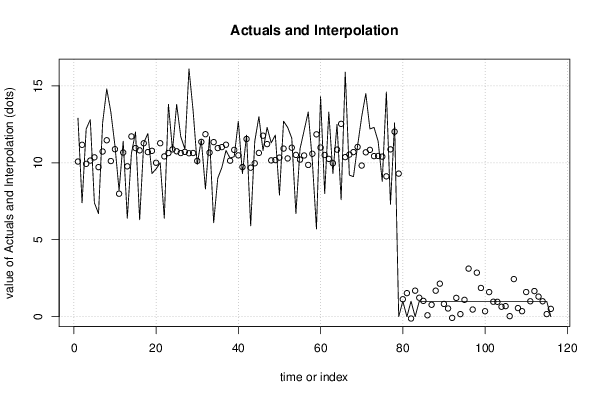
Multiple Linear Regression - Actuals, Interpolation, and Residuals
Time or IndexActualsInterpolationForecastResidualsPrediction Error
112.910.08212.81793
27.411.1695-3.7695
312.29.933082.26692
412.810.1452.65501
57.410.355-2.95495
66.79.71754-3.01754
712.610.73341.86664
814.811.46613.33395
913.310.1143.18598
1011.110.88460.215406
118.27.990360.209639
1211.410.66870.731318
136.49.77214-3.37214
1410.611.7134-1.11341
151210.95911.04087
166.310.8102-4.51023
1711.311.27040.0295939
1811.910.6961.20401
199.310.7769-1.47691
209.610.0007-0.400667
211011.2721-1.27215
226.410.4173-4.01735
2313.810.63643.16359
2410.810.876-0.0759889
2513.810.74853.05154
2611.710.63481.06519
2710.910.71020.189827
2816.110.62025.47983
2913.410.63672.76328
309.910.1224-0.222393
3111.511.35970.140274
328.311.859-3.55904
3311.710.66341.03659
346.111.3433-5.24333
35910.9571-1.95707
369.711.0205-1.32054
3710.811.1738-0.373848
3810.310.13780.162192
3910.410.8393-0.439303
4012.710.48512.21491
419.39.72195-0.421953
4211.811.54690.253092
435.99.67925-3.77925
4411.49.969241.43076
451310.64072.35931
4610.811.7609-0.960944
4712.311.21791.08213
4811.310.15791.14207
4911.810.17791.62215
507.910.3371-2.43711
5112.710.9231.77703
5212.310.28462.01536
5311.610.98230.617677
546.710.5108-3.8108
5510.910.20680.693234
5612.110.47611.62392
5713.39.858643.44136
5810.110.5854-0.485385
595.711.8504-6.15041
6014.310.99233.30769
61810.5074-2.50736
6213.310.25343.04655
639.39.97137-0.671371
6412.510.85681.64315
657.612.5318-4.93185
6615.910.36825.53176
679.210.5347-1.33474
689.110.6964-1.59638
6911.111.02930.0707039
70139.820353.17965
7114.510.68233.81766
7212.210.83851.36152
7312.310.43571.86434
7411.410.44370.956332
758.810.3992-1.5992
7614.69.121145.47886
777.310.8734-3.57341
7812.612.0220.578047
7909.29672-9.29672
8011.13106-0.131065
8101.52942-1.52942
821-0.1211651.12116
8301.68785-1.68785
8411.22991-0.229908
8511.02483-0.0248321
8610.08981740.910183
8710.7735190.226481
8811.68641-0.686409
8912.14203-1.14203
9010.8258190.174181
9110.5311130.468887
921-0.08109561.0811
9311.21804-0.218038
9410.1638310.836169
9511.09318-0.0931758
9613.12155-2.12155
9710.4626890.537311
9812.85707-1.85707
9911.86435-0.864351
10010.3542770.645723
10111.59763-0.597632
10210.9701850.0298149
10310.9637820.0362176
10410.6428260.357174
10510.6831190.316881
10610.03181480.968185
10712.44143-1.44143
10810.5585070.441493
10910.3545170.645483
11011.59979-0.599795
11110.9997680.000231886
11211.66234-0.662338
11311.30229-0.302285
11411.00028-0.000279644
11510.1676120.832388
11600.505198-0.505198

\begin{tabular}{lllllllll}
\hline
Multiple Linear Regression - Actuals, Interpolation, and Residuals \tabularnewline
Time or Index & Actuals & InterpolationForecast & ResidualsPrediction Error \tabularnewline
1 & 12.9 & 10.0821 & 2.81793 \tabularnewline
2 & 7.4 & 11.1695 & -3.7695 \tabularnewline
3 & 12.2 & 9.93308 & 2.26692 \tabularnewline
4 & 12.8 & 10.145 & 2.65501 \tabularnewline
5 & 7.4 & 10.355 & -2.95495 \tabularnewline
6 & 6.7 & 9.71754 & -3.01754 \tabularnewline
7 & 12.6 & 10.7334 & 1.86664 \tabularnewline
8 & 14.8 & 11.4661 & 3.33395 \tabularnewline
9 & 13.3 & 10.114 & 3.18598 \tabularnewline
10 & 11.1 & 10.8846 & 0.215406 \tabularnewline
11 & 8.2 & 7.99036 & 0.209639 \tabularnewline
12 & 11.4 & 10.6687 & 0.731318 \tabularnewline
13 & 6.4 & 9.77214 & -3.37214 \tabularnewline
14 & 10.6 & 11.7134 & -1.11341 \tabularnewline
15 & 12 & 10.9591 & 1.04087 \tabularnewline
16 & 6.3 & 10.8102 & -4.51023 \tabularnewline
17 & 11.3 & 11.2704 & 0.0295939 \tabularnewline
18 & 11.9 & 10.696 & 1.20401 \tabularnewline
19 & 9.3 & 10.7769 & -1.47691 \tabularnewline
20 & 9.6 & 10.0007 & -0.400667 \tabularnewline
21 & 10 & 11.2721 & -1.27215 \tabularnewline
22 & 6.4 & 10.4173 & -4.01735 \tabularnewline
23 & 13.8 & 10.6364 & 3.16359 \tabularnewline
24 & 10.8 & 10.876 & -0.0759889 \tabularnewline
25 & 13.8 & 10.7485 & 3.05154 \tabularnewline
26 & 11.7 & 10.6348 & 1.06519 \tabularnewline
27 & 10.9 & 10.7102 & 0.189827 \tabularnewline
28 & 16.1 & 10.6202 & 5.47983 \tabularnewline
29 & 13.4 & 10.6367 & 2.76328 \tabularnewline
30 & 9.9 & 10.1224 & -0.222393 \tabularnewline
31 & 11.5 & 11.3597 & 0.140274 \tabularnewline
32 & 8.3 & 11.859 & -3.55904 \tabularnewline
33 & 11.7 & 10.6634 & 1.03659 \tabularnewline
34 & 6.1 & 11.3433 & -5.24333 \tabularnewline
35 & 9 & 10.9571 & -1.95707 \tabularnewline
36 & 9.7 & 11.0205 & -1.32054 \tabularnewline
37 & 10.8 & 11.1738 & -0.373848 \tabularnewline
38 & 10.3 & 10.1378 & 0.162192 \tabularnewline
39 & 10.4 & 10.8393 & -0.439303 \tabularnewline
40 & 12.7 & 10.4851 & 2.21491 \tabularnewline
41 & 9.3 & 9.72195 & -0.421953 \tabularnewline
42 & 11.8 & 11.5469 & 0.253092 \tabularnewline
43 & 5.9 & 9.67925 & -3.77925 \tabularnewline
44 & 11.4 & 9.96924 & 1.43076 \tabularnewline
45 & 13 & 10.6407 & 2.35931 \tabularnewline
46 & 10.8 & 11.7609 & -0.960944 \tabularnewline
47 & 12.3 & 11.2179 & 1.08213 \tabularnewline
48 & 11.3 & 10.1579 & 1.14207 \tabularnewline
49 & 11.8 & 10.1779 & 1.62215 \tabularnewline
50 & 7.9 & 10.3371 & -2.43711 \tabularnewline
51 & 12.7 & 10.923 & 1.77703 \tabularnewline
52 & 12.3 & 10.2846 & 2.01536 \tabularnewline
53 & 11.6 & 10.9823 & 0.617677 \tabularnewline
54 & 6.7 & 10.5108 & -3.8108 \tabularnewline
55 & 10.9 & 10.2068 & 0.693234 \tabularnewline
56 & 12.1 & 10.4761 & 1.62392 \tabularnewline
57 & 13.3 & 9.85864 & 3.44136 \tabularnewline
58 & 10.1 & 10.5854 & -0.485385 \tabularnewline
59 & 5.7 & 11.8504 & -6.15041 \tabularnewline
60 & 14.3 & 10.9923 & 3.30769 \tabularnewline
61 & 8 & 10.5074 & -2.50736 \tabularnewline
62 & 13.3 & 10.2534 & 3.04655 \tabularnewline
63 & 9.3 & 9.97137 & -0.671371 \tabularnewline
64 & 12.5 & 10.8568 & 1.64315 \tabularnewline
65 & 7.6 & 12.5318 & -4.93185 \tabularnewline
66 & 15.9 & 10.3682 & 5.53176 \tabularnewline
67 & 9.2 & 10.5347 & -1.33474 \tabularnewline
68 & 9.1 & 10.6964 & -1.59638 \tabularnewline
69 & 11.1 & 11.0293 & 0.0707039 \tabularnewline
70 & 13 & 9.82035 & 3.17965 \tabularnewline
71 & 14.5 & 10.6823 & 3.81766 \tabularnewline
72 & 12.2 & 10.8385 & 1.36152 \tabularnewline
73 & 12.3 & 10.4357 & 1.86434 \tabularnewline
74 & 11.4 & 10.4437 & 0.956332 \tabularnewline
75 & 8.8 & 10.3992 & -1.5992 \tabularnewline
76 & 14.6 & 9.12114 & 5.47886 \tabularnewline
77 & 7.3 & 10.8734 & -3.57341 \tabularnewline
78 & 12.6 & 12.022 & 0.578047 \tabularnewline
79 & 0 & 9.29672 & -9.29672 \tabularnewline
80 & 1 & 1.13106 & -0.131065 \tabularnewline
81 & 0 & 1.52942 & -1.52942 \tabularnewline
82 & 1 & -0.121165 & 1.12116 \tabularnewline
83 & 0 & 1.68785 & -1.68785 \tabularnewline
84 & 1 & 1.22991 & -0.229908 \tabularnewline
85 & 1 & 1.02483 & -0.0248321 \tabularnewline
86 & 1 & 0.0898174 & 0.910183 \tabularnewline
87 & 1 & 0.773519 & 0.226481 \tabularnewline
88 & 1 & 1.68641 & -0.686409 \tabularnewline
89 & 1 & 2.14203 & -1.14203 \tabularnewline
90 & 1 & 0.825819 & 0.174181 \tabularnewline
91 & 1 & 0.531113 & 0.468887 \tabularnewline
92 & 1 & -0.0810956 & 1.0811 \tabularnewline
93 & 1 & 1.21804 & -0.218038 \tabularnewline
94 & 1 & 0.163831 & 0.836169 \tabularnewline
95 & 1 & 1.09318 & -0.0931758 \tabularnewline
96 & 1 & 3.12155 & -2.12155 \tabularnewline
97 & 1 & 0.462689 & 0.537311 \tabularnewline
98 & 1 & 2.85707 & -1.85707 \tabularnewline
99 & 1 & 1.86435 & -0.864351 \tabularnewline
100 & 1 & 0.354277 & 0.645723 \tabularnewline
101 & 1 & 1.59763 & -0.597632 \tabularnewline
102 & 1 & 0.970185 & 0.0298149 \tabularnewline
103 & 1 & 0.963782 & 0.0362176 \tabularnewline
104 & 1 & 0.642826 & 0.357174 \tabularnewline
105 & 1 & 0.683119 & 0.316881 \tabularnewline
106 & 1 & 0.0318148 & 0.968185 \tabularnewline
107 & 1 & 2.44143 & -1.44143 \tabularnewline
108 & 1 & 0.558507 & 0.441493 \tabularnewline
109 & 1 & 0.354517 & 0.645483 \tabularnewline
110 & 1 & 1.59979 & -0.599795 \tabularnewline
111 & 1 & 0.999768 & 0.000231886 \tabularnewline
112 & 1 & 1.66234 & -0.662338 \tabularnewline
113 & 1 & 1.30229 & -0.302285 \tabularnewline
114 & 1 & 1.00028 & -0.000279644 \tabularnewline
115 & 1 & 0.167612 & 0.832388 \tabularnewline
116 & 0 & 0.505198 & -0.505198 \tabularnewline
\hline
\end{tabular}
%Source: https://freestatistics.org/blog/index.php?pk=266613&T=4

[TABLE]
[ROW][C]Multiple Linear Regression - Actuals, Interpolation, and Residuals[/C][/ROW]
[ROW][C]Time or Index[/C][C]Actuals[/C][C]InterpolationForecast[/C][C]ResidualsPrediction Error[/C][/ROW]
[ROW][C]1[/C][C]12.9[/C][C]10.0821[/C][C]2.81793[/C][/ROW]
[ROW][C]2[/C][C]7.4[/C][C]11.1695[/C][C]-3.7695[/C][/ROW]
[ROW][C]3[/C][C]12.2[/C][C]9.93308[/C][C]2.26692[/C][/ROW]
[ROW][C]4[/C][C]12.8[/C][C]10.145[/C][C]2.65501[/C][/ROW]
[ROW][C]5[/C][C]7.4[/C][C]10.355[/C][C]-2.95495[/C][/ROW]
[ROW][C]6[/C][C]6.7[/C][C]9.71754[/C][C]-3.01754[/C][/ROW]
[ROW][C]7[/C][C]12.6[/C][C]10.7334[/C][C]1.86664[/C][/ROW]
[ROW][C]8[/C][C]14.8[/C][C]11.4661[/C][C]3.33395[/C][/ROW]
[ROW][C]9[/C][C]13.3[/C][C]10.114[/C][C]3.18598[/C][/ROW]
[ROW][C]10[/C][C]11.1[/C][C]10.8846[/C][C]0.215406[/C][/ROW]
[ROW][C]11[/C][C]8.2[/C][C]7.99036[/C][C]0.209639[/C][/ROW]
[ROW][C]12[/C][C]11.4[/C][C]10.6687[/C][C]0.731318[/C][/ROW]
[ROW][C]13[/C][C]6.4[/C][C]9.77214[/C][C]-3.37214[/C][/ROW]
[ROW][C]14[/C][C]10.6[/C][C]11.7134[/C][C]-1.11341[/C][/ROW]
[ROW][C]15[/C][C]12[/C][C]10.9591[/C][C]1.04087[/C][/ROW]
[ROW][C]16[/C][C]6.3[/C][C]10.8102[/C][C]-4.51023[/C][/ROW]
[ROW][C]17[/C][C]11.3[/C][C]11.2704[/C][C]0.0295939[/C][/ROW]
[ROW][C]18[/C][C]11.9[/C][C]10.696[/C][C]1.20401[/C][/ROW]
[ROW][C]19[/C][C]9.3[/C][C]10.7769[/C][C]-1.47691[/C][/ROW]
[ROW][C]20[/C][C]9.6[/C][C]10.0007[/C][C]-0.400667[/C][/ROW]
[ROW][C]21[/C][C]10[/C][C]11.2721[/C][C]-1.27215[/C][/ROW]
[ROW][C]22[/C][C]6.4[/C][C]10.4173[/C][C]-4.01735[/C][/ROW]
[ROW][C]23[/C][C]13.8[/C][C]10.6364[/C][C]3.16359[/C][/ROW]
[ROW][C]24[/C][C]10.8[/C][C]10.876[/C][C]-0.0759889[/C][/ROW]
[ROW][C]25[/C][C]13.8[/C][C]10.7485[/C][C]3.05154[/C][/ROW]
[ROW][C]26[/C][C]11.7[/C][C]10.6348[/C][C]1.06519[/C][/ROW]
[ROW][C]27[/C][C]10.9[/C][C]10.7102[/C][C]0.189827[/C][/ROW]
[ROW][C]28[/C][C]16.1[/C][C]10.6202[/C][C]5.47983[/C][/ROW]
[ROW][C]29[/C][C]13.4[/C][C]10.6367[/C][C]2.76328[/C][/ROW]
[ROW][C]30[/C][C]9.9[/C][C]10.1224[/C][C]-0.222393[/C][/ROW]
[ROW][C]31[/C][C]11.5[/C][C]11.3597[/C][C]0.140274[/C][/ROW]
[ROW][C]32[/C][C]8.3[/C][C]11.859[/C][C]-3.55904[/C][/ROW]
[ROW][C]33[/C][C]11.7[/C][C]10.6634[/C][C]1.03659[/C][/ROW]
[ROW][C]34[/C][C]6.1[/C][C]11.3433[/C][C]-5.24333[/C][/ROW]
[ROW][C]35[/C][C]9[/C][C]10.9571[/C][C]-1.95707[/C][/ROW]
[ROW][C]36[/C][C]9.7[/C][C]11.0205[/C][C]-1.32054[/C][/ROW]
[ROW][C]37[/C][C]10.8[/C][C]11.1738[/C][C]-0.373848[/C][/ROW]
[ROW][C]38[/C][C]10.3[/C][C]10.1378[/C][C]0.162192[/C][/ROW]
[ROW][C]39[/C][C]10.4[/C][C]10.8393[/C][C]-0.439303[/C][/ROW]
[ROW][C]40[/C][C]12.7[/C][C]10.4851[/C][C]2.21491[/C][/ROW]
[ROW][C]41[/C][C]9.3[/C][C]9.72195[/C][C]-0.421953[/C][/ROW]
[ROW][C]42[/C][C]11.8[/C][C]11.5469[/C][C]0.253092[/C][/ROW]
[ROW][C]43[/C][C]5.9[/C][C]9.67925[/C][C]-3.77925[/C][/ROW]
[ROW][C]44[/C][C]11.4[/C][C]9.96924[/C][C]1.43076[/C][/ROW]
[ROW][C]45[/C][C]13[/C][C]10.6407[/C][C]2.35931[/C][/ROW]
[ROW][C]46[/C][C]10.8[/C][C]11.7609[/C][C]-0.960944[/C][/ROW]
[ROW][C]47[/C][C]12.3[/C][C]11.2179[/C][C]1.08213[/C][/ROW]
[ROW][C]48[/C][C]11.3[/C][C]10.1579[/C][C]1.14207[/C][/ROW]
[ROW][C]49[/C][C]11.8[/C][C]10.1779[/C][C]1.62215[/C][/ROW]
[ROW][C]50[/C][C]7.9[/C][C]10.3371[/C][C]-2.43711[/C][/ROW]
[ROW][C]51[/C][C]12.7[/C][C]10.923[/C][C]1.77703[/C][/ROW]
[ROW][C]52[/C][C]12.3[/C][C]10.2846[/C][C]2.01536[/C][/ROW]
[ROW][C]53[/C][C]11.6[/C][C]10.9823[/C][C]0.617677[/C][/ROW]
[ROW][C]54[/C][C]6.7[/C][C]10.5108[/C][C]-3.8108[/C][/ROW]
[ROW][C]55[/C][C]10.9[/C][C]10.2068[/C][C]0.693234[/C][/ROW]
[ROW][C]56[/C][C]12.1[/C][C]10.4761[/C][C]1.62392[/C][/ROW]
[ROW][C]57[/C][C]13.3[/C][C]9.85864[/C][C]3.44136[/C][/ROW]
[ROW][C]58[/C][C]10.1[/C][C]10.5854[/C][C]-0.485385[/C][/ROW]
[ROW][C]59[/C][C]5.7[/C][C]11.8504[/C][C]-6.15041[/C][/ROW]
[ROW][C]60[/C][C]14.3[/C][C]10.9923[/C][C]3.30769[/C][/ROW]
[ROW][C]61[/C][C]8[/C][C]10.5074[/C][C]-2.50736[/C][/ROW]
[ROW][C]62[/C][C]13.3[/C][C]10.2534[/C][C]3.04655[/C][/ROW]
[ROW][C]63[/C][C]9.3[/C][C]9.97137[/C][C]-0.671371[/C][/ROW]
[ROW][C]64[/C][C]12.5[/C][C]10.8568[/C][C]1.64315[/C][/ROW]
[ROW][C]65[/C][C]7.6[/C][C]12.5318[/C][C]-4.93185[/C][/ROW]
[ROW][C]66[/C][C]15.9[/C][C]10.3682[/C][C]5.53176[/C][/ROW]
[ROW][C]67[/C][C]9.2[/C][C]10.5347[/C][C]-1.33474[/C][/ROW]
[ROW][C]68[/C][C]9.1[/C][C]10.6964[/C][C]-1.59638[/C][/ROW]
[ROW][C]69[/C][C]11.1[/C][C]11.0293[/C][C]0.0707039[/C][/ROW]
[ROW][C]70[/C][C]13[/C][C]9.82035[/C][C]3.17965[/C][/ROW]
[ROW][C]71[/C][C]14.5[/C][C]10.6823[/C][C]3.81766[/C][/ROW]
[ROW][C]72[/C][C]12.2[/C][C]10.8385[/C][C]1.36152[/C][/ROW]
[ROW][C]73[/C][C]12.3[/C][C]10.4357[/C][C]1.86434[/C][/ROW]
[ROW][C]74[/C][C]11.4[/C][C]10.4437[/C][C]0.956332[/C][/ROW]
[ROW][C]75[/C][C]8.8[/C][C]10.3992[/C][C]-1.5992[/C][/ROW]
[ROW][C]76[/C][C]14.6[/C][C]9.12114[/C][C]5.47886[/C][/ROW]
[ROW][C]77[/C][C]7.3[/C][C]10.8734[/C][C]-3.57341[/C][/ROW]
[ROW][C]78[/C][C]12.6[/C][C]12.022[/C][C]0.578047[/C][/ROW]
[ROW][C]79[/C][C]0[/C][C]9.29672[/C][C]-9.29672[/C][/ROW]
[ROW][C]80[/C][C]1[/C][C]1.13106[/C][C]-0.131065[/C][/ROW]
[ROW][C]81[/C][C]0[/C][C]1.52942[/C][C]-1.52942[/C][/ROW]
[ROW][C]82[/C][C]1[/C][C]-0.121165[/C][C]1.12116[/C][/ROW]
[ROW][C]83[/C][C]0[/C][C]1.68785[/C][C]-1.68785[/C][/ROW]
[ROW][C]84[/C][C]1[/C][C]1.22991[/C][C]-0.229908[/C][/ROW]
[ROW][C]85[/C][C]1[/C][C]1.02483[/C][C]-0.0248321[/C][/ROW]
[ROW][C]86[/C][C]1[/C][C]0.0898174[/C][C]0.910183[/C][/ROW]
[ROW][C]87[/C][C]1[/C][C]0.773519[/C][C]0.226481[/C][/ROW]
[ROW][C]88[/C][C]1[/C][C]1.68641[/C][C]-0.686409[/C][/ROW]
[ROW][C]89[/C][C]1[/C][C]2.14203[/C][C]-1.14203[/C][/ROW]
[ROW][C]90[/C][C]1[/C][C]0.825819[/C][C]0.174181[/C][/ROW]
[ROW][C]91[/C][C]1[/C][C]0.531113[/C][C]0.468887[/C][/ROW]
[ROW][C]92[/C][C]1[/C][C]-0.0810956[/C][C]1.0811[/C][/ROW]
[ROW][C]93[/C][C]1[/C][C]1.21804[/C][C]-0.218038[/C][/ROW]
[ROW][C]94[/C][C]1[/C][C]0.163831[/C][C]0.836169[/C][/ROW]
[ROW][C]95[/C][C]1[/C][C]1.09318[/C][C]-0.0931758[/C][/ROW]
[ROW][C]96[/C][C]1[/C][C]3.12155[/C][C]-2.12155[/C][/ROW]
[ROW][C]97[/C][C]1[/C][C]0.462689[/C][C]0.537311[/C][/ROW]
[ROW][C]98[/C][C]1[/C][C]2.85707[/C][C]-1.85707[/C][/ROW]
[ROW][C]99[/C][C]1[/C][C]1.86435[/C][C]-0.864351[/C][/ROW]
[ROW][C]100[/C][C]1[/C][C]0.354277[/C][C]0.645723[/C][/ROW]
[ROW][C]101[/C][C]1[/C][C]1.59763[/C][C]-0.597632[/C][/ROW]
[ROW][C]102[/C][C]1[/C][C]0.970185[/C][C]0.0298149[/C][/ROW]
[ROW][C]103[/C][C]1[/C][C]0.963782[/C][C]0.0362176[/C][/ROW]
[ROW][C]104[/C][C]1[/C][C]0.642826[/C][C]0.357174[/C][/ROW]
[ROW][C]105[/C][C]1[/C][C]0.683119[/C][C]0.316881[/C][/ROW]
[ROW][C]106[/C][C]1[/C][C]0.0318148[/C][C]0.968185[/C][/ROW]
[ROW][C]107[/C][C]1[/C][C]2.44143[/C][C]-1.44143[/C][/ROW]
[ROW][C]108[/C][C]1[/C][C]0.558507[/C][C]0.441493[/C][/ROW]
[ROW][C]109[/C][C]1[/C][C]0.354517[/C][C]0.645483[/C][/ROW]
[ROW][C]110[/C][C]1[/C][C]1.59979[/C][C]-0.599795[/C][/ROW]
[ROW][C]111[/C][C]1[/C][C]0.999768[/C][C]0.000231886[/C][/ROW]
[ROW][C]112[/C][C]1[/C][C]1.66234[/C][C]-0.662338[/C][/ROW]
[ROW][C]113[/C][C]1[/C][C]1.30229[/C][C]-0.302285[/C][/ROW]
[ROW][C]114[/C][C]1[/C][C]1.00028[/C][C]-0.000279644[/C][/ROW]
[ROW][C]115[/C][C]1[/C][C]0.167612[/C][C]0.832388[/C][/ROW]
[ROW][C]116[/C][C]0[/C][C]0.505198[/C][C]-0.505198[/C][/ROW]
[/TABLE]
Source: https://freestatistics.org/blog/index.php?pk=266613&T=4

Globally Unique Identifier (entire table): ba.freestatistics.org/blog/index.php?pk=266613&T=4

As an alternative you can also use a QR Code:  

The GUIDs for individual cells are displayed in the table below:

Multiple Linear Regression - Actuals, Interpolation, and Residuals
Time or IndexActualsInterpolationForecastResidualsPrediction Error
112.910.08212.81793
27.411.1695-3.7695
312.29.933082.26692
412.810.1452.65501
57.410.355-2.95495
66.79.71754-3.01754
712.610.73341.86664
814.811.46613.33395
913.310.1143.18598
1011.110.88460.215406
118.27.990360.209639
1211.410.66870.731318
136.49.77214-3.37214
1410.611.7134-1.11341
151210.95911.04087
166.310.8102-4.51023
1711.311.27040.0295939
1811.910.6961.20401
199.310.7769-1.47691
209.610.0007-0.400667
211011.2721-1.27215
226.410.4173-4.01735
2313.810.63643.16359
2410.810.876-0.0759889
2513.810.74853.05154
2611.710.63481.06519
2710.910.71020.189827
2816.110.62025.47983
2913.410.63672.76328
309.910.1224-0.222393
3111.511.35970.140274
328.311.859-3.55904
3311.710.66341.03659
346.111.3433-5.24333
35910.9571-1.95707
369.711.0205-1.32054
3710.811.1738-0.373848
3810.310.13780.162192
3910.410.8393-0.439303
4012.710.48512.21491
419.39.72195-0.421953
4211.811.54690.253092
435.99.67925-3.77925
4411.49.969241.43076
451310.64072.35931
4610.811.7609-0.960944
4712.311.21791.08213
4811.310.15791.14207
4911.810.17791.62215
507.910.3371-2.43711
5112.710.9231.77703
5212.310.28462.01536
5311.610.98230.617677
546.710.5108-3.8108
5510.910.20680.693234
5612.110.47611.62392
5713.39.858643.44136
5810.110.5854-0.485385
595.711.8504-6.15041
6014.310.99233.30769
61810.5074-2.50736
6213.310.25343.04655
639.39.97137-0.671371
6412.510.85681.64315
657.612.5318-4.93185
6615.910.36825.53176
679.210.5347-1.33474
689.110.6964-1.59638
6911.111.02930.0707039
70139.820353.17965
7114.510.68233.81766
7212.210.83851.36152
7312.310.43571.86434
7411.410.44370.956332
758.810.3992-1.5992
7614.69.121145.47886
777.310.8734-3.57341
7812.612.0220.578047
7909.29672-9.29672
8011.13106-0.131065
8101.52942-1.52942
821-0.1211651.12116
8301.68785-1.68785
8411.22991-0.229908
8511.02483-0.0248321
8610.08981740.910183
8710.7735190.226481
8811.68641-0.686409
8912.14203-1.14203
9010.8258190.174181
9110.5311130.468887
921-0.08109561.0811
9311.21804-0.218038
9410.1638310.836169
9511.09318-0.0931758
9613.12155-2.12155
9710.4626890.537311
9812.85707-1.85707
9911.86435-0.864351
10010.3542770.645723
10111.59763-0.597632
10210.9701850.0298149
10310.9637820.0362176
10410.6428260.357174
10510.6831190.316881
10610.03181480.968185
10712.44143-1.44143
10810.5585070.441493
10910.3545170.645483
11011.59979-0.599795
11110.9997680.000231886
11211.66234-0.662338
11311.30229-0.302285
11411.00028-0.000279644
11510.1676120.832388
11600.505198-0.505198


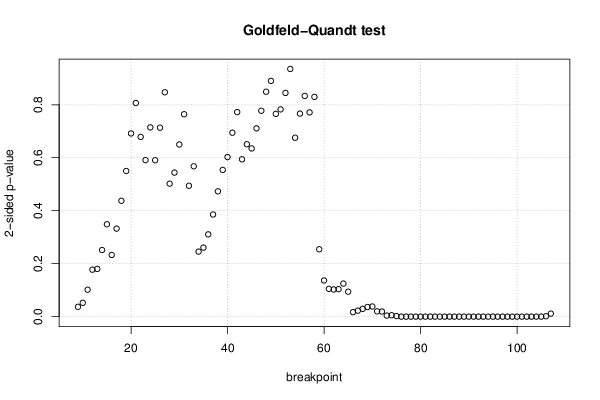
Goldfeld-Quandt test for Heteroskedasticity
p-valuesAlternative Hypothesis
breakpoint indexgreater2-sidedless
90.9813980.03720320.0186016
100.9738810.0522380.026119
110.9491210.1017580.0508792
120.9113070.1773870.0886933
130.9098940.1802120.090106
140.8742280.2515430.125772
150.825590.348820.17441
160.8835470.2329060.116453
170.8338740.3322530.166126
180.7812690.4374610.218731
190.7250230.5499540.274977
200.6541180.6917640.345882
210.596730.806540.40327
220.6606040.6787920.339396
230.7045450.5909110.295455
240.6426610.7146770.357339
250.7047270.5905470.295273
260.6433010.7133990.356699
270.5764340.8471320.423566
280.7489250.5021490.251075
290.7281170.5437650.271883
300.6749980.6500040.325002
310.6179020.7641970.382098
320.7529190.4941620.247081
330.7161080.5677840.283892
340.8772810.2454380.122719
350.8697190.2605610.130281
360.844650.31070.15535
370.8071780.3856430.192822
380.7634590.4730820.236541
390.7230140.5539720.276986
400.6988040.6023910.301196
410.6527840.6944320.347216
420.6138310.7723380.386169
430.7029530.5940950.297047
440.6745220.6509570.325478
450.6824450.635110.317555
460.6445590.7108820.355441
470.6113470.7773060.388653
480.5754120.8491760.424588
490.5549540.8900920.445046
500.6172010.7655980.382799
510.6086560.7826880.391344
520.5776210.8447580.422379
530.5323950.935210.467605
540.6622640.6754710.337736
550.6166780.7666440.383322
560.5833590.8332810.416641
570.6143840.7712320.385616
580.5851170.8297660.414883
590.8727530.2544940.127247
600.9316710.1366580.0683288
610.947560.1048790.0524395
620.9486790.1026410.0513205
630.9481140.1037710.0518857
640.9375680.1248650.0624323
650.9529260.09414880.0470744
660.9914370.01712510.00856254
670.9886910.02261850.0113092
680.9852710.02945870.0147294
690.9817530.03649440.0182472
700.9808420.0383170.0191585
710.9899930.02001410.0100071
720.990380.01923970.00961983
730.9980440.003911210.00195561
740.997340.005320060.00266003
750.9989490.002102820.00105141
7614.39954e-082.19977e-08
7712.0776e-081.0388e-08
7814.38634e-242.19317e-24
7912.24483e-251.12242e-25
8011.93054e-249.65268e-25
8115.72623e-252.86311e-25
8215.66777e-242.83389e-24
8311.03549e-265.17744e-27
8411.52799e-257.63993e-26
8512.30001e-241.15e-24
8613.27281e-231.6364e-23
8714.71979e-222.35989e-22
8816.40758e-213.20379e-21
8918.49587e-204.24793e-20
9011.03046e-185.15228e-19
9111.1352e-175.67599e-18
9211.3992e-166.996e-17
9311.71853e-158.59267e-16
9412.02336e-141.01168e-14
9512.12871e-131.06435e-13
9612.18265e-121.09132e-12
9712.02177e-111.01088e-11
9811.20576e-106.02881e-11
9918.43285e-104.21643e-10
10018.62921e-094.31461e-09
10116.99977e-083.49989e-08
10216.70076e-073.35038e-07
1030.9999975.36472e-062.68236e-06
1040.9999813.74355e-051.87178e-05
1050.9998940.0002117390.000105869
1060.9992490.00150160.000750798
1070.994330.0113390.00566952

\begin{tabular}{lllllllll}
\hline
Goldfeld-Quandt test for Heteroskedasticity \tabularnewline
p-values & Alternative Hypothesis \tabularnewline
breakpoint index & greater & 2-sided & less \tabularnewline
9 & 0.981398 & 0.0372032 & 0.0186016 \tabularnewline
10 & 0.973881 & 0.052238 & 0.026119 \tabularnewline
11 & 0.949121 & 0.101758 & 0.0508792 \tabularnewline
12 & 0.911307 & 0.177387 & 0.0886933 \tabularnewline
13 & 0.909894 & 0.180212 & 0.090106 \tabularnewline
14 & 0.874228 & 0.251543 & 0.125772 \tabularnewline
15 & 0.82559 & 0.34882 & 0.17441 \tabularnewline
16 & 0.883547 & 0.232906 & 0.116453 \tabularnewline
17 & 0.833874 & 0.332253 & 0.166126 \tabularnewline
18 & 0.781269 & 0.437461 & 0.218731 \tabularnewline
19 & 0.725023 & 0.549954 & 0.274977 \tabularnewline
20 & 0.654118 & 0.691764 & 0.345882 \tabularnewline
21 & 0.59673 & 0.80654 & 0.40327 \tabularnewline
22 & 0.660604 & 0.678792 & 0.339396 \tabularnewline
23 & 0.704545 & 0.590911 & 0.295455 \tabularnewline
24 & 0.642661 & 0.714677 & 0.357339 \tabularnewline
25 & 0.704727 & 0.590547 & 0.295273 \tabularnewline
26 & 0.643301 & 0.713399 & 0.356699 \tabularnewline
27 & 0.576434 & 0.847132 & 0.423566 \tabularnewline
28 & 0.748925 & 0.502149 & 0.251075 \tabularnewline
29 & 0.728117 & 0.543765 & 0.271883 \tabularnewline
30 & 0.674998 & 0.650004 & 0.325002 \tabularnewline
31 & 0.617902 & 0.764197 & 0.382098 \tabularnewline
32 & 0.752919 & 0.494162 & 0.247081 \tabularnewline
33 & 0.716108 & 0.567784 & 0.283892 \tabularnewline
34 & 0.877281 & 0.245438 & 0.122719 \tabularnewline
35 & 0.869719 & 0.260561 & 0.130281 \tabularnewline
36 & 0.84465 & 0.3107 & 0.15535 \tabularnewline
37 & 0.807178 & 0.385643 & 0.192822 \tabularnewline
38 & 0.763459 & 0.473082 & 0.236541 \tabularnewline
39 & 0.723014 & 0.553972 & 0.276986 \tabularnewline
40 & 0.698804 & 0.602391 & 0.301196 \tabularnewline
41 & 0.652784 & 0.694432 & 0.347216 \tabularnewline
42 & 0.613831 & 0.772338 & 0.386169 \tabularnewline
43 & 0.702953 & 0.594095 & 0.297047 \tabularnewline
44 & 0.674522 & 0.650957 & 0.325478 \tabularnewline
45 & 0.682445 & 0.63511 & 0.317555 \tabularnewline
46 & 0.644559 & 0.710882 & 0.355441 \tabularnewline
47 & 0.611347 & 0.777306 & 0.388653 \tabularnewline
48 & 0.575412 & 0.849176 & 0.424588 \tabularnewline
49 & 0.554954 & 0.890092 & 0.445046 \tabularnewline
50 & 0.617201 & 0.765598 & 0.382799 \tabularnewline
51 & 0.608656 & 0.782688 & 0.391344 \tabularnewline
52 & 0.577621 & 0.844758 & 0.422379 \tabularnewline
53 & 0.532395 & 0.93521 & 0.467605 \tabularnewline
54 & 0.662264 & 0.675471 & 0.337736 \tabularnewline
55 & 0.616678 & 0.766644 & 0.383322 \tabularnewline
56 & 0.583359 & 0.833281 & 0.416641 \tabularnewline
57 & 0.614384 & 0.771232 & 0.385616 \tabularnewline
58 & 0.585117 & 0.829766 & 0.414883 \tabularnewline
59 & 0.872753 & 0.254494 & 0.127247 \tabularnewline
60 & 0.931671 & 0.136658 & 0.0683288 \tabularnewline
61 & 0.94756 & 0.104879 & 0.0524395 \tabularnewline
62 & 0.948679 & 0.102641 & 0.0513205 \tabularnewline
63 & 0.948114 & 0.103771 & 0.0518857 \tabularnewline
64 & 0.937568 & 0.124865 & 0.0624323 \tabularnewline
65 & 0.952926 & 0.0941488 & 0.0470744 \tabularnewline
66 & 0.991437 & 0.0171251 & 0.00856254 \tabularnewline
67 & 0.988691 & 0.0226185 & 0.0113092 \tabularnewline
68 & 0.985271 & 0.0294587 & 0.0147294 \tabularnewline
69 & 0.981753 & 0.0364944 & 0.0182472 \tabularnewline
70 & 0.980842 & 0.038317 & 0.0191585 \tabularnewline
71 & 0.989993 & 0.0200141 & 0.0100071 \tabularnewline
72 & 0.99038 & 0.0192397 & 0.00961983 \tabularnewline
73 & 0.998044 & 0.00391121 & 0.00195561 \tabularnewline
74 & 0.99734 & 0.00532006 & 0.00266003 \tabularnewline
75 & 0.998949 & 0.00210282 & 0.00105141 \tabularnewline
76 & 1 & 4.39954e-08 & 2.19977e-08 \tabularnewline
77 & 1 & 2.0776e-08 & 1.0388e-08 \tabularnewline
78 & 1 & 4.38634e-24 & 2.19317e-24 \tabularnewline
79 & 1 & 2.24483e-25 & 1.12242e-25 \tabularnewline
80 & 1 & 1.93054e-24 & 9.65268e-25 \tabularnewline
81 & 1 & 5.72623e-25 & 2.86311e-25 \tabularnewline
82 & 1 & 5.66777e-24 & 2.83389e-24 \tabularnewline
83 & 1 & 1.03549e-26 & 5.17744e-27 \tabularnewline
84 & 1 & 1.52799e-25 & 7.63993e-26 \tabularnewline
85 & 1 & 2.30001e-24 & 1.15e-24 \tabularnewline
86 & 1 & 3.27281e-23 & 1.6364e-23 \tabularnewline
87 & 1 & 4.71979e-22 & 2.35989e-22 \tabularnewline
88 & 1 & 6.40758e-21 & 3.20379e-21 \tabularnewline
89 & 1 & 8.49587e-20 & 4.24793e-20 \tabularnewline
90 & 1 & 1.03046e-18 & 5.15228e-19 \tabularnewline
91 & 1 & 1.1352e-17 & 5.67599e-18 \tabularnewline
92 & 1 & 1.3992e-16 & 6.996e-17 \tabularnewline
93 & 1 & 1.71853e-15 & 8.59267e-16 \tabularnewline
94 & 1 & 2.02336e-14 & 1.01168e-14 \tabularnewline
95 & 1 & 2.12871e-13 & 1.06435e-13 \tabularnewline
96 & 1 & 2.18265e-12 & 1.09132e-12 \tabularnewline
97 & 1 & 2.02177e-11 & 1.01088e-11 \tabularnewline
98 & 1 & 1.20576e-10 & 6.02881e-11 \tabularnewline
99 & 1 & 8.43285e-10 & 4.21643e-10 \tabularnewline
100 & 1 & 8.62921e-09 & 4.31461e-09 \tabularnewline
101 & 1 & 6.99977e-08 & 3.49989e-08 \tabularnewline
102 & 1 & 6.70076e-07 & 3.35038e-07 \tabularnewline
103 & 0.999997 & 5.36472e-06 & 2.68236e-06 \tabularnewline
104 & 0.999981 & 3.74355e-05 & 1.87178e-05 \tabularnewline
105 & 0.999894 & 0.000211739 & 0.000105869 \tabularnewline
106 & 0.999249 & 0.0015016 & 0.000750798 \tabularnewline
107 & 0.99433 & 0.011339 & 0.00566952 \tabularnewline
\hline
\end{tabular}
%Source: https://freestatistics.org/blog/index.php?pk=266613&T=5

[TABLE]
[ROW][C]Goldfeld-Quandt test for Heteroskedasticity[/C][/ROW]
[ROW][C]p-values[/C][C]Alternative Hypothesis[/C][/ROW]
[ROW][C]breakpoint index[/C][C]greater[/C][C]2-sided[/C][C]less[/C][/ROW]
[ROW][C]9[/C][C]0.981398[/C][C]0.0372032[/C][C]0.0186016[/C][/ROW]
[ROW][C]10[/C][C]0.973881[/C][C]0.052238[/C][C]0.026119[/C][/ROW]
[ROW][C]11[/C][C]0.949121[/C][C]0.101758[/C][C]0.0508792[/C][/ROW]
[ROW][C]12[/C][C]0.911307[/C][C]0.177387[/C][C]0.0886933[/C][/ROW]
[ROW][C]13[/C][C]0.909894[/C][C]0.180212[/C][C]0.090106[/C][/ROW]
[ROW][C]14[/C][C]0.874228[/C][C]0.251543[/C][C]0.125772[/C][/ROW]
[ROW][C]15[/C][C]0.82559[/C][C]0.34882[/C][C]0.17441[/C][/ROW]
[ROW][C]16[/C][C]0.883547[/C][C]0.232906[/C][C]0.116453[/C][/ROW]
[ROW][C]17[/C][C]0.833874[/C][C]0.332253[/C][C]0.166126[/C][/ROW]
[ROW][C]18[/C][C]0.781269[/C][C]0.437461[/C][C]0.218731[/C][/ROW]
[ROW][C]19[/C][C]0.725023[/C][C]0.549954[/C][C]0.274977[/C][/ROW]
[ROW][C]20[/C][C]0.654118[/C][C]0.691764[/C][C]0.345882[/C][/ROW]
[ROW][C]21[/C][C]0.59673[/C][C]0.80654[/C][C]0.40327[/C][/ROW]
[ROW][C]22[/C][C]0.660604[/C][C]0.678792[/C][C]0.339396[/C][/ROW]
[ROW][C]23[/C][C]0.704545[/C][C]0.590911[/C][C]0.295455[/C][/ROW]
[ROW][C]24[/C][C]0.642661[/C][C]0.714677[/C][C]0.357339[/C][/ROW]
[ROW][C]25[/C][C]0.704727[/C][C]0.590547[/C][C]0.295273[/C][/ROW]
[ROW][C]26[/C][C]0.643301[/C][C]0.713399[/C][C]0.356699[/C][/ROW]
[ROW][C]27[/C][C]0.576434[/C][C]0.847132[/C][C]0.423566[/C][/ROW]
[ROW][C]28[/C][C]0.748925[/C][C]0.502149[/C][C]0.251075[/C][/ROW]
[ROW][C]29[/C][C]0.728117[/C][C]0.543765[/C][C]0.271883[/C][/ROW]
[ROW][C]30[/C][C]0.674998[/C][C]0.650004[/C][C]0.325002[/C][/ROW]
[ROW][C]31[/C][C]0.617902[/C][C]0.764197[/C][C]0.382098[/C][/ROW]
[ROW][C]32[/C][C]0.752919[/C][C]0.494162[/C][C]0.247081[/C][/ROW]
[ROW][C]33[/C][C]0.716108[/C][C]0.567784[/C][C]0.283892[/C][/ROW]
[ROW][C]34[/C][C]0.877281[/C][C]0.245438[/C][C]0.122719[/C][/ROW]
[ROW][C]35[/C][C]0.869719[/C][C]0.260561[/C][C]0.130281[/C][/ROW]
[ROW][C]36[/C][C]0.84465[/C][C]0.3107[/C][C]0.15535[/C][/ROW]
[ROW][C]37[/C][C]0.807178[/C][C]0.385643[/C][C]0.192822[/C][/ROW]
[ROW][C]38[/C][C]0.763459[/C][C]0.473082[/C][C]0.236541[/C][/ROW]
[ROW][C]39[/C][C]0.723014[/C][C]0.553972[/C][C]0.276986[/C][/ROW]
[ROW][C]40[/C][C]0.698804[/C][C]0.602391[/C][C]0.301196[/C][/ROW]
[ROW][C]41[/C][C]0.652784[/C][C]0.694432[/C][C]0.347216[/C][/ROW]
[ROW][C]42[/C][C]0.613831[/C][C]0.772338[/C][C]0.386169[/C][/ROW]
[ROW][C]43[/C][C]0.702953[/C][C]0.594095[/C][C]0.297047[/C][/ROW]
[ROW][C]44[/C][C]0.674522[/C][C]0.650957[/C][C]0.325478[/C][/ROW]
[ROW][C]45[/C][C]0.682445[/C][C]0.63511[/C][C]0.317555[/C][/ROW]
[ROW][C]46[/C][C]0.644559[/C][C]0.710882[/C][C]0.355441[/C][/ROW]
[ROW][C]47[/C][C]0.611347[/C][C]0.777306[/C][C]0.388653[/C][/ROW]
[ROW][C]48[/C][C]0.575412[/C][C]0.849176[/C][C]0.424588[/C][/ROW]
[ROW][C]49[/C][C]0.554954[/C][C]0.890092[/C][C]0.445046[/C][/ROW]
[ROW][C]50[/C][C]0.617201[/C][C]0.765598[/C][C]0.382799[/C][/ROW]
[ROW][C]51[/C][C]0.608656[/C][C]0.782688[/C][C]0.391344[/C][/ROW]
[ROW][C]52[/C][C]0.577621[/C][C]0.844758[/C][C]0.422379[/C][/ROW]
[ROW][C]53[/C][C]0.532395[/C][C]0.93521[/C][C]0.467605[/C][/ROW]
[ROW][C]54[/C][C]0.662264[/C][C]0.675471[/C][C]0.337736[/C][/ROW]
[ROW][C]55[/C][C]0.616678[/C][C]0.766644[/C][C]0.383322[/C][/ROW]
[ROW][C]56[/C][C]0.583359[/C][C]0.833281[/C][C]0.416641[/C][/ROW]
[ROW][C]57[/C][C]0.614384[/C][C]0.771232[/C][C]0.385616[/C][/ROW]
[ROW][C]58[/C][C]0.585117[/C][C]0.829766[/C][C]0.414883[/C][/ROW]
[ROW][C]59[/C][C]0.872753[/C][C]0.254494[/C][C]0.127247[/C][/ROW]
[ROW][C]60[/C][C]0.931671[/C][C]0.136658[/C][C]0.0683288[/C][/ROW]
[ROW][C]61[/C][C]0.94756[/C][C]0.104879[/C][C]0.0524395[/C][/ROW]
[ROW][C]62[/C][C]0.948679[/C][C]0.102641[/C][C]0.0513205[/C][/ROW]
[ROW][C]63[/C][C]0.948114[/C][C]0.103771[/C][C]0.0518857[/C][/ROW]
[ROW][C]64[/C][C]0.937568[/C][C]0.124865[/C][C]0.0624323[/C][/ROW]
[ROW][C]65[/C][C]0.952926[/C][C]0.0941488[/C][C]0.0470744[/C][/ROW]
[ROW][C]66[/C][C]0.991437[/C][C]0.0171251[/C][C]0.00856254[/C][/ROW]
[ROW][C]67[/C][C]0.988691[/C][C]0.0226185[/C][C]0.0113092[/C][/ROW]
[ROW][C]68[/C][C]0.985271[/C][C]0.0294587[/C][C]0.0147294[/C][/ROW]
[ROW][C]69[/C][C]0.981753[/C][C]0.0364944[/C][C]0.0182472[/C][/ROW]
[ROW][C]70[/C][C]0.980842[/C][C]0.038317[/C][C]0.0191585[/C][/ROW]
[ROW][C]71[/C][C]0.989993[/C][C]0.0200141[/C][C]0.0100071[/C][/ROW]
[ROW][C]72[/C][C]0.99038[/C][C]0.0192397[/C][C]0.00961983[/C][/ROW]
[ROW][C]73[/C][C]0.998044[/C][C]0.00391121[/C][C]0.00195561[/C][/ROW]
[ROW][C]74[/C][C]0.99734[/C][C]0.00532006[/C][C]0.00266003[/C][/ROW]
[ROW][C]75[/C][C]0.998949[/C][C]0.00210282[/C][C]0.00105141[/C][/ROW]
[ROW][C]76[/C][C]1[/C][C]4.39954e-08[/C][C]2.19977e-08[/C][/ROW]
[ROW][C]77[/C][C]1[/C][C]2.0776e-08[/C][C]1.0388e-08[/C][/ROW]
[ROW][C]78[/C][C]1[/C][C]4.38634e-24[/C][C]2.19317e-24[/C][/ROW]
[ROW][C]79[/C][C]1[/C][C]2.24483e-25[/C][C]1.12242e-25[/C][/ROW]
[ROW][C]80[/C][C]1[/C][C]1.93054e-24[/C][C]9.65268e-25[/C][/ROW]
[ROW][C]81[/C][C]1[/C][C]5.72623e-25[/C][C]2.86311e-25[/C][/ROW]
[ROW][C]82[/C][C]1[/C][C]5.66777e-24[/C][C]2.83389e-24[/C][/ROW]
[ROW][C]83[/C][C]1[/C][C]1.03549e-26[/C][C]5.17744e-27[/C][/ROW]
[ROW][C]84[/C][C]1[/C][C]1.52799e-25[/C][C]7.63993e-26[/C][/ROW]
[ROW][C]85[/C][C]1[/C][C]2.30001e-24[/C][C]1.15e-24[/C][/ROW]
[ROW][C]86[/C][C]1[/C][C]3.27281e-23[/C][C]1.6364e-23[/C][/ROW]
[ROW][C]87[/C][C]1[/C][C]4.71979e-22[/C][C]2.35989e-22[/C][/ROW]
[ROW][C]88[/C][C]1[/C][C]6.40758e-21[/C][C]3.20379e-21[/C][/ROW]
[ROW][C]89[/C][C]1[/C][C]8.49587e-20[/C][C]4.24793e-20[/C][/ROW]
[ROW][C]90[/C][C]1[/C][C]1.03046e-18[/C][C]5.15228e-19[/C][/ROW]
[ROW][C]91[/C][C]1[/C][C]1.1352e-17[/C][C]5.67599e-18[/C][/ROW]
[ROW][C]92[/C][C]1[/C][C]1.3992e-16[/C][C]6.996e-17[/C][/ROW]
[ROW][C]93[/C][C]1[/C][C]1.71853e-15[/C][C]8.59267e-16[/C][/ROW]
[ROW][C]94[/C][C]1[/C][C]2.02336e-14[/C][C]1.01168e-14[/C][/ROW]
[ROW][C]95[/C][C]1[/C][C]2.12871e-13[/C][C]1.06435e-13[/C][/ROW]
[ROW][C]96[/C][C]1[/C][C]2.18265e-12[/C][C]1.09132e-12[/C][/ROW]
[ROW][C]97[/C][C]1[/C][C]2.02177e-11[/C][C]1.01088e-11[/C][/ROW]
[ROW][C]98[/C][C]1[/C][C]1.20576e-10[/C][C]6.02881e-11[/C][/ROW]
[ROW][C]99[/C][C]1[/C][C]8.43285e-10[/C][C]4.21643e-10[/C][/ROW]
[ROW][C]100[/C][C]1[/C][C]8.62921e-09[/C][C]4.31461e-09[/C][/ROW]
[ROW][C]101[/C][C]1[/C][C]6.99977e-08[/C][C]3.49989e-08[/C][/ROW]
[ROW][C]102[/C][C]1[/C][C]6.70076e-07[/C][C]3.35038e-07[/C][/ROW]
[ROW][C]103[/C][C]0.999997[/C][C]5.36472e-06[/C][C]2.68236e-06[/C][/ROW]
[ROW][C]104[/C][C]0.999981[/C][C]3.74355e-05[/C][C]1.87178e-05[/C][/ROW]
[ROW][C]105[/C][C]0.999894[/C][C]0.000211739[/C][C]0.000105869[/C][/ROW]
[ROW][C]106[/C][C]0.999249[/C][C]0.0015016[/C][C]0.000750798[/C][/ROW]
[ROW][C]107[/C][C]0.99433[/C][C]0.011339[/C][C]0.00566952[/C][/ROW]
[/TABLE]
Source: https://freestatistics.org/blog/index.php?pk=266613&T=5

Globally Unique Identifier (entire table): ba.freestatistics.org/blog/index.php?pk=266613&T=5

As an alternative you can also use a QR Code:  

The GUIDs for individual cells are displayed in the table below:

Goldfeld-Quandt test for Heteroskedasticity
p-valuesAlternative Hypothesis
breakpoint indexgreater2-sidedless
90.9813980.03720320.0186016
100.9738810.0522380.026119
110.9491210.1017580.0508792
120.9113070.1773870.0886933
130.9098940.1802120.090106
140.8742280.2515430.125772
150.825590.348820.17441
160.8835470.2329060.116453
170.8338740.3322530.166126
180.7812690.4374610.218731
190.7250230.5499540.274977
200.6541180.6917640.345882
210.596730.806540.40327
220.6606040.6787920.339396
230.7045450.5909110.295455
240.6426610.7146770.357339
250.7047270.5905470.295273
260.6433010.7133990.356699
270.5764340.8471320.423566
280.7489250.5021490.251075
290.7281170.5437650.271883
300.6749980.6500040.325002
310.6179020.7641970.382098
320.7529190.4941620.247081
330.7161080.5677840.283892
340.8772810.2454380.122719
350.8697190.2605610.130281
360.844650.31070.15535
370.8071780.3856430.192822
380.7634590.4730820.236541
390.7230140.5539720.276986
400.6988040.6023910.301196
410.6527840.6944320.347216
420.6138310.7723380.386169
430.7029530.5940950.297047
440.6745220.6509570.325478
450.6824450.635110.317555
460.6445590.7108820.355441
470.6113470.7773060.388653
480.5754120.8491760.424588
490.5549540.8900920.445046
500.6172010.7655980.382799
510.6086560.7826880.391344
520.5776210.8447580.422379
530.5323950.935210.467605
540.6622640.6754710.337736
550.6166780.7666440.383322
560.5833590.8332810.416641
570.6143840.7712320.385616
580.5851170.8297660.414883
590.8727530.2544940.127247
600.9316710.1366580.0683288
610.947560.1048790.0524395
620.9486790.1026410.0513205
630.9481140.1037710.0518857
640.9375680.1248650.0624323
650.9529260.09414880.0470744
660.9914370.01712510.00856254
670.9886910.02261850.0113092
680.9852710.02945870.0147294
690.9817530.03649440.0182472
700.9808420.0383170.0191585
710.9899930.02001410.0100071
720.990380.01923970.00961983
730.9980440.003911210.00195561
740.997340.005320060.00266003
750.9989490.002102820.00105141
7614.39954e-082.19977e-08
7712.0776e-081.0388e-08
7814.38634e-242.19317e-24
7912.24483e-251.12242e-25
8011.93054e-249.65268e-25
8115.72623e-252.86311e-25
8215.66777e-242.83389e-24
8311.03549e-265.17744e-27
8411.52799e-257.63993e-26
8512.30001e-241.15e-24
8613.27281e-231.6364e-23
8714.71979e-222.35989e-22
8816.40758e-213.20379e-21
8918.49587e-204.24793e-20
9011.03046e-185.15228e-19
9111.1352e-175.67599e-18
9211.3992e-166.996e-17
9311.71853e-158.59267e-16
9412.02336e-141.01168e-14
9512.12871e-131.06435e-13
9612.18265e-121.09132e-12
9712.02177e-111.01088e-11
9811.20576e-106.02881e-11
9918.43285e-104.21643e-10
10018.62921e-094.31461e-09
10116.99977e-083.49989e-08
10216.70076e-073.35038e-07
1030.9999975.36472e-062.68236e-06
1040.9999813.74355e-051.87178e-05
1050.9998940.0002117390.000105869
1060.9992490.00150160.000750798
1070.994330.0113390.00566952


Meta Analysis of Goldfeld-Quandt test for Heteroskedasticity
Description# significant tests% significant testsOK/NOK
1% type I error level340.343434NOK
5% type I error level430.434343NOK
10% type I error level450.454545NOK

\begin{tabular}{lllllllll}
\hline
Meta Analysis of Goldfeld-Quandt test for Heteroskedasticity \tabularnewline
Description & # significant tests & % significant tests & OK/NOK \tabularnewline
1% type I error level & 34 & 0.343434 & NOK \tabularnewline
5% type I error level & 43 & 0.434343 & NOK \tabularnewline
10% type I error level & 45 & 0.454545 & NOK \tabularnewline
\hline
\end{tabular}
%Source: https://freestatistics.org/blog/index.php?pk=266613&T=6

[TABLE]
[ROW][C]Meta Analysis of Goldfeld-Quandt test for Heteroskedasticity[/C][/ROW]
[ROW][C]Description[/C][C]# significant tests[/C][C]% significant tests[/C][C]OK/NOK[/C][/ROW]
[ROW][C]1% type I error level[/C][C]34[/C][C]0.343434[/C][C]NOK[/C][/ROW]
[ROW][C]5% type I error level[/C][C]43[/C][C]0.434343[/C][C]NOK[/C][/ROW]
[ROW][C]10% type I error level[/C][C]45[/C][C]0.454545[/C][C]NOK[/C][/ROW]
[/TABLE]
Source: https://freestatistics.org/blog/index.php?pk=266613&T=6

Globally Unique Identifier (entire table): ba.freestatistics.org/blog/index.php?pk=266613&T=6

As an alternative you can also use a QR Code:  

The GUIDs for individual cells are displayed in the table below:

Meta Analysis of Goldfeld-Quandt test for Heteroskedasticity
Description# significant tests% significant testsOK/NOK
1% type I error level340.343434NOK
5% type I error level430.434343NOK
10% type I error level450.454545NOK


Parameters (Session):
par1 = 6 ; par2 = Do not include Seasonal Dummies ; par3 = No Linear Trend ;
Parameters (R input):
par1 = 6 ; par2 = Do not include Seasonal Dummies ; par3 = No Linear Trend ;
R code (references can be found in the software module):
library(lattice)
library(lmtest)
n25 <- 25 #minimum number of obs. for Goldfeld-Quandt test
par1 <- as.numeric(par1)
x <- t(y)
k <- length(x[1,])
n <- length(x[,1])
x1 <- cbind(x[,par1], x[,1:k!=par1])
mycolnames <- c(colnames(x)[par1], colnames(x)[1:k!=par1])
colnames(x1) <- mycolnames #colnames(x)[par1]
x <- x1
if (par3 == 'First Differences'){
x2 <- array(0, dim=c(n-1,k), dimnames=list(1:(n-1), paste('(1-B)',colnames(x),sep='')))
for (i in 1:n-1) {
for (j in 1:k) {
x2[i,j] <- x[i+1,j] - x[i,j]
}
}
x <- x2
}
if (par2 == 'Include Monthly Dummies'){
x2 <- array(0, dim=c(n,11), dimnames=list(1:n, paste('M', seq(1:11), sep ='')))
for (i in 1:11){
x2[seq(i,n,12),i] <- 1
}
x <- cbind(x, x2)
}
if (par2 == 'Include Quarterly Dummies'){
x2 <- array(0, dim=c(n,3), dimnames=list(1:n, paste('Q', seq(1:3), sep ='')))
for (i in 1:3){
x2[seq(i,n,4),i] <- 1
}
x <- cbind(x, x2)
}
k <- length(x[1,])
if (par3 == 'Linear Trend'){
x <- cbind(x, c(1:n))
colnames(x)[k+1] <- 't'
}
x
k <- length(x[1,])
df <- as.data.frame(x)
(mylm <- lm(df))
(mysum <- summary(mylm))
if (n > n25) {
kp3 <- k + 3
nmkm3 <- n - k - 3
gqarr <- array(NA, dim=c(nmkm3-kp3+1,3))
numgqtests <- 0
numsignificant1 <- 0
numsignificant5 <- 0
numsignificant10 <- 0
for (mypoint in kp3:nmkm3) {
j <- 0
numgqtests <- numgqtests + 1
for (myalt in c('greater', 'two.sided', 'less')) {
j <- j + 1
gqarr[mypoint-kp3+1,j] <- gqtest(mylm, point=mypoint, alternative=myalt)$p.value
}
if (gqarr[mypoint-kp3+1,2] < 0.01) numsignificant1 <- numsignificant1 + 1
if (gqarr[mypoint-kp3+1,2] < 0.05) numsignificant5 <- numsignificant5 + 1
if (gqarr[mypoint-kp3+1,2] < 0.10) numsignificant10 <- numsignificant10 + 1
}
gqarr
}
bitmap(file='test0.png')
plot(x[,1], type='l', main='Actuals and Interpolation', ylab='value of Actuals and Interpolation (dots)', xlab='time or index')
points(x[,1]-mysum$resid)
grid()
dev.off()
bitmap(file='test1.png')
plot(mysum$resid, type='b', pch=19, main='Residuals', ylab='value of Residuals', xlab='time or index')
grid()
dev.off()
bitmap(file='test2.png')
hist(mysum$resid, main='Residual Histogram', xlab='values of Residuals')
grid()
dev.off()
bitmap(file='test3.png')
densityplot(~mysum$resid,col='black',main='Residual Density Plot', xlab='values of Residuals')
dev.off()
bitmap(file='test4.png')
qqnorm(mysum$resid, main='Residual Normal Q-Q Plot')
qqline(mysum$resid)
grid()
dev.off()
(myerror <- as.ts(mysum$resid))
bitmap(file='test5.png')
dum <- cbind(lag(myerror,k=1),myerror)
dum
dum1 <- dum[2:length(myerror),]
dum1
z <- as.data.frame(dum1)
z
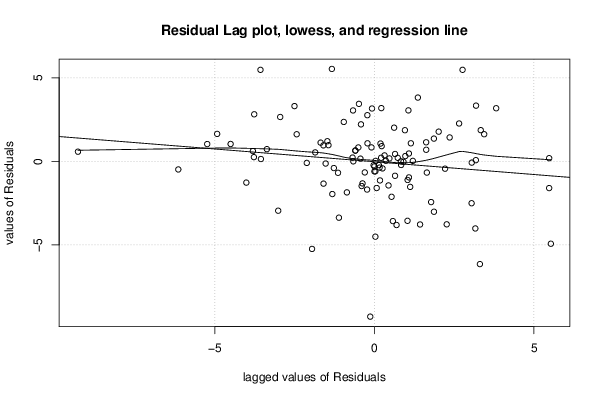
plot(z,main=paste('Residual Lag plot, lowess, and regression line'), ylab='values of Residuals', xlab='lagged values of Residuals')
lines(lowess(z))
abline(lm(z))
grid()
dev.off()
bitmap(file='test6.png')
acf(mysum$resid, lag.max=length(mysum$resid)/2, main='Residual Autocorrelation Function')
grid()
dev.off()
bitmap(file='test7.png')
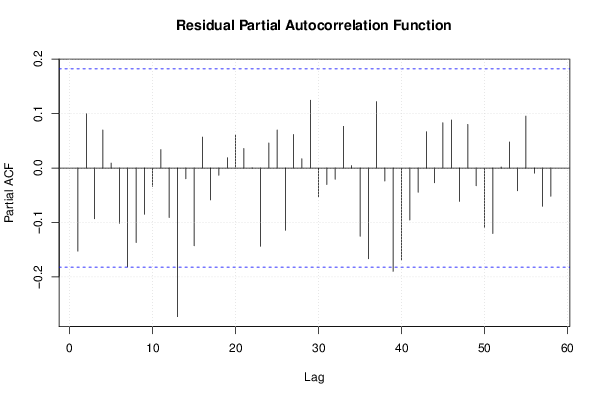
pacf(mysum$resid, lag.max=length(mysum$resid)/2, main='Residual Partial Autocorrelation Function')
grid()
dev.off()
bitmap(file='test8.png')
opar <- par(mfrow = c(2,2), oma = c(0, 0, 1.1, 0))
plot(mylm, las = 1, sub='Residual Diagnostics')
par(opar)
dev.off()
if (n > n25) {
bitmap(file='test9.png')
plot(kp3:nmkm3,gqarr[,2], main='Goldfeld-Quandt test',ylab='2-sided p-value',xlab='breakpoint')
grid()
dev.off()
}
load(file='createtable')
a<-table.start()
a<-table.row.start(a)
a<-table.element(a, 'Multiple Linear Regression - Estimated Regression Equation', 1, TRUE)
a<-table.row.end(a)
myeq <- colnames(x)[1]
myeq <- paste(myeq, '[t] = ', sep='')
for (i in 1:k){
if (mysum$coefficients[i,1] > 0) myeq <- paste(myeq, '+', '')
myeq <- paste(myeq, signif(mysum$coefficients[i,1],6), sep=' ')
if (rownames(mysum$coefficients)[i] != '(Intercept)') {
myeq <- paste(myeq, rownames(mysum$coefficients)[i], sep='')
if (rownames(mysum$coefficients)[i] != 't') myeq <- paste(myeq, '[t]', sep='')
}
}
myeq <- paste(myeq, ' + e[t]')
a<-table.row.start(a)
a<-table.element(a, myeq)
a<-table.row.end(a)
a<-table.end(a)
table.save(a,file='mytable1.tab')
a<-table.start()
a<-table.row.start(a)
a<-table.element(a,hyperlink('ols1.htm','Multiple Linear Regression - Ordinary Least Squares',''), 6, TRUE)
a<-table.row.end(a)
a<-table.row.start(a)
a<-table.element(a,'Variable',header=TRUE)
a<-table.element(a,'Parameter',header=TRUE)
a<-table.element(a,'S.D.',header=TRUE)
a<-table.element(a,'T-STAT
H0: parameter = 0',header=TRUE)
a<-table.element(a,'2-tail p-value',header=TRUE)
a<-table.element(a,'1-tail p-value',header=TRUE)
a<-table.row.end(a)
for (i in 1:k){
a<-table.row.start(a)
a<-table.element(a,rownames(mysum$coefficients)[i],header=TRUE)
a<-table.element(a,signif(mysum$coefficients[i,1],6))
a<-table.element(a, signif(mysum$coefficients[i,2],6))
a<-table.element(a, signif(mysum$coefficients[i,3],4))
a<-table.element(a, signif(mysum$coefficients[i,4],6))
a<-table.element(a, signif(mysum$coefficients[i,4]/2,6))
a<-table.row.end(a)
}
a<-table.end(a)
table.save(a,file='mytable2.tab')
a<-table.start()
a<-table.row.start(a)
a<-table.element(a, 'Multiple Linear Regression - Regression Statistics', 2, TRUE)
a<-table.row.end(a)
a<-table.row.start(a)
a<-table.element(a, 'Multiple R',1,TRUE)
a<-table.element(a, signif(sqrt(mysum$r.squared),6))
a<-table.row.end(a)
a<-table.row.start(a)
a<-table.element(a, 'R-squared',1,TRUE)
a<-table.element(a, signif(mysum$r.squared,6))
a<-table.row.end(a)
a<-table.row.start(a)
a<-table.element(a, 'Adjusted R-squared',1,TRUE)
a<-table.element(a, signif(mysum$adj.r.squared,6))
a<-table.row.end(a)
a<-table.row.start(a)
a<-table.element(a, 'F-TEST (value)',1,TRUE)
a<-table.element(a, signif(mysum$fstatistic[1],6))
a<-table.row.end(a)
a<-table.row.start(a)
a<-table.element(a, 'F-TEST (DF numerator)',1,TRUE)
a<-table.element(a, signif(mysum$fstatistic[2],6))
a<-table.row.end(a)
a<-table.row.start(a)
a<-table.element(a, 'F-TEST (DF denominator)',1,TRUE)
a<-table.element(a, signif(mysum$fstatistic[3],6))
a<-table.row.end(a)
a<-table.row.start(a)
a<-table.element(a, 'p-value',1,TRUE)
a<-table.element(a, signif(1-pf(mysum$fstatistic[1],mysum$fstatistic[2],mysum$fstatistic[3]),6))
a<-table.row.end(a)
a<-table.row.start(a)
a<-table.element(a, 'Multiple Linear Regression - Residual Statistics', 2, TRUE)
a<-table.row.end(a)
a<-table.row.start(a)
a<-table.element(a, 'Residual Standard Deviation',1,TRUE)
a<-table.element(a, signif(mysum$sigma,6))
a<-table.row.end(a)
a<-table.row.start(a)
a<-table.element(a, 'Sum Squared Residuals',1,TRUE)
a<-table.element(a, signif(sum(myerror*myerror),6))
a<-table.row.end(a)
a<-table.end(a)
table.save(a,file='mytable3.tab')
a<-table.start()
a<-table.row.start(a)
a<-table.element(a, 'Multiple Linear Regression - Actuals, Interpolation, and Residuals', 4, TRUE)
a<-table.row.end(a)
a<-table.row.start(a)
a<-table.element(a, 'Time or Index', 1, TRUE)
a<-table.element(a, 'Actuals', 1, TRUE)
a<-table.element(a, 'Interpolation
Forecast', 1, TRUE)
a<-table.element(a, 'Residuals
Prediction Error', 1, TRUE)
a<-table.row.end(a)
for (i in 1:n) {
a<-table.row.start(a)
a<-table.element(a,i, 1, TRUE)
a<-table.element(a,signif(x[i],6))
a<-table.element(a,signif(x[i]-mysum$resid[i],6))
a<-table.element(a,signif(mysum$resid[i],6))
a<-table.row.end(a)
}
a<-table.end(a)
table.save(a,file='mytable4.tab')
if (n > n25) {
a<-table.start()
a<-table.row.start(a)
a<-table.element(a,'Goldfeld-Quandt test for Heteroskedasticity',4,TRUE)
a<-table.row.end(a)
a<-table.row.start(a)
a<-table.element(a,'p-values',header=TRUE)
a<-table.element(a,'Alternative Hypothesis',3,header=TRUE)
a<-table.row.end(a)
a<-table.row.start(a)
a<-table.element(a,'breakpoint index',header=TRUE)
a<-table.element(a,'greater',header=TRUE)
a<-table.element(a,'2-sided',header=TRUE)
a<-table.element(a,'less',header=TRUE)
a<-table.row.end(a)
for (mypoint in kp3:nmkm3) {
a<-table.row.start(a)
a<-table.element(a,mypoint,header=TRUE)
a<-table.element(a,signif(gqarr[mypoint-kp3+1,1],6))
a<-table.element(a,signif(gqarr[mypoint-kp3+1,2],6))
a<-table.element(a,signif(gqarr[mypoint-kp3+1,3],6))
a<-table.row.end(a)
}
a<-table.end(a)
table.save(a,file='mytable5.tab')
a<-table.start()
a<-table.row.start(a)
a<-table.element(a,'Meta Analysis of Goldfeld-Quandt test for Heteroskedasticity',4,TRUE)
a<-table.row.end(a)
a<-table.row.start(a)
a<-table.element(a,'Description',header=TRUE)
a<-table.element(a,'# significant tests',header=TRUE)
a<-table.element(a,'% significant tests',header=TRUE)
a<-table.element(a,'OK/NOK',header=TRUE)
a<-table.row.end(a)
a<-table.row.start(a)
a<-table.element(a,'1% type I error level',header=TRUE)
a<-table.element(a,signif(numsignificant1,6))
a<-table.element(a,signif(numsignificant1/numgqtests,6))
if (numsignificant1/numgqtests < 0.01) dum <- 'OK' else dum <- 'NOK'
a<-table.element(a,dum)
a<-table.row.end(a)
a<-table.row.start(a)
a<-table.element(a,'5% type I error level',header=TRUE)
a<-table.element(a,signif(numsignificant5,6))
a<-table.element(a,signif(numsignificant5/numgqtests,6))
if (numsignificant5/numgqtests < 0.05) dum <- 'OK' else dum <- 'NOK'
a<-table.element(a,dum)
a<-table.row.end(a)
a<-table.row.start(a)
a<-table.element(a,'10% type I error level',header=TRUE)
a<-table.element(a,signif(numsignificant10,6))
a<-table.element(a,signif(numsignificant10/numgqtests,6))
if (numsignificant10/numgqtests < 0.1) dum <- 'OK' else dum <- 'NOK'
a<-table.element(a,dum)
a<-table.row.end(a)
a<-table.end(a)
table.save(a,file='mytable6.tab')
}