Free Statistics

of Irreproducible Research!

Author's title

Author*The author of this computation has been verified*
R Software Modulerwasp_multipleregression.wasp
Title produced by softwareMultiple Regression
Date of computationWed, 10 Dec 2014 16:10:02 +0000
Cite this page as followsStatistical Computations at FreeStatistics.org, Office for Research Development and Education, URL https://freestatistics.org/blog/index.php?v=date/2014/Dec/10/t1418227860znjj66imcsifjkb.htm/, Retrieved Sun, 19 May 2024 13:03:46 +0000
Statistical Computations at FreeStatistics.org, Office for Research Development and Education, URL https://freestatistics.org/blog/index.php?pk=265462, Retrieved Sun, 19 May 2024 13:03:46 +0000
QR Codes:

Original text written by user:
IsPrivate?No (this computation is public)
User-defined keywords
Estimated Impact55
Family? (F = Feedback message, R = changed R code, M = changed R Module, P = changed Parameters, D = changed Data)
-       [Multiple Regression] [multiple regressi...] [2014-12-10 16:10:02] [76a64141a2f0df75ca87242b7cc8f1c2] [Current]
Feedback Forum

Post a new message
Dataseries X:
62 0 72 11 5.0
56 1 61 6 3.0
57 1 68 7 7.5
51 0 61 10 7.0
56 1 64 9 6.0
30 1 65 7 6.0
61 1 69 4 1.0
47 1 63 4 6.0
56 1 75 4 5.0
50 1 63 8 1.0
67 1 73 4 6.5
41 0 75 7 0.0
45 0 63 4 3.5
48 1 63 4 7.5
44 1 62 9 3.5
37 0 64 4 6.0
56 0 60 10 3.5
66 1 56 4 7.5
38 1 59 5 6.5
34 0 68 4 3.5
49 0 66 4 4.0
55 0 73 4 7.5
49 0 72 4 4.5
59 1 71 6 0.0
40 0 59 10 3.5
58 1 64 7 5.5
60 1 66 4 5.0
63 0 78 4 4.5
56 0 68 7 2.5
54 0 73 4 7.5
52 1 62 8 7.0
34 1 65 11 0.0
69 1 68 6 4.5
32 0 65 14 3.0
48 1 60 5 1.5
67 0 71 4 3.5
58 1 65 8 2.5
57 1 68 9 5.5
42 1 64 4 8.0
64 1 74 4 1.0
58 1 69 5 5.0
66 0 76 4 4.5
26 1 68 5 3.0
61 1 72 4 3.0
52 1 67 4 8.0
51 0 63 7 2.5
55 0 59 10 7.0
50 0 73 4 0.0
60 0 66 5 1.0
56 0 62 4 3.5
63 0 69 4 5.5
61 1 66 4 5.5


Summary of computational transaction
Raw Inputview raw input (R code)
Raw Outputview raw output of R engine
Computing time5 seconds
R Server'Gwilym Jenkins' @ jenkins.wessa.net

\begin{tabular}{lllllllll}
\hline
Summary of computational transaction \tabularnewline
Raw Input & view raw input (R code)  \tabularnewline
Raw Output & view raw output of R engine  \tabularnewline
Computing time & 5 seconds \tabularnewline
R Server & 'Gwilym Jenkins' @ jenkins.wessa.net \tabularnewline
\hline
\end{tabular}
%Source: https://freestatistics.org/blog/index.php?pk=265462&T=0

[TABLE]
[ROW][C]Summary of computational transaction[/C][/ROW]
[ROW][C]Raw Input[/C][C]view raw input (R code) [/C][/ROW]
[ROW][C]Raw Output[/C][C]view raw output of R engine [/C][/ROW]
[ROW][C]Computing time[/C][C]5 seconds[/C][/ROW]
[ROW][C]R Server[/C][C]'Gwilym Jenkins' @ jenkins.wessa.net[/C][/ROW]
[/TABLE]
Source: https://freestatistics.org/blog/index.php?pk=265462&T=0

Globally Unique Identifier (entire table): ba.freestatistics.org/blog/index.php?pk=265462&T=0

As an alternative you can also use a QR Code:  

The GUIDs for individual cells are displayed in the table below:

Summary of computational transaction
Raw Inputview raw input (R code)
Raw Outputview raw output of R engine
Computing time5 seconds
R Server'Gwilym Jenkins' @ jenkins.wessa.net


Multiple Linear Regression - Estimated Regression Equation
Ex[t] = + 12.2315 + 0.0267947AMS.I[t] + 0.186487gender[t] -0.125751AMS.E[t] -0.171995AMS.A[t] + e[t]

\begin{tabular}{lllllllll}
\hline
Multiple Linear Regression - Estimated Regression Equation \tabularnewline
Ex[t] =  +  12.2315 +  0.0267947AMS.I[t] +  0.186487gender[t] -0.125751AMS.E[t] -0.171995AMS.A[t]  + e[t] \tabularnewline
\hline
\end{tabular}
%Source: https://freestatistics.org/blog/index.php?pk=265462&T=1

[TABLE]
[ROW][C]Multiple Linear Regression - Estimated Regression Equation[/C][/ROW]
[ROW][C]Ex[t] =  +  12.2315 +  0.0267947AMS.I[t] +  0.186487gender[t] -0.125751AMS.E[t] -0.171995AMS.A[t]  + e[t][/C][/ROW]
[/TABLE]
Source: https://freestatistics.org/blog/index.php?pk=265462&T=1

Globally Unique Identifier (entire table): ba.freestatistics.org/blog/index.php?pk=265462&T=1

As an alternative you can also use a QR Code:  

The GUIDs for individual cells are displayed in the table below:

Multiple Linear Regression - Estimated Regression Equation
Ex[t] = + 12.2315 + 0.0267947AMS.I[t] + 0.186487gender[t] -0.125751AMS.E[t] -0.171995AMS.A[t] + e[t]


Multiple Linear Regression - Ordinary Least Squares
VariableParameterS.D.T-STATH0: parameter = 02-tail p-value1-tail p-value
(Intercept)12.23155.108412.3940.0206890.0103445
AMS.I0.02679470.03344260.80120.4270390.21352
gender0.1864870.6662350.27990.7807730.390387
AMS.E-0.1257510.0714208-1.7610.08479390.0423969
AMS.A-0.1719950.139303-1.2350.2230860.111543

\begin{tabular}{lllllllll}
\hline
Multiple Linear Regression - Ordinary Least Squares \tabularnewline
Variable & Parameter & S.D. & T-STATH0: parameter = 0 & 2-tail p-value & 1-tail p-value \tabularnewline
(Intercept) & 12.2315 & 5.10841 & 2.394 & 0.020689 & 0.0103445 \tabularnewline
AMS.I & 0.0267947 & 0.0334426 & 0.8012 & 0.427039 & 0.21352 \tabularnewline
gender & 0.186487 & 0.666235 & 0.2799 & 0.780773 & 0.390387 \tabularnewline
AMS.E & -0.125751 & 0.0714208 & -1.761 & 0.0847939 & 0.0423969 \tabularnewline
AMS.A & -0.171995 & 0.139303 & -1.235 & 0.223086 & 0.111543 \tabularnewline
\hline
\end{tabular}
%Source: https://freestatistics.org/blog/index.php?pk=265462&T=2

[TABLE]
[ROW][C]Multiple Linear Regression - Ordinary Least Squares[/C][/ROW]
[ROW][C]Variable[/C][C]Parameter[/C][C]S.D.[/C][C]T-STATH0: parameter = 0[/C][C]2-tail p-value[/C][C]1-tail p-value[/C][/ROW]
[ROW][C](Intercept)[/C][C]12.2315[/C][C]5.10841[/C][C]2.394[/C][C]0.020689[/C][C]0.0103445[/C][/ROW]
[ROW][C]AMS.I[/C][C]0.0267947[/C][C]0.0334426[/C][C]0.8012[/C][C]0.427039[/C][C]0.21352[/C][/ROW]
[ROW][C]gender[/C][C]0.186487[/C][C]0.666235[/C][C]0.2799[/C][C]0.780773[/C][C]0.390387[/C][/ROW]
[ROW][C]AMS.E[/C][C]-0.125751[/C][C]0.0714208[/C][C]-1.761[/C][C]0.0847939[/C][C]0.0423969[/C][/ROW]
[ROW][C]AMS.A[/C][C]-0.171995[/C][C]0.139303[/C][C]-1.235[/C][C]0.223086[/C][C]0.111543[/C][/ROW]
[/TABLE]
Source: https://freestatistics.org/blog/index.php?pk=265462&T=2

Globally Unique Identifier (entire table): ba.freestatistics.org/blog/index.php?pk=265462&T=2

As an alternative you can also use a QR Code:  

The GUIDs for individual cells are displayed in the table below:

Multiple Linear Regression - Ordinary Least Squares
VariableParameterS.D.T-STATH0: parameter = 02-tail p-value1-tail p-value
(Intercept)12.23155.108412.3940.0206890.0103445
AMS.I0.02679470.03344260.80120.4270390.21352
gender0.1864870.6662350.27990.7807730.390387
AMS.E-0.1257510.0714208-1.7610.08479390.0423969
AMS.A-0.1719950.139303-1.2350.2230860.111543


Multiple Linear Regression - Regression Statistics
Multiple R0.297734
R-squared0.0886456
Adjusted R-squared0.0110835
F-TEST (value)1.1429
F-TEST (DF numerator)4
F-TEST (DF denominator)47
p-value0.348056
Multiple Linear Regression - Residual Statistics
Residual Standard Deviation2.31315
Sum Squared Residuals251.481

\begin{tabular}{lllllllll}
\hline
Multiple Linear Regression - Regression Statistics \tabularnewline
Multiple R & 0.297734 \tabularnewline
R-squared & 0.0886456 \tabularnewline
Adjusted R-squared & 0.0110835 \tabularnewline
F-TEST (value) & 1.1429 \tabularnewline
F-TEST (DF numerator) & 4 \tabularnewline
F-TEST (DF denominator) & 47 \tabularnewline
p-value & 0.348056 \tabularnewline
Multiple Linear Regression - Residual Statistics \tabularnewline
Residual Standard Deviation & 2.31315 \tabularnewline
Sum Squared Residuals & 251.481 \tabularnewline
\hline
\end{tabular}
%Source: https://freestatistics.org/blog/index.php?pk=265462&T=3

[TABLE]
[ROW][C]Multiple Linear Regression - Regression Statistics[/C][/ROW]
[ROW][C]Multiple R[/C][C]0.297734[/C][/ROW]
[ROW][C]R-squared[/C][C]0.0886456[/C][/ROW]
[ROW][C]Adjusted R-squared[/C][C]0.0110835[/C][/ROW]
[ROW][C]F-TEST (value)[/C][C]1.1429[/C][/ROW]
[ROW][C]F-TEST (DF numerator)[/C][C]4[/C][/ROW]
[ROW][C]F-TEST (DF denominator)[/C][C]47[/C][/ROW]
[ROW][C]p-value[/C][C]0.348056[/C][/ROW]
[ROW][C]Multiple Linear Regression - Residual Statistics[/C][/ROW]
[ROW][C]Residual Standard Deviation[/C][C]2.31315[/C][/ROW]
[ROW][C]Sum Squared Residuals[/C][C]251.481[/C][/ROW]
[/TABLE]
Source: https://freestatistics.org/blog/index.php?pk=265462&T=3

Globally Unique Identifier (entire table): ba.freestatistics.org/blog/index.php?pk=265462&T=3

As an alternative you can also use a QR Code:  

The GUIDs for individual cells are displayed in the table below:

Multiple Linear Regression - Regression Statistics
Multiple R0.297734
R-squared0.0886456
Adjusted R-squared0.0110835
F-TEST (value)1.1429
F-TEST (DF numerator)4
F-TEST (DF denominator)47
p-value0.348056
Multiple Linear Regression - Residual Statistics
Residual Standard Deviation2.31315
Sum Squared Residuals251.481


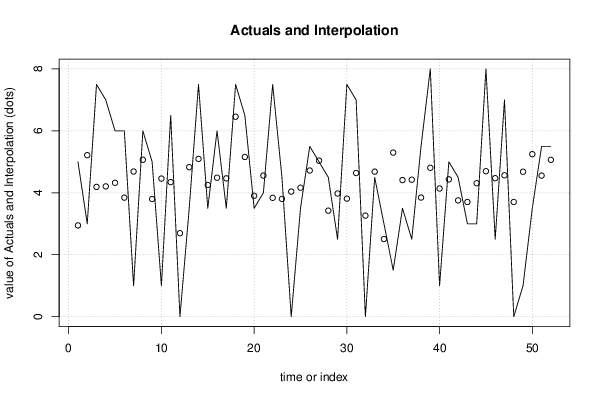
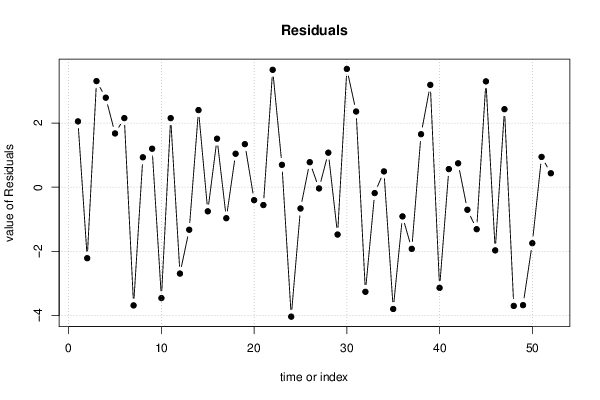
Multiple Linear Regression - Actuals, Interpolation, and Residuals
Time or IndexActualsInterpolationForecastResidualsPrediction Error
152.946762.05324
235.21571-2.21571
37.54.190263.30974
474.207272.79273
564.322481.67752
663.844052.15595
714.68767-3.68767
865.067050.932953
953.799191.20081
1014.45945-3.45945
116.54.345432.15457
1202.6948-2.6948
133.54.82697-1.32697
147.55.093842.40616
153.54.25244-0.752441
1664.486861.51314
173.54.467-0.966997
187.56.45641.0436
196.55.15691.3431
203.53.90347-0.403473
2144.5569-0.556896
227.53.837413.66259
234.53.802390.69761
2404.03859-4.03859
253.54.16403-0.664033
265.54.720050.779946
2755.03812-0.0381249
284.53.423011.07699
292.53.97697-1.47697
307.53.810613.68939
3174.638792.36121
3203.26325-3.26325
334.54.68379-0.183786
3432.507190.492809
351.55.2991-3.7991
363.54.41045-0.910446
372.54.42231-1.92231
385.53.846271.65373
3984.807323.19268
4014.1393-3.1393
4154.435290.564712
424.53.75490.745104
4333.70361-0.703609
4434.31041-1.31041
4584.698023.30198
462.54.47175-1.97175
4774.565952.43405
4803.70343-3.70343
4914.67964-3.67964
503.55.24746-1.74746
515.54.554770.945231
525.55.064920.43508

\begin{tabular}{lllllllll}
\hline
Multiple Linear Regression - Actuals, Interpolation, and Residuals \tabularnewline
Time or Index & Actuals & InterpolationForecast & ResidualsPrediction Error \tabularnewline
1 & 5 & 2.94676 & 2.05324 \tabularnewline
2 & 3 & 5.21571 & -2.21571 \tabularnewline
3 & 7.5 & 4.19026 & 3.30974 \tabularnewline
4 & 7 & 4.20727 & 2.79273 \tabularnewline
5 & 6 & 4.32248 & 1.67752 \tabularnewline
6 & 6 & 3.84405 & 2.15595 \tabularnewline
7 & 1 & 4.68767 & -3.68767 \tabularnewline
8 & 6 & 5.06705 & 0.932953 \tabularnewline
9 & 5 & 3.79919 & 1.20081 \tabularnewline
10 & 1 & 4.45945 & -3.45945 \tabularnewline
11 & 6.5 & 4.34543 & 2.15457 \tabularnewline
12 & 0 & 2.6948 & -2.6948 \tabularnewline
13 & 3.5 & 4.82697 & -1.32697 \tabularnewline
14 & 7.5 & 5.09384 & 2.40616 \tabularnewline
15 & 3.5 & 4.25244 & -0.752441 \tabularnewline
16 & 6 & 4.48686 & 1.51314 \tabularnewline
17 & 3.5 & 4.467 & -0.966997 \tabularnewline
18 & 7.5 & 6.4564 & 1.0436 \tabularnewline
19 & 6.5 & 5.1569 & 1.3431 \tabularnewline
20 & 3.5 & 3.90347 & -0.403473 \tabularnewline
21 & 4 & 4.5569 & -0.556896 \tabularnewline
22 & 7.5 & 3.83741 & 3.66259 \tabularnewline
23 & 4.5 & 3.80239 & 0.69761 \tabularnewline
24 & 0 & 4.03859 & -4.03859 \tabularnewline
25 & 3.5 & 4.16403 & -0.664033 \tabularnewline
26 & 5.5 & 4.72005 & 0.779946 \tabularnewline
27 & 5 & 5.03812 & -0.0381249 \tabularnewline
28 & 4.5 & 3.42301 & 1.07699 \tabularnewline
29 & 2.5 & 3.97697 & -1.47697 \tabularnewline
30 & 7.5 & 3.81061 & 3.68939 \tabularnewline
31 & 7 & 4.63879 & 2.36121 \tabularnewline
32 & 0 & 3.26325 & -3.26325 \tabularnewline
33 & 4.5 & 4.68379 & -0.183786 \tabularnewline
34 & 3 & 2.50719 & 0.492809 \tabularnewline
35 & 1.5 & 5.2991 & -3.7991 \tabularnewline
36 & 3.5 & 4.41045 & -0.910446 \tabularnewline
37 & 2.5 & 4.42231 & -1.92231 \tabularnewline
38 & 5.5 & 3.84627 & 1.65373 \tabularnewline
39 & 8 & 4.80732 & 3.19268 \tabularnewline
40 & 1 & 4.1393 & -3.1393 \tabularnewline
41 & 5 & 4.43529 & 0.564712 \tabularnewline
42 & 4.5 & 3.7549 & 0.745104 \tabularnewline
43 & 3 & 3.70361 & -0.703609 \tabularnewline
44 & 3 & 4.31041 & -1.31041 \tabularnewline
45 & 8 & 4.69802 & 3.30198 \tabularnewline
46 & 2.5 & 4.47175 & -1.97175 \tabularnewline
47 & 7 & 4.56595 & 2.43405 \tabularnewline
48 & 0 & 3.70343 & -3.70343 \tabularnewline
49 & 1 & 4.67964 & -3.67964 \tabularnewline
50 & 3.5 & 5.24746 & -1.74746 \tabularnewline
51 & 5.5 & 4.55477 & 0.945231 \tabularnewline
52 & 5.5 & 5.06492 & 0.43508 \tabularnewline
\hline
\end{tabular}
%Source: https://freestatistics.org/blog/index.php?pk=265462&T=4

[TABLE]
[ROW][C]Multiple Linear Regression - Actuals, Interpolation, and Residuals[/C][/ROW]
[ROW][C]Time or Index[/C][C]Actuals[/C][C]InterpolationForecast[/C][C]ResidualsPrediction Error[/C][/ROW]
[ROW][C]1[/C][C]5[/C][C]2.94676[/C][C]2.05324[/C][/ROW]
[ROW][C]2[/C][C]3[/C][C]5.21571[/C][C]-2.21571[/C][/ROW]
[ROW][C]3[/C][C]7.5[/C][C]4.19026[/C][C]3.30974[/C][/ROW]
[ROW][C]4[/C][C]7[/C][C]4.20727[/C][C]2.79273[/C][/ROW]
[ROW][C]5[/C][C]6[/C][C]4.32248[/C][C]1.67752[/C][/ROW]
[ROW][C]6[/C][C]6[/C][C]3.84405[/C][C]2.15595[/C][/ROW]
[ROW][C]7[/C][C]1[/C][C]4.68767[/C][C]-3.68767[/C][/ROW]
[ROW][C]8[/C][C]6[/C][C]5.06705[/C][C]0.932953[/C][/ROW]
[ROW][C]9[/C][C]5[/C][C]3.79919[/C][C]1.20081[/C][/ROW]
[ROW][C]10[/C][C]1[/C][C]4.45945[/C][C]-3.45945[/C][/ROW]
[ROW][C]11[/C][C]6.5[/C][C]4.34543[/C][C]2.15457[/C][/ROW]
[ROW][C]12[/C][C]0[/C][C]2.6948[/C][C]-2.6948[/C][/ROW]
[ROW][C]13[/C][C]3.5[/C][C]4.82697[/C][C]-1.32697[/C][/ROW]
[ROW][C]14[/C][C]7.5[/C][C]5.09384[/C][C]2.40616[/C][/ROW]
[ROW][C]15[/C][C]3.5[/C][C]4.25244[/C][C]-0.752441[/C][/ROW]
[ROW][C]16[/C][C]6[/C][C]4.48686[/C][C]1.51314[/C][/ROW]
[ROW][C]17[/C][C]3.5[/C][C]4.467[/C][C]-0.966997[/C][/ROW]
[ROW][C]18[/C][C]7.5[/C][C]6.4564[/C][C]1.0436[/C][/ROW]
[ROW][C]19[/C][C]6.5[/C][C]5.1569[/C][C]1.3431[/C][/ROW]
[ROW][C]20[/C][C]3.5[/C][C]3.90347[/C][C]-0.403473[/C][/ROW]
[ROW][C]21[/C][C]4[/C][C]4.5569[/C][C]-0.556896[/C][/ROW]
[ROW][C]22[/C][C]7.5[/C][C]3.83741[/C][C]3.66259[/C][/ROW]
[ROW][C]23[/C][C]4.5[/C][C]3.80239[/C][C]0.69761[/C][/ROW]
[ROW][C]24[/C][C]0[/C][C]4.03859[/C][C]-4.03859[/C][/ROW]
[ROW][C]25[/C][C]3.5[/C][C]4.16403[/C][C]-0.664033[/C][/ROW]
[ROW][C]26[/C][C]5.5[/C][C]4.72005[/C][C]0.779946[/C][/ROW]
[ROW][C]27[/C][C]5[/C][C]5.03812[/C][C]-0.0381249[/C][/ROW]
[ROW][C]28[/C][C]4.5[/C][C]3.42301[/C][C]1.07699[/C][/ROW]
[ROW][C]29[/C][C]2.5[/C][C]3.97697[/C][C]-1.47697[/C][/ROW]
[ROW][C]30[/C][C]7.5[/C][C]3.81061[/C][C]3.68939[/C][/ROW]
[ROW][C]31[/C][C]7[/C][C]4.63879[/C][C]2.36121[/C][/ROW]
[ROW][C]32[/C][C]0[/C][C]3.26325[/C][C]-3.26325[/C][/ROW]
[ROW][C]33[/C][C]4.5[/C][C]4.68379[/C][C]-0.183786[/C][/ROW]
[ROW][C]34[/C][C]3[/C][C]2.50719[/C][C]0.492809[/C][/ROW]
[ROW][C]35[/C][C]1.5[/C][C]5.2991[/C][C]-3.7991[/C][/ROW]
[ROW][C]36[/C][C]3.5[/C][C]4.41045[/C][C]-0.910446[/C][/ROW]
[ROW][C]37[/C][C]2.5[/C][C]4.42231[/C][C]-1.92231[/C][/ROW]
[ROW][C]38[/C][C]5.5[/C][C]3.84627[/C][C]1.65373[/C][/ROW]
[ROW][C]39[/C][C]8[/C][C]4.80732[/C][C]3.19268[/C][/ROW]
[ROW][C]40[/C][C]1[/C][C]4.1393[/C][C]-3.1393[/C][/ROW]
[ROW][C]41[/C][C]5[/C][C]4.43529[/C][C]0.564712[/C][/ROW]
[ROW][C]42[/C][C]4.5[/C][C]3.7549[/C][C]0.745104[/C][/ROW]
[ROW][C]43[/C][C]3[/C][C]3.70361[/C][C]-0.703609[/C][/ROW]
[ROW][C]44[/C][C]3[/C][C]4.31041[/C][C]-1.31041[/C][/ROW]
[ROW][C]45[/C][C]8[/C][C]4.69802[/C][C]3.30198[/C][/ROW]
[ROW][C]46[/C][C]2.5[/C][C]4.47175[/C][C]-1.97175[/C][/ROW]
[ROW][C]47[/C][C]7[/C][C]4.56595[/C][C]2.43405[/C][/ROW]
[ROW][C]48[/C][C]0[/C][C]3.70343[/C][C]-3.70343[/C][/ROW]
[ROW][C]49[/C][C]1[/C][C]4.67964[/C][C]-3.67964[/C][/ROW]
[ROW][C]50[/C][C]3.5[/C][C]5.24746[/C][C]-1.74746[/C][/ROW]
[ROW][C]51[/C][C]5.5[/C][C]4.55477[/C][C]0.945231[/C][/ROW]
[ROW][C]52[/C][C]5.5[/C][C]5.06492[/C][C]0.43508[/C][/ROW]
[/TABLE]
Source: https://freestatistics.org/blog/index.php?pk=265462&T=4

Globally Unique Identifier (entire table): ba.freestatistics.org/blog/index.php?pk=265462&T=4

As an alternative you can also use a QR Code:  

The GUIDs for individual cells are displayed in the table below:

Multiple Linear Regression - Actuals, Interpolation, and Residuals
Time or IndexActualsInterpolationForecastResidualsPrediction Error
152.946762.05324
235.21571-2.21571
37.54.190263.30974
474.207272.79273
564.322481.67752
663.844052.15595
714.68767-3.68767
865.067050.932953
953.799191.20081
1014.45945-3.45945
116.54.345432.15457
1202.6948-2.6948
133.54.82697-1.32697
147.55.093842.40616
153.54.25244-0.752441
1664.486861.51314
173.54.467-0.966997
187.56.45641.0436
196.55.15691.3431
203.53.90347-0.403473
2144.5569-0.556896
227.53.837413.66259
234.53.802390.69761
2404.03859-4.03859
253.54.16403-0.664033
265.54.720050.779946
2755.03812-0.0381249
284.53.423011.07699
292.53.97697-1.47697
307.53.810613.68939
3174.638792.36121
3203.26325-3.26325
334.54.68379-0.183786
3432.507190.492809
351.55.2991-3.7991
363.54.41045-0.910446
372.54.42231-1.92231
385.53.846271.65373
3984.807323.19268
4014.1393-3.1393
4154.435290.564712
424.53.75490.745104
4333.70361-0.703609
4434.31041-1.31041
4584.698023.30198
462.54.47175-1.97175
4774.565952.43405
4803.70343-3.70343
4914.67964-3.67964
503.55.24746-1.74746
515.54.554770.945231
525.55.064920.43508


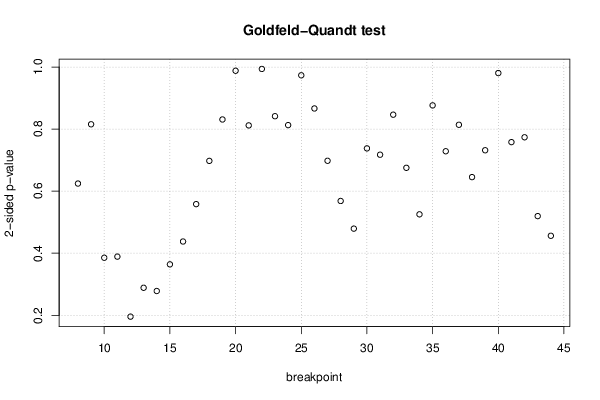
Goldfeld-Quandt test for Heteroskedasticity
p-valuesAlternative Hypothesis
breakpoint indexgreater2-sidedless
80.6877580.6244850.312242
90.5922880.8154230.407712
100.8073180.3853640.192682
110.8054940.3890110.194506
120.9021920.1956170.0978084
130.8556630.2886740.144337
140.8608870.2782250.139113
150.8179330.3641330.182067
160.7811320.4377350.218868
170.7209330.5581330.279067
180.6512410.6975180.348759
190.5845490.8309030.415451
200.493970.987940.50603
210.4059270.8118540.594073
220.5031330.9937340.496867
230.420720.8414410.57928
240.5936150.8127690.406385
250.5133550.973290.486645
260.4331950.8663890.566805
270.3489340.6978680.651066
280.2841730.5683450.715827
290.2396010.4792020.760399
300.3688940.7377890.631106
310.3586830.7173650.641317
320.4231790.8463570.576821
330.3375930.6751850.662407
340.2626680.5253370.737332
350.4381770.8763550.561823
360.3642960.7285930.635704
370.4069210.8138430.593079
380.322630.645260.67737
390.365880.7317610.63412
400.490210.980420.50979
410.3789520.7579040.621048
420.3867920.7735850.613208
430.2597840.5195690.740216
440.2281150.456230.771885

\begin{tabular}{lllllllll}
\hline
Goldfeld-Quandt test for Heteroskedasticity \tabularnewline
p-values & Alternative Hypothesis \tabularnewline
breakpoint index & greater & 2-sided & less \tabularnewline
8 & 0.687758 & 0.624485 & 0.312242 \tabularnewline
9 & 0.592288 & 0.815423 & 0.407712 \tabularnewline
10 & 0.807318 & 0.385364 & 0.192682 \tabularnewline
11 & 0.805494 & 0.389011 & 0.194506 \tabularnewline
12 & 0.902192 & 0.195617 & 0.0978084 \tabularnewline
13 & 0.855663 & 0.288674 & 0.144337 \tabularnewline
14 & 0.860887 & 0.278225 & 0.139113 \tabularnewline
15 & 0.817933 & 0.364133 & 0.182067 \tabularnewline
16 & 0.781132 & 0.437735 & 0.218868 \tabularnewline
17 & 0.720933 & 0.558133 & 0.279067 \tabularnewline
18 & 0.651241 & 0.697518 & 0.348759 \tabularnewline
19 & 0.584549 & 0.830903 & 0.415451 \tabularnewline
20 & 0.49397 & 0.98794 & 0.50603 \tabularnewline
21 & 0.405927 & 0.811854 & 0.594073 \tabularnewline
22 & 0.503133 & 0.993734 & 0.496867 \tabularnewline
23 & 0.42072 & 0.841441 & 0.57928 \tabularnewline
24 & 0.593615 & 0.812769 & 0.406385 \tabularnewline
25 & 0.513355 & 0.97329 & 0.486645 \tabularnewline
26 & 0.433195 & 0.866389 & 0.566805 \tabularnewline
27 & 0.348934 & 0.697868 & 0.651066 \tabularnewline
28 & 0.284173 & 0.568345 & 0.715827 \tabularnewline
29 & 0.239601 & 0.479202 & 0.760399 \tabularnewline
30 & 0.368894 & 0.737789 & 0.631106 \tabularnewline
31 & 0.358683 & 0.717365 & 0.641317 \tabularnewline
32 & 0.423179 & 0.846357 & 0.576821 \tabularnewline
33 & 0.337593 & 0.675185 & 0.662407 \tabularnewline
34 & 0.262668 & 0.525337 & 0.737332 \tabularnewline
35 & 0.438177 & 0.876355 & 0.561823 \tabularnewline
36 & 0.364296 & 0.728593 & 0.635704 \tabularnewline
37 & 0.406921 & 0.813843 & 0.593079 \tabularnewline
38 & 0.32263 & 0.64526 & 0.67737 \tabularnewline
39 & 0.36588 & 0.731761 & 0.63412 \tabularnewline
40 & 0.49021 & 0.98042 & 0.50979 \tabularnewline
41 & 0.378952 & 0.757904 & 0.621048 \tabularnewline
42 & 0.386792 & 0.773585 & 0.613208 \tabularnewline
43 & 0.259784 & 0.519569 & 0.740216 \tabularnewline
44 & 0.228115 & 0.45623 & 0.771885 \tabularnewline
\hline
\end{tabular}
%Source: https://freestatistics.org/blog/index.php?pk=265462&T=5

[TABLE]
[ROW][C]Goldfeld-Quandt test for Heteroskedasticity[/C][/ROW]
[ROW][C]p-values[/C][C]Alternative Hypothesis[/C][/ROW]
[ROW][C]breakpoint index[/C][C]greater[/C][C]2-sided[/C][C]less[/C][/ROW]
[ROW][C]8[/C][C]0.687758[/C][C]0.624485[/C][C]0.312242[/C][/ROW]
[ROW][C]9[/C][C]0.592288[/C][C]0.815423[/C][C]0.407712[/C][/ROW]
[ROW][C]10[/C][C]0.807318[/C][C]0.385364[/C][C]0.192682[/C][/ROW]
[ROW][C]11[/C][C]0.805494[/C][C]0.389011[/C][C]0.194506[/C][/ROW]
[ROW][C]12[/C][C]0.902192[/C][C]0.195617[/C][C]0.0978084[/C][/ROW]
[ROW][C]13[/C][C]0.855663[/C][C]0.288674[/C][C]0.144337[/C][/ROW]
[ROW][C]14[/C][C]0.860887[/C][C]0.278225[/C][C]0.139113[/C][/ROW]
[ROW][C]15[/C][C]0.817933[/C][C]0.364133[/C][C]0.182067[/C][/ROW]
[ROW][C]16[/C][C]0.781132[/C][C]0.437735[/C][C]0.218868[/C][/ROW]
[ROW][C]17[/C][C]0.720933[/C][C]0.558133[/C][C]0.279067[/C][/ROW]
[ROW][C]18[/C][C]0.651241[/C][C]0.697518[/C][C]0.348759[/C][/ROW]
[ROW][C]19[/C][C]0.584549[/C][C]0.830903[/C][C]0.415451[/C][/ROW]
[ROW][C]20[/C][C]0.49397[/C][C]0.98794[/C][C]0.50603[/C][/ROW]
[ROW][C]21[/C][C]0.405927[/C][C]0.811854[/C][C]0.594073[/C][/ROW]
[ROW][C]22[/C][C]0.503133[/C][C]0.993734[/C][C]0.496867[/C][/ROW]
[ROW][C]23[/C][C]0.42072[/C][C]0.841441[/C][C]0.57928[/C][/ROW]
[ROW][C]24[/C][C]0.593615[/C][C]0.812769[/C][C]0.406385[/C][/ROW]
[ROW][C]25[/C][C]0.513355[/C][C]0.97329[/C][C]0.486645[/C][/ROW]
[ROW][C]26[/C][C]0.433195[/C][C]0.866389[/C][C]0.566805[/C][/ROW]
[ROW][C]27[/C][C]0.348934[/C][C]0.697868[/C][C]0.651066[/C][/ROW]
[ROW][C]28[/C][C]0.284173[/C][C]0.568345[/C][C]0.715827[/C][/ROW]
[ROW][C]29[/C][C]0.239601[/C][C]0.479202[/C][C]0.760399[/C][/ROW]
[ROW][C]30[/C][C]0.368894[/C][C]0.737789[/C][C]0.631106[/C][/ROW]
[ROW][C]31[/C][C]0.358683[/C][C]0.717365[/C][C]0.641317[/C][/ROW]
[ROW][C]32[/C][C]0.423179[/C][C]0.846357[/C][C]0.576821[/C][/ROW]
[ROW][C]33[/C][C]0.337593[/C][C]0.675185[/C][C]0.662407[/C][/ROW]
[ROW][C]34[/C][C]0.262668[/C][C]0.525337[/C][C]0.737332[/C][/ROW]
[ROW][C]35[/C][C]0.438177[/C][C]0.876355[/C][C]0.561823[/C][/ROW]
[ROW][C]36[/C][C]0.364296[/C][C]0.728593[/C][C]0.635704[/C][/ROW]
[ROW][C]37[/C][C]0.406921[/C][C]0.813843[/C][C]0.593079[/C][/ROW]
[ROW][C]38[/C][C]0.32263[/C][C]0.64526[/C][C]0.67737[/C][/ROW]
[ROW][C]39[/C][C]0.36588[/C][C]0.731761[/C][C]0.63412[/C][/ROW]
[ROW][C]40[/C][C]0.49021[/C][C]0.98042[/C][C]0.50979[/C][/ROW]
[ROW][C]41[/C][C]0.378952[/C][C]0.757904[/C][C]0.621048[/C][/ROW]
[ROW][C]42[/C][C]0.386792[/C][C]0.773585[/C][C]0.613208[/C][/ROW]
[ROW][C]43[/C][C]0.259784[/C][C]0.519569[/C][C]0.740216[/C][/ROW]
[ROW][C]44[/C][C]0.228115[/C][C]0.45623[/C][C]0.771885[/C][/ROW]
[/TABLE]
Source: https://freestatistics.org/blog/index.php?pk=265462&T=5

Globally Unique Identifier (entire table): ba.freestatistics.org/blog/index.php?pk=265462&T=5

As an alternative you can also use a QR Code:  

The GUIDs for individual cells are displayed in the table below:

Goldfeld-Quandt test for Heteroskedasticity
p-valuesAlternative Hypothesis
breakpoint indexgreater2-sidedless
80.6877580.6244850.312242
90.5922880.8154230.407712
100.8073180.3853640.192682
110.8054940.3890110.194506
120.9021920.1956170.0978084
130.8556630.2886740.144337
140.8608870.2782250.139113
150.8179330.3641330.182067
160.7811320.4377350.218868
170.7209330.5581330.279067
180.6512410.6975180.348759
190.5845490.8309030.415451
200.493970.987940.50603
210.4059270.8118540.594073
220.5031330.9937340.496867
230.420720.8414410.57928
240.5936150.8127690.406385
250.5133550.973290.486645
260.4331950.8663890.566805
270.3489340.6978680.651066
280.2841730.5683450.715827
290.2396010.4792020.760399
300.3688940.7377890.631106
310.3586830.7173650.641317
320.4231790.8463570.576821
330.3375930.6751850.662407
340.2626680.5253370.737332
350.4381770.8763550.561823
360.3642960.7285930.635704
370.4069210.8138430.593079
380.322630.645260.67737
390.365880.7317610.63412
400.490210.980420.50979
410.3789520.7579040.621048
420.3867920.7735850.613208
430.2597840.5195690.740216
440.2281150.456230.771885


Meta Analysis of Goldfeld-Quandt test for Heteroskedasticity
Description# significant tests% significant testsOK/NOK
1% type I error level00OK
5% type I error level00OK
10% type I error level00OK

\begin{tabular}{lllllllll}
\hline
Meta Analysis of Goldfeld-Quandt test for Heteroskedasticity \tabularnewline
Description & # significant tests & % significant tests & OK/NOK \tabularnewline
1% type I error level & 0 & 0 & OK \tabularnewline
5% type I error level & 0 & 0 & OK \tabularnewline
10% type I error level & 0 & 0 & OK \tabularnewline
\hline
\end{tabular}
%Source: https://freestatistics.org/blog/index.php?pk=265462&T=6

[TABLE]
[ROW][C]Meta Analysis of Goldfeld-Quandt test for Heteroskedasticity[/C][/ROW]
[ROW][C]Description[/C][C]# significant tests[/C][C]% significant tests[/C][C]OK/NOK[/C][/ROW]
[ROW][C]1% type I error level[/C][C]0[/C][C]0[/C][C]OK[/C][/ROW]
[ROW][C]5% type I error level[/C][C]0[/C][C]0[/C][C]OK[/C][/ROW]
[ROW][C]10% type I error level[/C][C]0[/C][C]0[/C][C]OK[/C][/ROW]
[/TABLE]
Source: https://freestatistics.org/blog/index.php?pk=265462&T=6

Globally Unique Identifier (entire table): ba.freestatistics.org/blog/index.php?pk=265462&T=6

As an alternative you can also use a QR Code:  

The GUIDs for individual cells are displayed in the table below:

Meta Analysis of Goldfeld-Quandt test for Heteroskedasticity
Description# significant tests% significant testsOK/NOK
1% type I error level00OK
5% type I error level00OK
10% type I error level00OK


Parameters (Session):
par1 = 5 ; par2 = Do not include Seasonal Dummies ; par3 = No Linear Trend ;
Parameters (R input):
par1 = 5 ; par2 = Do not include Seasonal Dummies ; par3 = No Linear Trend ;
R code (references can be found in the software module):
library(lattice)
library(lmtest)
n25 <- 25 #minimum number of obs. for Goldfeld-Quandt test
par1 <- as.numeric(par1)
x <- t(y)
k <- length(x[1,])
n <- length(x[,1])
x1 <- cbind(x[,par1], x[,1:k!=par1])
mycolnames <- c(colnames(x)[par1], colnames(x)[1:k!=par1])
colnames(x1) <- mycolnames #colnames(x)[par1]
x <- x1
if (par3 == 'First Differences'){
x2 <- array(0, dim=c(n-1,k), dimnames=list(1:(n-1), paste('(1-B)',colnames(x),sep='')))
for (i in 1:n-1) {
for (j in 1:k) {
x2[i,j] <- x[i+1,j] - x[i,j]
}
}
x <- x2
}
if (par2 == 'Include Monthly Dummies'){
x2 <- array(0, dim=c(n,11), dimnames=list(1:n, paste('M', seq(1:11), sep ='')))
for (i in 1:11){
x2[seq(i,n,12),i] <- 1
}
x <- cbind(x, x2)
}
if (par2 == 'Include Quarterly Dummies'){
x2 <- array(0, dim=c(n,3), dimnames=list(1:n, paste('Q', seq(1:3), sep ='')))
for (i in 1:3){
x2[seq(i,n,4),i] <- 1
}
x <- cbind(x, x2)
}
k <- length(x[1,])
if (par3 == 'Linear Trend'){
x <- cbind(x, c(1:n))
colnames(x)[k+1] <- 't'
}
x
k <- length(x[1,])
df <- as.data.frame(x)
(mylm <- lm(df))
(mysum <- summary(mylm))
if (n > n25) {
kp3 <- k + 3
nmkm3 <- n - k - 3
gqarr <- array(NA, dim=c(nmkm3-kp3+1,3))
numgqtests <- 0
numsignificant1 <- 0
numsignificant5 <- 0
numsignificant10 <- 0
for (mypoint in kp3:nmkm3) {
j <- 0
numgqtests <- numgqtests + 1
for (myalt in c('greater', 'two.sided', 'less')) {
j <- j + 1
gqarr[mypoint-kp3+1,j] <- gqtest(mylm, point=mypoint, alternative=myalt)$p.value
}
if (gqarr[mypoint-kp3+1,2] < 0.01) numsignificant1 <- numsignificant1 + 1
if (gqarr[mypoint-kp3+1,2] < 0.05) numsignificant5 <- numsignificant5 + 1
if (gqarr[mypoint-kp3+1,2] < 0.10) numsignificant10 <- numsignificant10 + 1
}
gqarr
}
bitmap(file='test0.png')
plot(x[,1], type='l', main='Actuals and Interpolation', ylab='value of Actuals and Interpolation (dots)', xlab='time or index')
points(x[,1]-mysum$resid)
grid()
dev.off()
bitmap(file='test1.png')
plot(mysum$resid, type='b', pch=19, main='Residuals', ylab='value of Residuals', xlab='time or index')
grid()
dev.off()
bitmap(file='test2.png')
hist(mysum$resid, main='Residual Histogram', xlab='values of Residuals')
grid()
dev.off()
bitmap(file='test3.png')
densityplot(~mysum$resid,col='black',main='Residual Density Plot', xlab='values of Residuals')
dev.off()
bitmap(file='test4.png')
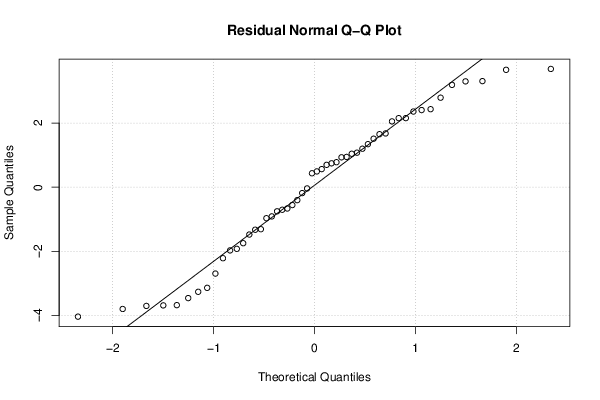
qqnorm(mysum$resid, main='Residual Normal Q-Q Plot')
qqline(mysum$resid)
grid()
dev.off()
(myerror <- as.ts(mysum$resid))
bitmap(file='test5.png')
dum <- cbind(lag(myerror,k=1),myerror)
dum
dum1 <- dum[2:length(myerror),]
dum1
z <- as.data.frame(dum1)
z
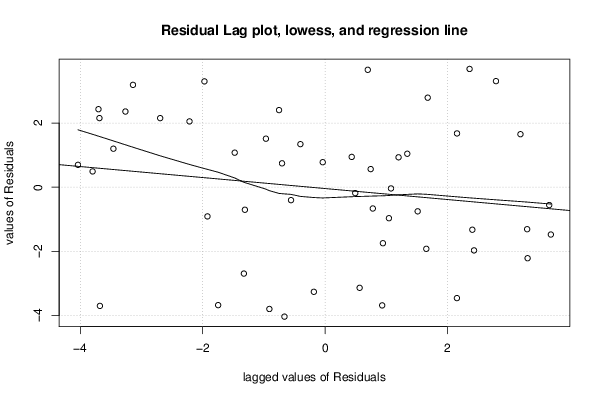
plot(z,main=paste('Residual Lag plot, lowess, and regression line'), ylab='values of Residuals', xlab='lagged values of Residuals')
lines(lowess(z))
abline(lm(z))
grid()
dev.off()
bitmap(file='test6.png')
acf(mysum$resid, lag.max=length(mysum$resid)/2, main='Residual Autocorrelation Function')
grid()
dev.off()
bitmap(file='test7.png')
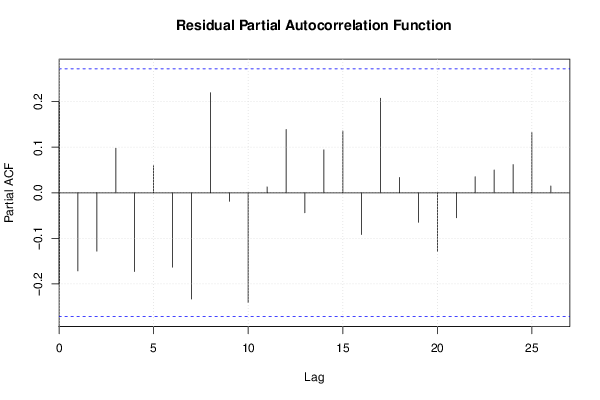
pacf(mysum$resid, lag.max=length(mysum$resid)/2, main='Residual Partial Autocorrelation Function')
grid()
dev.off()
bitmap(file='test8.png')
opar <- par(mfrow = c(2,2), oma = c(0, 0, 1.1, 0))
plot(mylm, las = 1, sub='Residual Diagnostics')
par(opar)
dev.off()
if (n > n25) {
bitmap(file='test9.png')
plot(kp3:nmkm3,gqarr[,2], main='Goldfeld-Quandt test',ylab='2-sided p-value',xlab='breakpoint')
grid()
dev.off()
}
load(file='createtable')
a<-table.start()
a<-table.row.start(a)
a<-table.element(a, 'Multiple Linear Regression - Estimated Regression Equation', 1, TRUE)
a<-table.row.end(a)
myeq <- colnames(x)[1]
myeq <- paste(myeq, '[t] = ', sep='')
for (i in 1:k){
if (mysum$coefficients[i,1] > 0) myeq <- paste(myeq, '+', '')
myeq <- paste(myeq, signif(mysum$coefficients[i,1],6), sep=' ')
if (rownames(mysum$coefficients)[i] != '(Intercept)') {
myeq <- paste(myeq, rownames(mysum$coefficients)[i], sep='')
if (rownames(mysum$coefficients)[i] != 't') myeq <- paste(myeq, '[t]', sep='')
}
}
myeq <- paste(myeq, ' + e[t]')
a<-table.row.start(a)
a<-table.element(a, myeq)
a<-table.row.end(a)
a<-table.end(a)
table.save(a,file='mytable1.tab')
a<-table.start()
a<-table.row.start(a)
a<-table.element(a,hyperlink('ols1.htm','Multiple Linear Regression - Ordinary Least Squares',''), 6, TRUE)
a<-table.row.end(a)
a<-table.row.start(a)
a<-table.element(a,'Variable',header=TRUE)
a<-table.element(a,'Parameter',header=TRUE)
a<-table.element(a,'S.D.',header=TRUE)
a<-table.element(a,'T-STAT
H0: parameter = 0',header=TRUE)
a<-table.element(a,'2-tail p-value',header=TRUE)
a<-table.element(a,'1-tail p-value',header=TRUE)
a<-table.row.end(a)
for (i in 1:k){
a<-table.row.start(a)
a<-table.element(a,rownames(mysum$coefficients)[i],header=TRUE)
a<-table.element(a,signif(mysum$coefficients[i,1],6))
a<-table.element(a, signif(mysum$coefficients[i,2],6))
a<-table.element(a, signif(mysum$coefficients[i,3],4))
a<-table.element(a, signif(mysum$coefficients[i,4],6))
a<-table.element(a, signif(mysum$coefficients[i,4]/2,6))
a<-table.row.end(a)
}
a<-table.end(a)
table.save(a,file='mytable2.tab')
a<-table.start()
a<-table.row.start(a)
a<-table.element(a, 'Multiple Linear Regression - Regression Statistics', 2, TRUE)
a<-table.row.end(a)
a<-table.row.start(a)
a<-table.element(a, 'Multiple R',1,TRUE)
a<-table.element(a, signif(sqrt(mysum$r.squared),6))
a<-table.row.end(a)
a<-table.row.start(a)
a<-table.element(a, 'R-squared',1,TRUE)
a<-table.element(a, signif(mysum$r.squared,6))
a<-table.row.end(a)
a<-table.row.start(a)
a<-table.element(a, 'Adjusted R-squared',1,TRUE)
a<-table.element(a, signif(mysum$adj.r.squared,6))
a<-table.row.end(a)
a<-table.row.start(a)
a<-table.element(a, 'F-TEST (value)',1,TRUE)
a<-table.element(a, signif(mysum$fstatistic[1],6))
a<-table.row.end(a)
a<-table.row.start(a)
a<-table.element(a, 'F-TEST (DF numerator)',1,TRUE)
a<-table.element(a, signif(mysum$fstatistic[2],6))
a<-table.row.end(a)
a<-table.row.start(a)
a<-table.element(a, 'F-TEST (DF denominator)',1,TRUE)
a<-table.element(a, signif(mysum$fstatistic[3],6))
a<-table.row.end(a)
a<-table.row.start(a)
a<-table.element(a, 'p-value',1,TRUE)
a<-table.element(a, signif(1-pf(mysum$fstatistic[1],mysum$fstatistic[2],mysum$fstatistic[3]),6))
a<-table.row.end(a)
a<-table.row.start(a)
a<-table.element(a, 'Multiple Linear Regression - Residual Statistics', 2, TRUE)
a<-table.row.end(a)
a<-table.row.start(a)
a<-table.element(a, 'Residual Standard Deviation',1,TRUE)
a<-table.element(a, signif(mysum$sigma,6))
a<-table.row.end(a)
a<-table.row.start(a)
a<-table.element(a, 'Sum Squared Residuals',1,TRUE)
a<-table.element(a, signif(sum(myerror*myerror),6))
a<-table.row.end(a)
a<-table.end(a)
table.save(a,file='mytable3.tab')
a<-table.start()
a<-table.row.start(a)
a<-table.element(a, 'Multiple Linear Regression - Actuals, Interpolation, and Residuals', 4, TRUE)
a<-table.row.end(a)
a<-table.row.start(a)
a<-table.element(a, 'Time or Index', 1, TRUE)
a<-table.element(a, 'Actuals', 1, TRUE)
a<-table.element(a, 'Interpolation
Forecast', 1, TRUE)
a<-table.element(a, 'Residuals
Prediction Error', 1, TRUE)
a<-table.row.end(a)
for (i in 1:n) {
a<-table.row.start(a)
a<-table.element(a,i, 1, TRUE)
a<-table.element(a,signif(x[i],6))
a<-table.element(a,signif(x[i]-mysum$resid[i],6))
a<-table.element(a,signif(mysum$resid[i],6))
a<-table.row.end(a)
}
a<-table.end(a)
table.save(a,file='mytable4.tab')
if (n > n25) {
a<-table.start()
a<-table.row.start(a)
a<-table.element(a,'Goldfeld-Quandt test for Heteroskedasticity',4,TRUE)
a<-table.row.end(a)
a<-table.row.start(a)
a<-table.element(a,'p-values',header=TRUE)
a<-table.element(a,'Alternative Hypothesis',3,header=TRUE)
a<-table.row.end(a)
a<-table.row.start(a)
a<-table.element(a,'breakpoint index',header=TRUE)
a<-table.element(a,'greater',header=TRUE)
a<-table.element(a,'2-sided',header=TRUE)
a<-table.element(a,'less',header=TRUE)
a<-table.row.end(a)
for (mypoint in kp3:nmkm3) {
a<-table.row.start(a)
a<-table.element(a,mypoint,header=TRUE)
a<-table.element(a,signif(gqarr[mypoint-kp3+1,1],6))
a<-table.element(a,signif(gqarr[mypoint-kp3+1,2],6))
a<-table.element(a,signif(gqarr[mypoint-kp3+1,3],6))
a<-table.row.end(a)
}
a<-table.end(a)
table.save(a,file='mytable5.tab')
a<-table.start()
a<-table.row.start(a)
a<-table.element(a,'Meta Analysis of Goldfeld-Quandt test for Heteroskedasticity',4,TRUE)
a<-table.row.end(a)
a<-table.row.start(a)
a<-table.element(a,'Description',header=TRUE)
a<-table.element(a,'# significant tests',header=TRUE)
a<-table.element(a,'% significant tests',header=TRUE)
a<-table.element(a,'OK/NOK',header=TRUE)
a<-table.row.end(a)
a<-table.row.start(a)
a<-table.element(a,'1% type I error level',header=TRUE)
a<-table.element(a,signif(numsignificant1,6))
a<-table.element(a,signif(numsignificant1/numgqtests,6))
if (numsignificant1/numgqtests < 0.01) dum <- 'OK' else dum <- 'NOK'
a<-table.element(a,dum)
a<-table.row.end(a)
a<-table.row.start(a)
a<-table.element(a,'5% type I error level',header=TRUE)
a<-table.element(a,signif(numsignificant5,6))
a<-table.element(a,signif(numsignificant5/numgqtests,6))
if (numsignificant5/numgqtests < 0.05) dum <- 'OK' else dum <- 'NOK'
a<-table.element(a,dum)
a<-table.row.end(a)
a<-table.row.start(a)
a<-table.element(a,'10% type I error level',header=TRUE)
a<-table.element(a,signif(numsignificant10,6))
a<-table.element(a,signif(numsignificant10/numgqtests,6))
if (numsignificant10/numgqtests < 0.1) dum <- 'OK' else dum <- 'NOK'
a<-table.element(a,dum)
a<-table.row.end(a)
a<-table.end(a)
table.save(a,file='mytable6.tab')
}