Free Statistics

of Irreproducible Research!

Author's title

Author*The author of this computation has been verified*
R Software Modulerwasp_twosampletests_mean.wasp
Title produced by softwarePaired and Unpaired Two Samples Tests about the Mean
Date of computationWed, 10 Dec 2014 15:25:37 +0000
Cite this page as followsStatistical Computations at FreeStatistics.org, Office for Research Development and Education, URL https://freestatistics.org/blog/index.php?v=date/2014/Dec/10/t1418225383os6jswbg4qf4gnq.htm/, Retrieved Sun, 19 May 2024 14:07:13 +0000
Statistical Computations at FreeStatistics.org, Office for Research Development and Education, URL https://freestatistics.org/blog/index.php?pk=265382, Retrieved Sun, 19 May 2024 14:07:13 +0000
QR Codes:

Original text written by user:
IsPrivate?No (this computation is public)
User-defined keywords
Estimated Impact80
Family? (F = Feedback message, R = changed R code, M = changed R Module, P = changed Parameters, D = changed Data)
-     [Testing Mean with known Variance - Sample Size] [] [2010-10-25 22:04:31] [b98453cac15ba1066b407e146608df68]
- RMP   [Testing Mean with known Variance - Sample Size] [] [2014-10-07 08:44:52] [32b17a345b130fdf5cc88718ed94a974]
-   P     [Testing Mean with known Variance - Sample Size] [] [2014-10-22 16:05:23] [99723d3e379f668157309b7b2091b15d]
- RMPD      [Paired and Unpaired Two Samples Tests about the Mean] [q1] [2014-10-28 13:49:10] [673773038936aef3a5778d7e6bda5c1e]
-   PD          [Paired and Unpaired Two Samples Tests about the Mean] [two sample t test] [2014-12-10 15:25:37] [ec1b40d1a9751af99658fe8fca4f9eca] [Current]
Feedback Forum

Post a new message
Dataseries X:
0 4.3
0 4.9
0 5.6
0 5.7
1 5.9
1 6.3
1 6.4
1 6.4
0 6.4
1 6.7
0 6.7
0 7.3
1 7.4
1 7.6
1 7.7
0 7.7
0 7.9
0 7.9
0 8
1 8.2
1 8.3
0 8.3
0 8.5
0 8.6
0 8.8
0 8.8
1 9
0 9
0 9.1
1 9.2
1 9.3
1 9.3
1 9.3
0 9.6
0 9.6
0 9.6
1 9.7
1 9.9
0 9.9
0 9.9
1 10
1 10.1
1 10.3
0 10.3
0 10.3
1 10.4
0 10.5
1 10.6
0 10.7
1 10.8
1 10.8
1 10.8
1 10.9
1 10.9
0 10.9
1 11.1
1 11.1
0 11.1
0 11.2
0 11.3
1 11.3
1 11.4
1 11.4
1 11.4
0 11.4
0 11.4
1 11.5
0 11.6
0 11.6
1 11.7
1 11.7
1 11.8
1 11.8
0 11.8
1 11.9
1 12
0 12.1
1 12.2
0 12.2
0 12.3
0 12.3
1 12.3
1 12.5
1 12.6
1 12.6
0 12.6
0 12.6
0 12.7
1 12.7
1 12.8
1 12.9
1 13
1 13
1 13
1 13.2
0 13.2
1 13.3
1 13.3
0 13.3
0 13.4
0 13.4
0 13.5
0 13.6
1 13.8
1 13.8
0 14.2
1 14.3
1 14.5
0 14.6
1 14.8
1 15.9
0 16.1


Summary of computational transaction
Raw Inputview raw input (R code)
Raw Outputview raw output of R engine
Computing time2 seconds
R Server'Gwilym Jenkins' @ jenkins.wessa.net

\begin{tabular}{lllllllll}
\hline
Summary of computational transaction \tabularnewline
Raw Input & view raw input (R code)  \tabularnewline
Raw Output & view raw output of R engine  \tabularnewline
Computing time & 2 seconds \tabularnewline
R Server & 'Gwilym Jenkins' @ jenkins.wessa.net \tabularnewline
\hline
\end{tabular}
%Source: https://freestatistics.org/blog/index.php?pk=265382&T=0

[TABLE]
[ROW][C]Summary of computational transaction[/C][/ROW]
[ROW][C]Raw Input[/C][C]view raw input (R code) [/C][/ROW]
[ROW][C]Raw Output[/C][C]view raw output of R engine [/C][/ROW]
[ROW][C]Computing time[/C][C]2 seconds[/C][/ROW]
[ROW][C]R Server[/C][C]'Gwilym Jenkins' @ jenkins.wessa.net[/C][/ROW]
[/TABLE]
Source: https://freestatistics.org/blog/index.php?pk=265382&T=0

Globally Unique Identifier (entire table): ba.freestatistics.org/blog/index.php?pk=265382&T=0

As an alternative you can also use a QR Code:  

The GUIDs for individual cells are displayed in the table below:

Summary of computational transaction
Raw Inputview raw input (R code)
Raw Outputview raw output of R engine
Computing time2 seconds
R Server'Gwilym Jenkins' @ jenkins.wessa.net


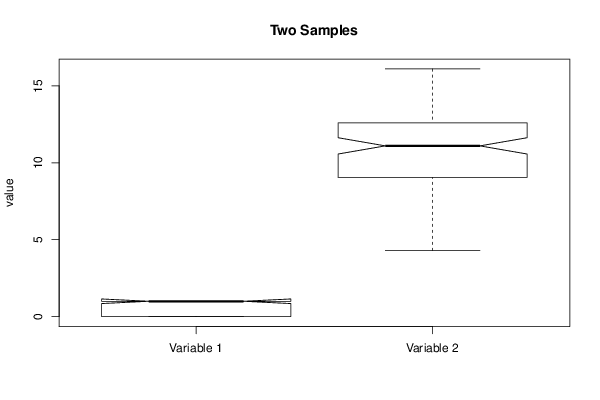
Two Sample t-test (unpaired)
Mean of Sample 10.535714285714286
Mean of Sample 210.6883928571429
t-stat-42.6101198158913
df222
p-value3.84156100697481e-109
H0 value0
Alternativeless
CI Level0.95
CI[-Inf,-9.75911831077543]
F-test to compare two variances
F-stat0.0410911761835543
df111
p-value2.81481492293576e-47
H0 value1
Alternativetwo.sided
CI Level0.95
CI[0.0282703239926797,0.0597264028733846]

\begin{tabular}{lllllllll}
\hline
Two Sample t-test (unpaired) \tabularnewline
Mean of Sample 1 & 0.535714285714286 \tabularnewline
Mean of Sample 2 & 10.6883928571429 \tabularnewline
t-stat & -42.6101198158913 \tabularnewline
df & 222 \tabularnewline
p-value & 3.84156100697481e-109 \tabularnewline
H0 value & 0 \tabularnewline
Alternative & less \tabularnewline
CI Level & 0.95 \tabularnewline
CI & [-Inf,-9.75911831077543] \tabularnewline
F-test to compare two variances \tabularnewline
F-stat & 0.0410911761835543 \tabularnewline
df & 111 \tabularnewline
p-value & 2.81481492293576e-47 \tabularnewline
H0 value & 1 \tabularnewline
Alternative & two.sided \tabularnewline
CI Level & 0.95 \tabularnewline
CI & [0.0282703239926797,0.0597264028733846] \tabularnewline
\hline
\end{tabular}
%Source: https://freestatistics.org/blog/index.php?pk=265382&T=1

[TABLE]
[ROW][C]Two Sample t-test (unpaired)[/C][/ROW]
[ROW][C]Mean of Sample 1[/C][C]0.535714285714286[/C][/ROW]
[ROW][C]Mean of Sample 2[/C][C]10.6883928571429[/C][/ROW]
[ROW][C]t-stat[/C][C]-42.6101198158913[/C][/ROW]
[ROW][C]df[/C][C]222[/C][/ROW]
[ROW][C]p-value[/C][C]3.84156100697481e-109[/C][/ROW]
[ROW][C]H0 value[/C][C]0[/C][/ROW]
[ROW][C]Alternative[/C][C]less[/C][/ROW]
[ROW][C]CI Level[/C][C]0.95[/C][/ROW]
[ROW][C]CI[/C][C][-Inf,-9.75911831077543][/C][/ROW]
[ROW][C]F-test to compare two variances[/C][/ROW]
[ROW][C]F-stat[/C][C]0.0410911761835543[/C][/ROW]
[ROW][C]df[/C][C]111[/C][/ROW]
[ROW][C]p-value[/C][C]2.81481492293576e-47[/C][/ROW]
[ROW][C]H0 value[/C][C]1[/C][/ROW]
[ROW][C]Alternative[/C][C]two.sided[/C][/ROW]
[ROW][C]CI Level[/C][C]0.95[/C][/ROW]
[ROW][C]CI[/C][C][0.0282703239926797,0.0597264028733846][/C][/ROW]
[/TABLE]
Source: https://freestatistics.org/blog/index.php?pk=265382&T=1

Globally Unique Identifier (entire table): ba.freestatistics.org/blog/index.php?pk=265382&T=1

As an alternative you can also use a QR Code:  

The GUIDs for individual cells are displayed in the table below:

Two Sample t-test (unpaired)
Mean of Sample 10.535714285714286
Mean of Sample 210.6883928571429
t-stat-42.6101198158913
df222
p-value3.84156100697481e-109
H0 value0
Alternativeless
CI Level0.95
CI[-Inf,-9.75911831077543]
F-test to compare two variances
F-stat0.0410911761835543
df111
p-value2.81481492293576e-47
H0 value1
Alternativetwo.sided
CI Level0.95
CI[0.0282703239926797,0.0597264028733846]


Welch Two Sample t-test (unpaired)
Mean of Sample 10.535714285714286
Mean of Sample 210.6883928571429
t-stat-42.6101198158913
df120.106864311147
p-value1.18245151694417e-74
H0 value0
Alternativeless
CI Level0.95
CI[-Inf,-9.75771417480823]

\begin{tabular}{lllllllll}
\hline
Welch Two Sample t-test (unpaired) \tabularnewline
Mean of Sample 1 & 0.535714285714286 \tabularnewline
Mean of Sample 2 & 10.6883928571429 \tabularnewline
t-stat & -42.6101198158913 \tabularnewline
df & 120.106864311147 \tabularnewline
p-value & 1.18245151694417e-74 \tabularnewline
H0 value & 0 \tabularnewline
Alternative & less \tabularnewline
CI Level & 0.95 \tabularnewline
CI & [-Inf,-9.75771417480823] \tabularnewline
\hline
\end{tabular}
%Source: https://freestatistics.org/blog/index.php?pk=265382&T=2

[TABLE]
[ROW][C]Welch Two Sample t-test (unpaired)[/C][/ROW]
[ROW][C]Mean of Sample 1[/C][C]0.535714285714286[/C][/ROW]
[ROW][C]Mean of Sample 2[/C][C]10.6883928571429[/C][/ROW]
[ROW][C]t-stat[/C][C]-42.6101198158913[/C][/ROW]
[ROW][C]df[/C][C]120.106864311147[/C][/ROW]
[ROW][C]p-value[/C][C]1.18245151694417e-74[/C][/ROW]
[ROW][C]H0 value[/C][C]0[/C][/ROW]
[ROW][C]Alternative[/C][C]less[/C][/ROW]
[ROW][C]CI Level[/C][C]0.95[/C][/ROW]
[ROW][C]CI[/C][C][-Inf,-9.75771417480823][/C][/ROW]
[/TABLE]
Source: https://freestatistics.org/blog/index.php?pk=265382&T=2

Globally Unique Identifier (entire table): ba.freestatistics.org/blog/index.php?pk=265382&T=2

As an alternative you can also use a QR Code:  

The GUIDs for individual cells are displayed in the table below:

Welch Two Sample t-test (unpaired)
Mean of Sample 10.535714285714286
Mean of Sample 210.6883928571429
t-stat-42.6101198158913
df120.106864311147
p-value1.18245151694417e-74
H0 value0
Alternativeless
CI Level0.95
CI[-Inf,-9.75771417480823]


Wicoxon rank sum test with continuity correction (unpaired)
W0
p-value9.45191344475184e-40
H0 value0
Alternativeless
Kolmogorov-Smirnov Test to compare Distributions of two Samples
KS Statistic0
p-value1
Kolmogorov-Smirnov Test to compare Distributional Shape of two Samples
KS Statistic0.375
p-value1.44498024610924e-07

\begin{tabular}{lllllllll}
\hline
Wicoxon rank sum test with continuity correction (unpaired) \tabularnewline
W & 0 \tabularnewline
p-value & 9.45191344475184e-40 \tabularnewline
H0 value & 0 \tabularnewline
Alternative & less \tabularnewline
Kolmogorov-Smirnov Test to compare Distributions of two Samples \tabularnewline
KS Statistic & 0 \tabularnewline
p-value & 1 \tabularnewline
Kolmogorov-Smirnov Test to compare Distributional Shape of two Samples \tabularnewline
KS Statistic & 0.375 \tabularnewline
p-value & 1.44498024610924e-07 \tabularnewline
\hline
\end{tabular}
%Source: https://freestatistics.org/blog/index.php?pk=265382&T=3

[TABLE]
[ROW][C]Wicoxon rank sum test with continuity correction (unpaired)[/C][/ROW]
[ROW][C]W[/C][C]0[/C][/ROW]
[ROW][C]p-value[/C][C]9.45191344475184e-40[/C][/ROW]
[ROW][C]H0 value[/C][C]0[/C][/ROW]
[ROW][C]Alternative[/C][C]less[/C][/ROW]
[ROW][C]Kolmogorov-Smirnov Test to compare Distributions of two Samples[/C][/ROW]
[ROW][C]KS Statistic[/C][C]0[/C][/ROW]
[ROW][C]p-value[/C][C]1[/C][/ROW]
[ROW][C]Kolmogorov-Smirnov Test to compare Distributional Shape of two Samples[/C][/ROW]
[ROW][C]KS Statistic[/C][C]0.375[/C][/ROW]
[ROW][C]p-value[/C][C]1.44498024610924e-07[/C][/ROW]
[/TABLE]
Source: https://freestatistics.org/blog/index.php?pk=265382&T=3

Globally Unique Identifier (entire table): ba.freestatistics.org/blog/index.php?pk=265382&T=3

As an alternative you can also use a QR Code:  

The GUIDs for individual cells are displayed in the table below:

Wicoxon rank sum test with continuity correction (unpaired)
W0
p-value9.45191344475184e-40
H0 value0
Alternativeless
Kolmogorov-Smirnov Test to compare Distributions of two Samples
KS Statistic0
p-value1
Kolmogorov-Smirnov Test to compare Distributional Shape of two Samples
KS Statistic0.375
p-value1.44498024610924e-07


Parameters (Session):
par1 = additive ; par2 = 12 ;
Parameters (R input):
par1 = 1 ; par2 = 2 ; par3 = 0.95 ; par4 = less ; par5 = unpaired ; par6 = 0 ;
R code (references can be found in the software module):
par1 <- as.numeric(par1) #column number of first sample
par2 <- as.numeric(par2) #column number of second sample
par3 <- as.numeric(par3) #confidence (= 1 - alpha)
if (par5 == 'unpaired') paired <- FALSE else paired <- TRUE
par6 <- as.numeric(par6) #H0
z <- t(y)
if (par1 == par2) stop('Please, select two different column numbers')
if (par1 < 1) stop('Please, select a column number greater than zero for the first sample')
if (par2 < 1) stop('Please, select a column number greater than zero for the second sample')
if (par1 > length(z[1,])) stop('The column number for the first sample should be smaller')
if (par2 > length(z[1,])) stop('The column number for the second sample should be smaller')
if (par3 <= 0) stop('The confidence level should be larger than zero')
if (par3 >= 1) stop('The confidence level should be smaller than zero')
(r.t <- t.test(z[,par1],z[,par2],var.equal=TRUE,alternative=par4,paired=paired,mu=par6,conf.level=par3))
(v.t <- var.test(z[,par1],z[,par2],conf.level=par3))
(r.w <- t.test(z[,par1],z[,par2],var.equal=FALSE,alternative=par4,paired=paired,mu=par6,conf.level=par3))
(w.t <- wilcox.test(z[,par1],z[,par2],alternative=par4,paired=paired,mu=par6,conf.level=par3))
(ks.t <- ks.test(z[,par1],z[,par2],alternative=par4))
m1 <- mean(z[,par1],na.rm=T)
m2 <- mean(z[,par2],na.rm=T)
mdiff <- m1 - m2
newsam1 <- z[!is.na(z[,par1]),par1]
newsam2 <- z[,par2]+mdiff
newsam2 <- newsam2[!is.na(newsam2)]
(ks1.t <- ks.test(newsam1,newsam2,alternative=par4))
mydf <- data.frame(cbind(z[,par1],z[,par2]))
colnames(mydf) <- c('Variable 1','Variable 2')
bitmap(file='test1.png')
boxplot(mydf, notch=TRUE, ylab='value',main=main)
dev.off()
bitmap(file='test2.png')
qqnorm(z[,par1],main='Normal QQplot - Variable 1')
qqline(z[,par1])
dev.off()
bitmap(file='test3.png')
qqnorm(z[,par2],main='Normal QQplot - Variable 2')
qqline(z[,par2])
dev.off()
load(file='createtable')
a<-table.start()
a<-table.row.start(a)
a<-table.element(a,paste('Two Sample t-test (',par5,')',sep=''),2,TRUE)
a<-table.row.end(a)
if(!paired){
a<-table.row.start(a)
a<-table.element(a,'Mean of Sample 1',header=TRUE)
a<-table.element(a,r.t$estimate[[1]])
a<-table.row.end(a)
a<-table.row.start(a)
a<-table.element(a,'Mean of Sample 2',header=TRUE)
a<-table.element(a,r.t$estimate[[2]])
a<-table.row.end(a)
} else {
a<-table.row.start(a)
a<-table.element(a,'Difference: Mean1 - Mean2',header=TRUE)
a<-table.element(a,r.t$estimate)
a<-table.row.end(a)
}
a<-table.row.start(a)
a<-table.element(a,'t-stat',header=TRUE)
a<-table.element(a,r.t$statistic[[1]])
a<-table.row.end(a)
a<-table.row.start(a)
a<-table.element(a,'df',header=TRUE)
a<-table.element(a,r.t$parameter[[1]])
a<-table.row.end(a)
a<-table.row.start(a)
a<-table.element(a,'p-value',header=TRUE)
a<-table.element(a,r.t$p.value)
a<-table.row.end(a)
a<-table.row.start(a)
a<-table.element(a,'H0 value',header=TRUE)
a<-table.element(a,r.t$null.value[[1]])
a<-table.row.end(a)
a<-table.row.start(a)
a<-table.element(a,'Alternative',header=TRUE)
a<-table.element(a,r.t$alternative)
a<-table.row.end(a)
a<-table.row.start(a)
a<-table.element(a,'CI Level',header=TRUE)
a<-table.element(a,attr(r.t$conf.int,'conf.level'))
a<-table.row.end(a)
a<-table.row.start(a)
a<-table.element(a,'CI',header=TRUE)
a<-table.element(a,paste('[',r.t$conf.int[1],',',r.t$conf.int[2],']',sep=''))
a<-table.row.end(a)
a<-table.row.start(a)
a<-table.element(a,'F-test to compare two variances',2,TRUE)
a<-table.row.end(a)
a<-table.row.start(a)
a<-table.element(a,'F-stat',header=TRUE)
a<-table.element(a,v.t$statistic[[1]])
a<-table.row.end(a)
a<-table.row.start(a)
a<-table.element(a,'df',header=TRUE)
a<-table.element(a,v.t$parameter[[1]])
a<-table.row.end(a)
a<-table.row.start(a)
a<-table.element(a,'p-value',header=TRUE)
a<-table.element(a,v.t$p.value)
a<-table.row.end(a)
a<-table.row.start(a)
a<-table.element(a,'H0 value',header=TRUE)
a<-table.element(a,v.t$null.value[[1]])
a<-table.row.end(a)
a<-table.row.start(a)
a<-table.element(a,'Alternative',header=TRUE)
a<-table.element(a,v.t$alternative)
a<-table.row.end(a)
a<-table.row.start(a)
a<-table.element(a,'CI Level',header=TRUE)
a<-table.element(a,attr(v.t$conf.int,'conf.level'))
a<-table.row.end(a)
a<-table.row.start(a)
a<-table.element(a,'CI',header=TRUE)
a<-table.element(a,paste('[',v.t$conf.int[1],',',v.t$conf.int[2],']',sep=''))
a<-table.row.end(a)
a<-table.end(a)
table.save(a,file='mytable.tab')
a<-table.start()
a<-table.row.start(a)
a<-table.element(a,paste('Welch Two Sample t-test (',par5,')',sep=''),2,TRUE)
a<-table.row.end(a)
if(!paired){
a<-table.row.start(a)
a<-table.element(a,'Mean of Sample 1',header=TRUE)
a<-table.element(a,r.w$estimate[[1]])
a<-table.row.end(a)
a<-table.row.start(a)
a<-table.element(a,'Mean of Sample 2',header=TRUE)
a<-table.element(a,r.w$estimate[[2]])
a<-table.row.end(a)
} else {
a<-table.row.start(a)
a<-table.element(a,'Difference: Mean1 - Mean2',header=TRUE)
a<-table.element(a,r.w$estimate)
a<-table.row.end(a)
}
a<-table.row.start(a)
a<-table.element(a,'t-stat',header=TRUE)
a<-table.element(a,r.w$statistic[[1]])
a<-table.row.end(a)
a<-table.row.start(a)
a<-table.element(a,'df',header=TRUE)
a<-table.element(a,r.w$parameter[[1]])
a<-table.row.end(a)
a<-table.row.start(a)
a<-table.element(a,'p-value',header=TRUE)
a<-table.element(a,r.w$p.value)
a<-table.row.end(a)
a<-table.row.start(a)
a<-table.element(a,'H0 value',header=TRUE)
a<-table.element(a,r.w$null.value[[1]])
a<-table.row.end(a)
a<-table.row.start(a)
a<-table.element(a,'Alternative',header=TRUE)
a<-table.element(a,r.w$alternative)
a<-table.row.end(a)
a<-table.row.start(a)
a<-table.element(a,'CI Level',header=TRUE)
a<-table.element(a,attr(r.w$conf.int,'conf.level'))
a<-table.row.end(a)
a<-table.row.start(a)
a<-table.element(a,'CI',header=TRUE)
a<-table.element(a,paste('[',r.w$conf.int[1],',',r.w$conf.int[2],']',sep=''))
a<-table.row.end(a)
a<-table.end(a)
table.save(a,file='mytable1.tab')
a<-table.start()
a<-table.row.start(a)
a<-table.element(a,paste('Wicoxon rank sum test with continuity correction (',par5,')',sep=''),2,TRUE)
a<-table.row.end(a)
a<-table.row.start(a)
a<-table.element(a,'W',header=TRUE)
a<-table.element(a,w.t$statistic[[1]])
a<-table.row.end(a)
a<-table.row.start(a)
a<-table.element(a,'p-value',header=TRUE)
a<-table.element(a,w.t$p.value)
a<-table.row.end(a)
a<-table.row.start(a)
a<-table.element(a,'H0 value',header=TRUE)
a<-table.element(a,w.t$null.value[[1]])
a<-table.row.end(a)
a<-table.row.start(a)
a<-table.element(a,'Alternative',header=TRUE)
a<-table.element(a,w.t$alternative)
a<-table.row.end(a)
a<-table.row.start(a)
a<-table.element(a,'Kolmogorov-Smirnov Test to compare Distributions of two Samples',2,TRUE)
a<-table.row.end(a)
a<-table.row.start(a)
a<-table.element(a,'KS Statistic',header=TRUE)
a<-table.element(a,ks.t$statistic[[1]])
a<-table.row.end(a)
a<-table.row.start(a)
a<-table.element(a,'p-value',header=TRUE)
a<-table.element(a,ks.t$p.value)
a<-table.row.end(a)
a<-table.row.start(a)
a<-table.element(a,'Kolmogorov-Smirnov Test to compare Distributional Shape of two Samples',2,TRUE)
a<-table.row.end(a)
a<-table.row.start(a)
a<-table.element(a,'KS Statistic',header=TRUE)
a<-table.element(a,ks1.t$statistic[[1]])
a<-table.row.end(a)
a<-table.row.start(a)
a<-table.element(a,'p-value',header=TRUE)
a<-table.element(a,ks1.t$p.value)
a<-table.row.end(a)
a<-table.end(a)
table.save(a,file='mytable2.tab')