Free Statistics

of Irreproducible Research!

Author's title

Author*The author of this computation has been verified*
R Software Modulerwasp_multipleregression.wasp
Title produced by softwareMultiple Regression
Date of computationWed, 10 Dec 2014 13:31:58 +0000
Cite this page as followsStatistical Computations at FreeStatistics.org, Office for Research Development and Education, URL https://freestatistics.org/blog/index.php?v=date/2014/Dec/10/t1418221550xysnsw1xri2ce58.htm/, Retrieved Sun, 19 May 2024 16:29:33 +0000
Statistical Computations at FreeStatistics.org, Office for Research Development and Education, URL https://freestatistics.org/blog/index.php?pk=265264, Retrieved Sun, 19 May 2024 16:29:33 +0000
QR Codes:

Original text written by user:
IsPrivate?No (this computation is public)
User-defined keywords
Estimated Impact68
Family? (F = Feedback message, R = changed R code, M = changed R Module, P = changed Parameters, D = changed Data)
-     [Multiple Regression] [] [2013-11-04 07:18:26] [0307e7a6407eb638caabc417e3a6b260]
-  MPD  [Multiple Regression] [Task 1.2 WS7] [2014-11-12 13:46:22] [805021881bfa5340347077d26b077617]
-   PD      [Multiple Regression] [Paper 6] [2014-12-10 13:31:58] [3e8c20c2e60277acd0ccfb10a62c3907] [Current]
Feedback Forum

Post a new message
Dataseries X:
26 13 21 93 13
37 11 22 115 14
67 14 18 97 16
43 15 23 99 14
52 14 12 104 13
52 11 20 124 15
43 13 22 88 13
84 16 21 104 20
67 14 19 106 17
49 14 22 77 15
70 15 15 101 16
58 13 19 98 17
68 14 18 120 11
62 11 15 131 16
43 12 20 96 16
56 14 21 106 15
74 12 15 111 14
63 15 23 107 16
58 14 21 109 17
63 12 25 117 15
53 12 9 124 14
57 12 30 132 14
64 14 23 103 15
53 16 16 90 17
29 12 16 70 14
54 12 19 104 16
58 14 25 92 15
51 15 23 104 16
54 14 10 107 8
56 13 14 101 17
47 16 26 108 10
50 15 24 128 16
35 13 24 69 16
30 16 18 105 16
68 16 23 107 8
56 15 23 92 14
43 13 19 64 16
67 12 21 109 19
62 14 18 86 19
57 14 27 115 14
54 10 13 93 13
61 16 28 91 15
56 14 23 104 11
41 14 21 133 9
53 15 19 110 12
46 16 17 86 13
51 15 25 116 17
37 13 14 84 7
42 12 16 100 15
38 12 24 111 12
66 14 20 97 15
53 15 24 78 16
49 11 22 94 14
49 14 22 105 16
59 16 20 88 13
40 13 10 111 16
63 11 22 132 10
34 12 20 117 12
32 12 22 82 14
67 14 20 92 16
61 12 17 109 18
60 13 18 106 12


Summary of computational transaction
Raw Inputview raw input (R code)
Raw Outputview raw output of R engine
Computing time6 seconds
R Server'Herman Ole Andreas Wold' @ wold.wessa.net

\begin{tabular}{lllllllll}
\hline
Summary of computational transaction \tabularnewline
Raw Input & view raw input (R code)  \tabularnewline
Raw Output & view raw output of R engine  \tabularnewline
Computing time & 6 seconds \tabularnewline
R Server & 'Herman Ole Andreas Wold' @ wold.wessa.net \tabularnewline
\hline
\end{tabular}
%Source: https://freestatistics.org/blog/index.php?pk=265264&T=0

[TABLE]
[ROW][C]Summary of computational transaction[/C][/ROW]
[ROW][C]Raw Input[/C][C]view raw input (R code) [/C][/ROW]
[ROW][C]Raw Output[/C][C]view raw output of R engine [/C][/ROW]
[ROW][C]Computing time[/C][C]6 seconds[/C][/ROW]
[ROW][C]R Server[/C][C]'Herman Ole Andreas Wold' @ wold.wessa.net[/C][/ROW]
[/TABLE]
Source: https://freestatistics.org/blog/index.php?pk=265264&T=0

Globally Unique Identifier (entire table): ba.freestatistics.org/blog/index.php?pk=265264&T=0

As an alternative you can also use a QR Code:  

The GUIDs for individual cells are displayed in the table below:

Summary of computational transaction
Raw Inputview raw input (R code)
Raw Outputview raw output of R engine
Computing time6 seconds
R Server'Herman Ole Andreas Wold' @ wold.wessa.net


Multiple Linear Regression - Estimated Regression Equation
AMS.I[t] = -20.427 + 2.10093STRESSTOT[t] -0.193905NUMERACYTOT[t] + 0.281792PERFECTIONISM.TOT[t] + 1.39385CONFSTATTOT[t] + e[t]

\begin{tabular}{lllllllll}
\hline
Multiple Linear Regression - Estimated Regression Equation \tabularnewline
AMS.I[t] =  -20.427 +  2.10093STRESSTOT[t] -0.193905NUMERACYTOT[t] +  0.281792PERFECTIONISM.TOT[t] +  1.39385CONFSTATTOT[t]  + e[t] \tabularnewline
\hline
\end{tabular}
%Source: https://freestatistics.org/blog/index.php?pk=265264&T=1

[TABLE]
[ROW][C]Multiple Linear Regression - Estimated Regression Equation[/C][/ROW]
[ROW][C]AMS.I[t] =  -20.427 +  2.10093STRESSTOT[t] -0.193905NUMERACYTOT[t] +  0.281792PERFECTIONISM.TOT[t] +  1.39385CONFSTATTOT[t]  + e[t][/C][/ROW]
[/TABLE]
Source: https://freestatistics.org/blog/index.php?pk=265264&T=1

Globally Unique Identifier (entire table): ba.freestatistics.org/blog/index.php?pk=265264&T=1

As an alternative you can also use a QR Code:  

The GUIDs for individual cells are displayed in the table below:

Multiple Linear Regression - Estimated Regression Equation
AMS.I[t] = -20.427 + 2.10093STRESSTOT[t] -0.193905NUMERACYTOT[t] + 0.281792PERFECTIONISM.TOT[t] + 1.39385CONFSTATTOT[t] + e[t]


Multiple Linear Regression - Ordinary Least Squares
VariableParameterS.D.T-STATH0: parameter = 02-tail p-value1-tail p-value
(Intercept)-20.42719.2484-1.0610.2930610.146531
STRESSTOT2.100930.9300312.2590.02772620.0138631
NUMERACYTOT-0.1939050.329323-0.58880.5583210.279161
PERFECTIONISM.TOT0.2817920.0933573.0180.00379530.00189765
CONFSTATTOT1.393850.5293372.6330.01086780.00543392

\begin{tabular}{lllllllll}
\hline
Multiple Linear Regression - Ordinary Least Squares \tabularnewline
Variable & Parameter & S.D. & T-STATH0: parameter = 0 & 2-tail p-value & 1-tail p-value \tabularnewline
(Intercept) & -20.427 & 19.2484 & -1.061 & 0.293061 & 0.146531 \tabularnewline
STRESSTOT & 2.10093 & 0.930031 & 2.259 & 0.0277262 & 0.0138631 \tabularnewline
NUMERACYTOT & -0.193905 & 0.329323 & -0.5888 & 0.558321 & 0.279161 \tabularnewline
PERFECTIONISM.TOT & 0.281792 & 0.093357 & 3.018 & 0.0037953 & 0.00189765 \tabularnewline
CONFSTATTOT & 1.39385 & 0.529337 & 2.633 & 0.0108678 & 0.00543392 \tabularnewline
\hline
\end{tabular}
%Source: https://freestatistics.org/blog/index.php?pk=265264&T=2

[TABLE]
[ROW][C]Multiple Linear Regression - Ordinary Least Squares[/C][/ROW]
[ROW][C]Variable[/C][C]Parameter[/C][C]S.D.[/C][C]T-STATH0: parameter = 0[/C][C]2-tail p-value[/C][C]1-tail p-value[/C][/ROW]
[ROW][C](Intercept)[/C][C]-20.427[/C][C]19.2484[/C][C]-1.061[/C][C]0.293061[/C][C]0.146531[/C][/ROW]
[ROW][C]STRESSTOT[/C][C]2.10093[/C][C]0.930031[/C][C]2.259[/C][C]0.0277262[/C][C]0.0138631[/C][/ROW]
[ROW][C]NUMERACYTOT[/C][C]-0.193905[/C][C]0.329323[/C][C]-0.5888[/C][C]0.558321[/C][C]0.279161[/C][/ROW]
[ROW][C]PERFECTIONISM.TOT[/C][C]0.281792[/C][C]0.093357[/C][C]3.018[/C][C]0.0037953[/C][C]0.00189765[/C][/ROW]
[ROW][C]CONFSTATTOT[/C][C]1.39385[/C][C]0.529337[/C][C]2.633[/C][C]0.0108678[/C][C]0.00543392[/C][/ROW]
[/TABLE]
Source: https://freestatistics.org/blog/index.php?pk=265264&T=2

Globally Unique Identifier (entire table): ba.freestatistics.org/blog/index.php?pk=265264&T=2

As an alternative you can also use a QR Code:  

The GUIDs for individual cells are displayed in the table below:

Multiple Linear Regression - Ordinary Least Squares
VariableParameterS.D.T-STATH0: parameter = 02-tail p-value1-tail p-value
(Intercept)-20.42719.2484-1.0610.2930610.146531
STRESSTOT2.100930.9300312.2590.02772620.0138631
NUMERACYTOT-0.1939050.329323-0.58880.5583210.279161
PERFECTIONISM.TOT0.2817920.0933573.0180.00379530.00189765
CONFSTATTOT1.393850.5293372.6330.01086780.00543392


Multiple Linear Regression - Regression Statistics
Multiple R0.478154
R-squared0.228632
Adjusted R-squared0.1745
F-TEST (value)4.22366
F-TEST (DF numerator)4
F-TEST (DF denominator)57
p-value0.00460203
Multiple Linear Regression - Residual Statistics
Residual Standard Deviation10.8622
Sum Squared Residuals6725.25

\begin{tabular}{lllllllll}
\hline
Multiple Linear Regression - Regression Statistics \tabularnewline
Multiple R & 0.478154 \tabularnewline
R-squared & 0.228632 \tabularnewline
Adjusted R-squared & 0.1745 \tabularnewline
F-TEST (value) & 4.22366 \tabularnewline
F-TEST (DF numerator) & 4 \tabularnewline
F-TEST (DF denominator) & 57 \tabularnewline
p-value & 0.00460203 \tabularnewline
Multiple Linear Regression - Residual Statistics \tabularnewline
Residual Standard Deviation & 10.8622 \tabularnewline
Sum Squared Residuals & 6725.25 \tabularnewline
\hline
\end{tabular}
%Source: https://freestatistics.org/blog/index.php?pk=265264&T=3

[TABLE]
[ROW][C]Multiple Linear Regression - Regression Statistics[/C][/ROW]
[ROW][C]Multiple R[/C][C]0.478154[/C][/ROW]
[ROW][C]R-squared[/C][C]0.228632[/C][/ROW]
[ROW][C]Adjusted R-squared[/C][C]0.1745[/C][/ROW]
[ROW][C]F-TEST (value)[/C][C]4.22366[/C][/ROW]
[ROW][C]F-TEST (DF numerator)[/C][C]4[/C][/ROW]
[ROW][C]F-TEST (DF denominator)[/C][C]57[/C][/ROW]
[ROW][C]p-value[/C][C]0.00460203[/C][/ROW]
[ROW][C]Multiple Linear Regression - Residual Statistics[/C][/ROW]
[ROW][C]Residual Standard Deviation[/C][C]10.8622[/C][/ROW]
[ROW][C]Sum Squared Residuals[/C][C]6725.25[/C][/ROW]
[/TABLE]
Source: https://freestatistics.org/blog/index.php?pk=265264&T=3

Globally Unique Identifier (entire table): ba.freestatistics.org/blog/index.php?pk=265264&T=3

As an alternative you can also use a QR Code:  

The GUIDs for individual cells are displayed in the table below:

Multiple Linear Regression - Regression Statistics
Multiple R0.478154
R-squared0.228632
Adjusted R-squared0.1745
F-TEST (value)4.22366
F-TEST (DF numerator)4
F-TEST (DF denominator)57
p-value0.00460203
Multiple Linear Regression - Residual Statistics
Residual Standard Deviation10.8622
Sum Squared Residuals6725.25


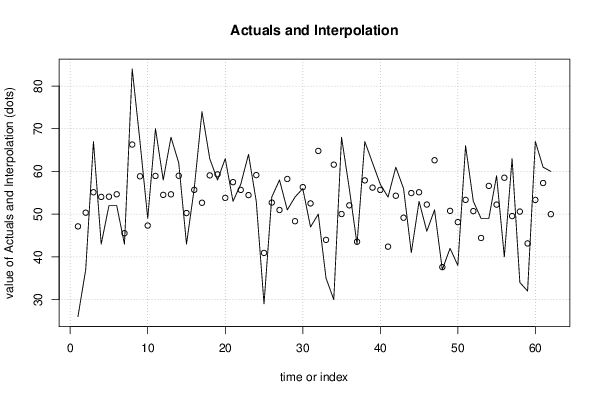
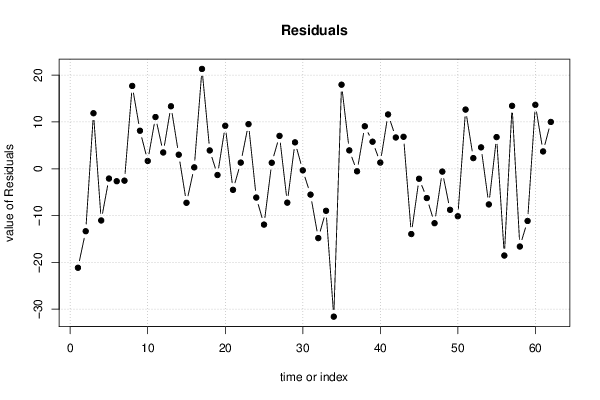
Multiple Linear Regression - Actuals, Interpolation, and Residuals
Time or IndexActualsInterpolationForecastResidualsPrediction Error
12647.1398-21.1398
23750.3373-13.3373
36755.131211.8688
44354.0385-11.0385
55254.0856-2.08563
65254.6551-2.65514
74345.537-2.53697
88466.299317.7007
96758.86738.13271
104947.32591.6741
117058.94111.059
125854.5123.48798
136854.643213.3568
146258.99113.00893
154350.2597-7.25975
165655.69180.308225
177452.668521.3315
186359.08053.91946
195859.3249-1.32486
206353.8149.186
215357.4952-4.49518
225755.67751.3225
236454.45869.54141
245359.1422-6.1422
252940.9211-11.9211
265452.7081.29201
275850.97117.02894
285158.2352-7.23517
295448.34955.65045
305656.3269-0.326928
314752.5184-5.51843
325064.8043-14.8043
333543.9767-8.97667
343061.5874-31.5874
356850.030617.9694
365652.0663.93405
374343.5372-0.537238
386757.91079.0893
396256.21315.78694
405755.67061.32938
415442.388311.6117
426154.30946.69058
435649.1656.83504
444154.937-13.937
455355.1261-2.12612
464652.2457-6.24571
475162.6227-11.6227
483737.5979-0.597923
494250.7687-8.76869
503848.1356-10.1356
516653.349612.6504
525350.71472.28534
534944.41974.58029
544956.6099-7.60993
555952.22766.77242
564058.5266-18.5266
576349.552413.4476
583450.602-16.602
593243.1391-11.1391
606753.334413.6656
616157.29253.70753
626049.99110.009

\begin{tabular}{lllllllll}
\hline
Multiple Linear Regression - Actuals, Interpolation, and Residuals \tabularnewline
Time or Index & Actuals & InterpolationForecast & ResidualsPrediction Error \tabularnewline
1 & 26 & 47.1398 & -21.1398 \tabularnewline
2 & 37 & 50.3373 & -13.3373 \tabularnewline
3 & 67 & 55.1312 & 11.8688 \tabularnewline
4 & 43 & 54.0385 & -11.0385 \tabularnewline
5 & 52 & 54.0856 & -2.08563 \tabularnewline
6 & 52 & 54.6551 & -2.65514 \tabularnewline
7 & 43 & 45.537 & -2.53697 \tabularnewline
8 & 84 & 66.2993 & 17.7007 \tabularnewline
9 & 67 & 58.8673 & 8.13271 \tabularnewline
10 & 49 & 47.3259 & 1.6741 \tabularnewline
11 & 70 & 58.941 & 11.059 \tabularnewline
12 & 58 & 54.512 & 3.48798 \tabularnewline
13 & 68 & 54.6432 & 13.3568 \tabularnewline
14 & 62 & 58.9911 & 3.00893 \tabularnewline
15 & 43 & 50.2597 & -7.25975 \tabularnewline
16 & 56 & 55.6918 & 0.308225 \tabularnewline
17 & 74 & 52.6685 & 21.3315 \tabularnewline
18 & 63 & 59.0805 & 3.91946 \tabularnewline
19 & 58 & 59.3249 & -1.32486 \tabularnewline
20 & 63 & 53.814 & 9.186 \tabularnewline
21 & 53 & 57.4952 & -4.49518 \tabularnewline
22 & 57 & 55.6775 & 1.3225 \tabularnewline
23 & 64 & 54.4586 & 9.54141 \tabularnewline
24 & 53 & 59.1422 & -6.1422 \tabularnewline
25 & 29 & 40.9211 & -11.9211 \tabularnewline
26 & 54 & 52.708 & 1.29201 \tabularnewline
27 & 58 & 50.9711 & 7.02894 \tabularnewline
28 & 51 & 58.2352 & -7.23517 \tabularnewline
29 & 54 & 48.3495 & 5.65045 \tabularnewline
30 & 56 & 56.3269 & -0.326928 \tabularnewline
31 & 47 & 52.5184 & -5.51843 \tabularnewline
32 & 50 & 64.8043 & -14.8043 \tabularnewline
33 & 35 & 43.9767 & -8.97667 \tabularnewline
34 & 30 & 61.5874 & -31.5874 \tabularnewline
35 & 68 & 50.0306 & 17.9694 \tabularnewline
36 & 56 & 52.066 & 3.93405 \tabularnewline
37 & 43 & 43.5372 & -0.537238 \tabularnewline
38 & 67 & 57.9107 & 9.0893 \tabularnewline
39 & 62 & 56.2131 & 5.78694 \tabularnewline
40 & 57 & 55.6706 & 1.32938 \tabularnewline
41 & 54 & 42.3883 & 11.6117 \tabularnewline
42 & 61 & 54.3094 & 6.69058 \tabularnewline
43 & 56 & 49.165 & 6.83504 \tabularnewline
44 & 41 & 54.937 & -13.937 \tabularnewline
45 & 53 & 55.1261 & -2.12612 \tabularnewline
46 & 46 & 52.2457 & -6.24571 \tabularnewline
47 & 51 & 62.6227 & -11.6227 \tabularnewline
48 & 37 & 37.5979 & -0.597923 \tabularnewline
49 & 42 & 50.7687 & -8.76869 \tabularnewline
50 & 38 & 48.1356 & -10.1356 \tabularnewline
51 & 66 & 53.3496 & 12.6504 \tabularnewline
52 & 53 & 50.7147 & 2.28534 \tabularnewline
53 & 49 & 44.4197 & 4.58029 \tabularnewline
54 & 49 & 56.6099 & -7.60993 \tabularnewline
55 & 59 & 52.2276 & 6.77242 \tabularnewline
56 & 40 & 58.5266 & -18.5266 \tabularnewline
57 & 63 & 49.5524 & 13.4476 \tabularnewline
58 & 34 & 50.602 & -16.602 \tabularnewline
59 & 32 & 43.1391 & -11.1391 \tabularnewline
60 & 67 & 53.3344 & 13.6656 \tabularnewline
61 & 61 & 57.2925 & 3.70753 \tabularnewline
62 & 60 & 49.991 & 10.009 \tabularnewline
\hline
\end{tabular}
%Source: https://freestatistics.org/blog/index.php?pk=265264&T=4

[TABLE]
[ROW][C]Multiple Linear Regression - Actuals, Interpolation, and Residuals[/C][/ROW]
[ROW][C]Time or Index[/C][C]Actuals[/C][C]InterpolationForecast[/C][C]ResidualsPrediction Error[/C][/ROW]
[ROW][C]1[/C][C]26[/C][C]47.1398[/C][C]-21.1398[/C][/ROW]
[ROW][C]2[/C][C]37[/C][C]50.3373[/C][C]-13.3373[/C][/ROW]
[ROW][C]3[/C][C]67[/C][C]55.1312[/C][C]11.8688[/C][/ROW]
[ROW][C]4[/C][C]43[/C][C]54.0385[/C][C]-11.0385[/C][/ROW]
[ROW][C]5[/C][C]52[/C][C]54.0856[/C][C]-2.08563[/C][/ROW]
[ROW][C]6[/C][C]52[/C][C]54.6551[/C][C]-2.65514[/C][/ROW]
[ROW][C]7[/C][C]43[/C][C]45.537[/C][C]-2.53697[/C][/ROW]
[ROW][C]8[/C][C]84[/C][C]66.2993[/C][C]17.7007[/C][/ROW]
[ROW][C]9[/C][C]67[/C][C]58.8673[/C][C]8.13271[/C][/ROW]
[ROW][C]10[/C][C]49[/C][C]47.3259[/C][C]1.6741[/C][/ROW]
[ROW][C]11[/C][C]70[/C][C]58.941[/C][C]11.059[/C][/ROW]
[ROW][C]12[/C][C]58[/C][C]54.512[/C][C]3.48798[/C][/ROW]
[ROW][C]13[/C][C]68[/C][C]54.6432[/C][C]13.3568[/C][/ROW]
[ROW][C]14[/C][C]62[/C][C]58.9911[/C][C]3.00893[/C][/ROW]
[ROW][C]15[/C][C]43[/C][C]50.2597[/C][C]-7.25975[/C][/ROW]
[ROW][C]16[/C][C]56[/C][C]55.6918[/C][C]0.308225[/C][/ROW]
[ROW][C]17[/C][C]74[/C][C]52.6685[/C][C]21.3315[/C][/ROW]
[ROW][C]18[/C][C]63[/C][C]59.0805[/C][C]3.91946[/C][/ROW]
[ROW][C]19[/C][C]58[/C][C]59.3249[/C][C]-1.32486[/C][/ROW]
[ROW][C]20[/C][C]63[/C][C]53.814[/C][C]9.186[/C][/ROW]
[ROW][C]21[/C][C]53[/C][C]57.4952[/C][C]-4.49518[/C][/ROW]
[ROW][C]22[/C][C]57[/C][C]55.6775[/C][C]1.3225[/C][/ROW]
[ROW][C]23[/C][C]64[/C][C]54.4586[/C][C]9.54141[/C][/ROW]
[ROW][C]24[/C][C]53[/C][C]59.1422[/C][C]-6.1422[/C][/ROW]
[ROW][C]25[/C][C]29[/C][C]40.9211[/C][C]-11.9211[/C][/ROW]
[ROW][C]26[/C][C]54[/C][C]52.708[/C][C]1.29201[/C][/ROW]
[ROW][C]27[/C][C]58[/C][C]50.9711[/C][C]7.02894[/C][/ROW]
[ROW][C]28[/C][C]51[/C][C]58.2352[/C][C]-7.23517[/C][/ROW]
[ROW][C]29[/C][C]54[/C][C]48.3495[/C][C]5.65045[/C][/ROW]
[ROW][C]30[/C][C]56[/C][C]56.3269[/C][C]-0.326928[/C][/ROW]
[ROW][C]31[/C][C]47[/C][C]52.5184[/C][C]-5.51843[/C][/ROW]
[ROW][C]32[/C][C]50[/C][C]64.8043[/C][C]-14.8043[/C][/ROW]
[ROW][C]33[/C][C]35[/C][C]43.9767[/C][C]-8.97667[/C][/ROW]
[ROW][C]34[/C][C]30[/C][C]61.5874[/C][C]-31.5874[/C][/ROW]
[ROW][C]35[/C][C]68[/C][C]50.0306[/C][C]17.9694[/C][/ROW]
[ROW][C]36[/C][C]56[/C][C]52.066[/C][C]3.93405[/C][/ROW]
[ROW][C]37[/C][C]43[/C][C]43.5372[/C][C]-0.537238[/C][/ROW]
[ROW][C]38[/C][C]67[/C][C]57.9107[/C][C]9.0893[/C][/ROW]
[ROW][C]39[/C][C]62[/C][C]56.2131[/C][C]5.78694[/C][/ROW]
[ROW][C]40[/C][C]57[/C][C]55.6706[/C][C]1.32938[/C][/ROW]
[ROW][C]41[/C][C]54[/C][C]42.3883[/C][C]11.6117[/C][/ROW]
[ROW][C]42[/C][C]61[/C][C]54.3094[/C][C]6.69058[/C][/ROW]
[ROW][C]43[/C][C]56[/C][C]49.165[/C][C]6.83504[/C][/ROW]
[ROW][C]44[/C][C]41[/C][C]54.937[/C][C]-13.937[/C][/ROW]
[ROW][C]45[/C][C]53[/C][C]55.1261[/C][C]-2.12612[/C][/ROW]
[ROW][C]46[/C][C]46[/C][C]52.2457[/C][C]-6.24571[/C][/ROW]
[ROW][C]47[/C][C]51[/C][C]62.6227[/C][C]-11.6227[/C][/ROW]
[ROW][C]48[/C][C]37[/C][C]37.5979[/C][C]-0.597923[/C][/ROW]
[ROW][C]49[/C][C]42[/C][C]50.7687[/C][C]-8.76869[/C][/ROW]
[ROW][C]50[/C][C]38[/C][C]48.1356[/C][C]-10.1356[/C][/ROW]
[ROW][C]51[/C][C]66[/C][C]53.3496[/C][C]12.6504[/C][/ROW]
[ROW][C]52[/C][C]53[/C][C]50.7147[/C][C]2.28534[/C][/ROW]
[ROW][C]53[/C][C]49[/C][C]44.4197[/C][C]4.58029[/C][/ROW]
[ROW][C]54[/C][C]49[/C][C]56.6099[/C][C]-7.60993[/C][/ROW]
[ROW][C]55[/C][C]59[/C][C]52.2276[/C][C]6.77242[/C][/ROW]
[ROW][C]56[/C][C]40[/C][C]58.5266[/C][C]-18.5266[/C][/ROW]
[ROW][C]57[/C][C]63[/C][C]49.5524[/C][C]13.4476[/C][/ROW]
[ROW][C]58[/C][C]34[/C][C]50.602[/C][C]-16.602[/C][/ROW]
[ROW][C]59[/C][C]32[/C][C]43.1391[/C][C]-11.1391[/C][/ROW]
[ROW][C]60[/C][C]67[/C][C]53.3344[/C][C]13.6656[/C][/ROW]
[ROW][C]61[/C][C]61[/C][C]57.2925[/C][C]3.70753[/C][/ROW]
[ROW][C]62[/C][C]60[/C][C]49.991[/C][C]10.009[/C][/ROW]
[/TABLE]
Source: https://freestatistics.org/blog/index.php?pk=265264&T=4

Globally Unique Identifier (entire table): ba.freestatistics.org/blog/index.php?pk=265264&T=4

As an alternative you can also use a QR Code:  

The GUIDs for individual cells are displayed in the table below:

Multiple Linear Regression - Actuals, Interpolation, and Residuals
Time or IndexActualsInterpolationForecastResidualsPrediction Error
12647.1398-21.1398
23750.3373-13.3373
36755.131211.8688
44354.0385-11.0385
55254.0856-2.08563
65254.6551-2.65514
74345.537-2.53697
88466.299317.7007
96758.86738.13271
104947.32591.6741
117058.94111.059
125854.5123.48798
136854.643213.3568
146258.99113.00893
154350.2597-7.25975
165655.69180.308225
177452.668521.3315
186359.08053.91946
195859.3249-1.32486
206353.8149.186
215357.4952-4.49518
225755.67751.3225
236454.45869.54141
245359.1422-6.1422
252940.9211-11.9211
265452.7081.29201
275850.97117.02894
285158.2352-7.23517
295448.34955.65045
305656.3269-0.326928
314752.5184-5.51843
325064.8043-14.8043
333543.9767-8.97667
343061.5874-31.5874
356850.030617.9694
365652.0663.93405
374343.5372-0.537238
386757.91079.0893
396256.21315.78694
405755.67061.32938
415442.388311.6117
426154.30946.69058
435649.1656.83504
444154.937-13.937
455355.1261-2.12612
464652.2457-6.24571
475162.6227-11.6227
483737.5979-0.597923
494250.7687-8.76869
503848.1356-10.1356
516653.349612.6504
525350.71472.28534
534944.41974.58029
544956.6099-7.60993
555952.22766.77242
564058.5266-18.5266
576349.552413.4476
583450.602-16.602
593243.1391-11.1391
606753.334413.6656
616157.29253.70753
626049.99110.009


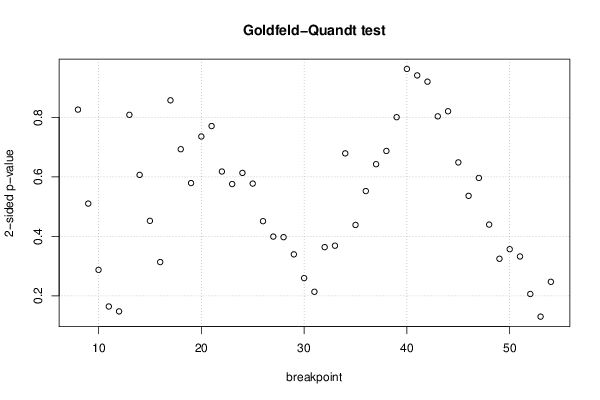
Goldfeld-Quandt test for Heteroskedasticity
p-valuesAlternative Hypothesis
breakpoint indexgreater2-sidedless
80.4128120.8256240.587188
90.2549630.5099260.745037
100.1435980.2871960.856402
110.08206990.164140.91793
120.07381480.147630.926185
130.4041050.808210.595895
140.3031660.6063320.696834
150.2259790.4519580.774021
160.1567190.3134380.843281
170.4284510.8569010.571549
180.3462830.6925660.653717
190.2894490.5788980.710551
200.367680.7353610.63232
210.3852080.7704160.614792
220.3088150.6176290.691185
230.2878170.5756340.712183
240.3065080.6130160.693492
250.2885520.5771030.711448
260.2253890.4507780.774611
270.1995090.3990190.800491
280.1985350.397070.801465
290.1696720.3393440.830328
300.1297690.2595380.870231
310.1067550.213510.893245
320.1817680.3635350.818232
330.1841890.3683770.815811
340.6606780.6786430.339322
350.7809680.4380650.219032
360.7240250.551950.275975
370.6788870.6422270.321113
380.6566260.6867490.343374
390.5999250.8001490.400075
400.5188550.9622910.481145
410.5297090.9405820.470291
420.4597650.919530.540235
430.4015610.8031210.598439
440.4100720.8201440.589928
450.3241240.6482480.675876
460.2679520.5359040.732048
470.2980120.5960230.701988
480.2196740.4393480.780326
490.1622610.3245230.837739
500.1783080.3566160.821692
510.1661040.3322080.833896
520.1030470.2060940.896953
530.06499440.1299890.935006
540.1235350.2470690.876465

\begin{tabular}{lllllllll}
\hline
Goldfeld-Quandt test for Heteroskedasticity \tabularnewline
p-values & Alternative Hypothesis \tabularnewline
breakpoint index & greater & 2-sided & less \tabularnewline
8 & 0.412812 & 0.825624 & 0.587188 \tabularnewline
9 & 0.254963 & 0.509926 & 0.745037 \tabularnewline
10 & 0.143598 & 0.287196 & 0.856402 \tabularnewline
11 & 0.0820699 & 0.16414 & 0.91793 \tabularnewline
12 & 0.0738148 & 0.14763 & 0.926185 \tabularnewline
13 & 0.404105 & 0.80821 & 0.595895 \tabularnewline
14 & 0.303166 & 0.606332 & 0.696834 \tabularnewline
15 & 0.225979 & 0.451958 & 0.774021 \tabularnewline
16 & 0.156719 & 0.313438 & 0.843281 \tabularnewline
17 & 0.428451 & 0.856901 & 0.571549 \tabularnewline
18 & 0.346283 & 0.692566 & 0.653717 \tabularnewline
19 & 0.289449 & 0.578898 & 0.710551 \tabularnewline
20 & 0.36768 & 0.735361 & 0.63232 \tabularnewline
21 & 0.385208 & 0.770416 & 0.614792 \tabularnewline
22 & 0.308815 & 0.617629 & 0.691185 \tabularnewline
23 & 0.287817 & 0.575634 & 0.712183 \tabularnewline
24 & 0.306508 & 0.613016 & 0.693492 \tabularnewline
25 & 0.288552 & 0.577103 & 0.711448 \tabularnewline
26 & 0.225389 & 0.450778 & 0.774611 \tabularnewline
27 & 0.199509 & 0.399019 & 0.800491 \tabularnewline
28 & 0.198535 & 0.39707 & 0.801465 \tabularnewline
29 & 0.169672 & 0.339344 & 0.830328 \tabularnewline
30 & 0.129769 & 0.259538 & 0.870231 \tabularnewline
31 & 0.106755 & 0.21351 & 0.893245 \tabularnewline
32 & 0.181768 & 0.363535 & 0.818232 \tabularnewline
33 & 0.184189 & 0.368377 & 0.815811 \tabularnewline
34 & 0.660678 & 0.678643 & 0.339322 \tabularnewline
35 & 0.780968 & 0.438065 & 0.219032 \tabularnewline
36 & 0.724025 & 0.55195 & 0.275975 \tabularnewline
37 & 0.678887 & 0.642227 & 0.321113 \tabularnewline
38 & 0.656626 & 0.686749 & 0.343374 \tabularnewline
39 & 0.599925 & 0.800149 & 0.400075 \tabularnewline
40 & 0.518855 & 0.962291 & 0.481145 \tabularnewline
41 & 0.529709 & 0.940582 & 0.470291 \tabularnewline
42 & 0.459765 & 0.91953 & 0.540235 \tabularnewline
43 & 0.401561 & 0.803121 & 0.598439 \tabularnewline
44 & 0.410072 & 0.820144 & 0.589928 \tabularnewline
45 & 0.324124 & 0.648248 & 0.675876 \tabularnewline
46 & 0.267952 & 0.535904 & 0.732048 \tabularnewline
47 & 0.298012 & 0.596023 & 0.701988 \tabularnewline
48 & 0.219674 & 0.439348 & 0.780326 \tabularnewline
49 & 0.162261 & 0.324523 & 0.837739 \tabularnewline
50 & 0.178308 & 0.356616 & 0.821692 \tabularnewline
51 & 0.166104 & 0.332208 & 0.833896 \tabularnewline
52 & 0.103047 & 0.206094 & 0.896953 \tabularnewline
53 & 0.0649944 & 0.129989 & 0.935006 \tabularnewline
54 & 0.123535 & 0.247069 & 0.876465 \tabularnewline
\hline
\end{tabular}
%Source: https://freestatistics.org/blog/index.php?pk=265264&T=5

[TABLE]
[ROW][C]Goldfeld-Quandt test for Heteroskedasticity[/C][/ROW]
[ROW][C]p-values[/C][C]Alternative Hypothesis[/C][/ROW]
[ROW][C]breakpoint index[/C][C]greater[/C][C]2-sided[/C][C]less[/C][/ROW]
[ROW][C]8[/C][C]0.412812[/C][C]0.825624[/C][C]0.587188[/C][/ROW]
[ROW][C]9[/C][C]0.254963[/C][C]0.509926[/C][C]0.745037[/C][/ROW]
[ROW][C]10[/C][C]0.143598[/C][C]0.287196[/C][C]0.856402[/C][/ROW]
[ROW][C]11[/C][C]0.0820699[/C][C]0.16414[/C][C]0.91793[/C][/ROW]
[ROW][C]12[/C][C]0.0738148[/C][C]0.14763[/C][C]0.926185[/C][/ROW]
[ROW][C]13[/C][C]0.404105[/C][C]0.80821[/C][C]0.595895[/C][/ROW]
[ROW][C]14[/C][C]0.303166[/C][C]0.606332[/C][C]0.696834[/C][/ROW]
[ROW][C]15[/C][C]0.225979[/C][C]0.451958[/C][C]0.774021[/C][/ROW]
[ROW][C]16[/C][C]0.156719[/C][C]0.313438[/C][C]0.843281[/C][/ROW]
[ROW][C]17[/C][C]0.428451[/C][C]0.856901[/C][C]0.571549[/C][/ROW]
[ROW][C]18[/C][C]0.346283[/C][C]0.692566[/C][C]0.653717[/C][/ROW]
[ROW][C]19[/C][C]0.289449[/C][C]0.578898[/C][C]0.710551[/C][/ROW]
[ROW][C]20[/C][C]0.36768[/C][C]0.735361[/C][C]0.63232[/C][/ROW]
[ROW][C]21[/C][C]0.385208[/C][C]0.770416[/C][C]0.614792[/C][/ROW]
[ROW][C]22[/C][C]0.308815[/C][C]0.617629[/C][C]0.691185[/C][/ROW]
[ROW][C]23[/C][C]0.287817[/C][C]0.575634[/C][C]0.712183[/C][/ROW]
[ROW][C]24[/C][C]0.306508[/C][C]0.613016[/C][C]0.693492[/C][/ROW]
[ROW][C]25[/C][C]0.288552[/C][C]0.577103[/C][C]0.711448[/C][/ROW]
[ROW][C]26[/C][C]0.225389[/C][C]0.450778[/C][C]0.774611[/C][/ROW]
[ROW][C]27[/C][C]0.199509[/C][C]0.399019[/C][C]0.800491[/C][/ROW]
[ROW][C]28[/C][C]0.198535[/C][C]0.39707[/C][C]0.801465[/C][/ROW]
[ROW][C]29[/C][C]0.169672[/C][C]0.339344[/C][C]0.830328[/C][/ROW]
[ROW][C]30[/C][C]0.129769[/C][C]0.259538[/C][C]0.870231[/C][/ROW]
[ROW][C]31[/C][C]0.106755[/C][C]0.21351[/C][C]0.893245[/C][/ROW]
[ROW][C]32[/C][C]0.181768[/C][C]0.363535[/C][C]0.818232[/C][/ROW]
[ROW][C]33[/C][C]0.184189[/C][C]0.368377[/C][C]0.815811[/C][/ROW]
[ROW][C]34[/C][C]0.660678[/C][C]0.678643[/C][C]0.339322[/C][/ROW]
[ROW][C]35[/C][C]0.780968[/C][C]0.438065[/C][C]0.219032[/C][/ROW]
[ROW][C]36[/C][C]0.724025[/C][C]0.55195[/C][C]0.275975[/C][/ROW]
[ROW][C]37[/C][C]0.678887[/C][C]0.642227[/C][C]0.321113[/C][/ROW]
[ROW][C]38[/C][C]0.656626[/C][C]0.686749[/C][C]0.343374[/C][/ROW]
[ROW][C]39[/C][C]0.599925[/C][C]0.800149[/C][C]0.400075[/C][/ROW]
[ROW][C]40[/C][C]0.518855[/C][C]0.962291[/C][C]0.481145[/C][/ROW]
[ROW][C]41[/C][C]0.529709[/C][C]0.940582[/C][C]0.470291[/C][/ROW]
[ROW][C]42[/C][C]0.459765[/C][C]0.91953[/C][C]0.540235[/C][/ROW]
[ROW][C]43[/C][C]0.401561[/C][C]0.803121[/C][C]0.598439[/C][/ROW]
[ROW][C]44[/C][C]0.410072[/C][C]0.820144[/C][C]0.589928[/C][/ROW]
[ROW][C]45[/C][C]0.324124[/C][C]0.648248[/C][C]0.675876[/C][/ROW]
[ROW][C]46[/C][C]0.267952[/C][C]0.535904[/C][C]0.732048[/C][/ROW]
[ROW][C]47[/C][C]0.298012[/C][C]0.596023[/C][C]0.701988[/C][/ROW]
[ROW][C]48[/C][C]0.219674[/C][C]0.439348[/C][C]0.780326[/C][/ROW]
[ROW][C]49[/C][C]0.162261[/C][C]0.324523[/C][C]0.837739[/C][/ROW]
[ROW][C]50[/C][C]0.178308[/C][C]0.356616[/C][C]0.821692[/C][/ROW]
[ROW][C]51[/C][C]0.166104[/C][C]0.332208[/C][C]0.833896[/C][/ROW]
[ROW][C]52[/C][C]0.103047[/C][C]0.206094[/C][C]0.896953[/C][/ROW]
[ROW][C]53[/C][C]0.0649944[/C][C]0.129989[/C][C]0.935006[/C][/ROW]
[ROW][C]54[/C][C]0.123535[/C][C]0.247069[/C][C]0.876465[/C][/ROW]
[/TABLE]
Source: https://freestatistics.org/blog/index.php?pk=265264&T=5

Globally Unique Identifier (entire table): ba.freestatistics.org/blog/index.php?pk=265264&T=5

As an alternative you can also use a QR Code:  

The GUIDs for individual cells are displayed in the table below:

Goldfeld-Quandt test for Heteroskedasticity
p-valuesAlternative Hypothesis
breakpoint indexgreater2-sidedless
80.4128120.8256240.587188
90.2549630.5099260.745037
100.1435980.2871960.856402
110.08206990.164140.91793
120.07381480.147630.926185
130.4041050.808210.595895
140.3031660.6063320.696834
150.2259790.4519580.774021
160.1567190.3134380.843281
170.4284510.8569010.571549
180.3462830.6925660.653717
190.2894490.5788980.710551
200.367680.7353610.63232
210.3852080.7704160.614792
220.3088150.6176290.691185
230.2878170.5756340.712183
240.3065080.6130160.693492
250.2885520.5771030.711448
260.2253890.4507780.774611
270.1995090.3990190.800491
280.1985350.397070.801465
290.1696720.3393440.830328
300.1297690.2595380.870231
310.1067550.213510.893245
320.1817680.3635350.818232
330.1841890.3683770.815811
340.6606780.6786430.339322
350.7809680.4380650.219032
360.7240250.551950.275975
370.6788870.6422270.321113
380.6566260.6867490.343374
390.5999250.8001490.400075
400.5188550.9622910.481145
410.5297090.9405820.470291
420.4597650.919530.540235
430.4015610.8031210.598439
440.4100720.8201440.589928
450.3241240.6482480.675876
460.2679520.5359040.732048
470.2980120.5960230.701988
480.2196740.4393480.780326
490.1622610.3245230.837739
500.1783080.3566160.821692
510.1661040.3322080.833896
520.1030470.2060940.896953
530.06499440.1299890.935006
540.1235350.2470690.876465


Meta Analysis of Goldfeld-Quandt test for Heteroskedasticity
Description# significant tests% significant testsOK/NOK
1% type I error level00OK
5% type I error level00OK
10% type I error level00OK

\begin{tabular}{lllllllll}
\hline
Meta Analysis of Goldfeld-Quandt test for Heteroskedasticity \tabularnewline
Description & # significant tests & % significant tests & OK/NOK \tabularnewline
1% type I error level & 0 & 0 & OK \tabularnewline
5% type I error level & 0 & 0 & OK \tabularnewline
10% type I error level & 0 & 0 & OK \tabularnewline
\hline
\end{tabular}
%Source: https://freestatistics.org/blog/index.php?pk=265264&T=6

[TABLE]
[ROW][C]Meta Analysis of Goldfeld-Quandt test for Heteroskedasticity[/C][/ROW]
[ROW][C]Description[/C][C]# significant tests[/C][C]% significant tests[/C][C]OK/NOK[/C][/ROW]
[ROW][C]1% type I error level[/C][C]0[/C][C]0[/C][C]OK[/C][/ROW]
[ROW][C]5% type I error level[/C][C]0[/C][C]0[/C][C]OK[/C][/ROW]
[ROW][C]10% type I error level[/C][C]0[/C][C]0[/C][C]OK[/C][/ROW]
[/TABLE]
Source: https://freestatistics.org/blog/index.php?pk=265264&T=6

Globally Unique Identifier (entire table): ba.freestatistics.org/blog/index.php?pk=265264&T=6

As an alternative you can also use a QR Code:  

The GUIDs for individual cells are displayed in the table below:

Meta Analysis of Goldfeld-Quandt test for Heteroskedasticity
Description# significant tests% significant testsOK/NOK
1% type I error level00OK
5% type I error level00OK
10% type I error level00OK


Parameters (Session):
par1 = 1 ; par2 = Do not include Seasonal Dummies ; par3 = No Linear Trend ;
Parameters (R input):
par1 = 1 ; par2 = Do not include Seasonal Dummies ; par3 = No Linear Trend ;
R code (references can be found in the software module):
library(lattice)
library(lmtest)
n25 <- 25 #minimum number of obs. for Goldfeld-Quandt test
par1 <- as.numeric(par1)
x <- t(y)
k <- length(x[1,])
n <- length(x[,1])
x1 <- cbind(x[,par1], x[,1:k!=par1])
mycolnames <- c(colnames(x)[par1], colnames(x)[1:k!=par1])
colnames(x1) <- mycolnames #colnames(x)[par1]
x <- x1
if (par3 == 'First Differences'){
x2 <- array(0, dim=c(n-1,k), dimnames=list(1:(n-1), paste('(1-B)',colnames(x),sep='')))
for (i in 1:n-1) {
for (j in 1:k) {
x2[i,j] <- x[i+1,j] - x[i,j]
}
}
x <- x2
}
if (par2 == 'Include Monthly Dummies'){
x2 <- array(0, dim=c(n,11), dimnames=list(1:n, paste('M', seq(1:11), sep ='')))
for (i in 1:11){
x2[seq(i,n,12),i] <- 1
}
x <- cbind(x, x2)
}
if (par2 == 'Include Quarterly Dummies'){
x2 <- array(0, dim=c(n,3), dimnames=list(1:n, paste('Q', seq(1:3), sep ='')))
for (i in 1:3){
x2[seq(i,n,4),i] <- 1
}
x <- cbind(x, x2)
}
k <- length(x[1,])
if (par3 == 'Linear Trend'){
x <- cbind(x, c(1:n))
colnames(x)[k+1] <- 't'
}
x
k <- length(x[1,])
df <- as.data.frame(x)
(mylm <- lm(df))
(mysum <- summary(mylm))
if (n > n25) {
kp3 <- k + 3
nmkm3 <- n - k - 3
gqarr <- array(NA, dim=c(nmkm3-kp3+1,3))
numgqtests <- 0
numsignificant1 <- 0
numsignificant5 <- 0
numsignificant10 <- 0
for (mypoint in kp3:nmkm3) {
j <- 0
numgqtests <- numgqtests + 1
for (myalt in c('greater', 'two.sided', 'less')) {
j <- j + 1
gqarr[mypoint-kp3+1,j] <- gqtest(mylm, point=mypoint, alternative=myalt)$p.value
}
if (gqarr[mypoint-kp3+1,2] < 0.01) numsignificant1 <- numsignificant1 + 1
if (gqarr[mypoint-kp3+1,2] < 0.05) numsignificant5 <- numsignificant5 + 1
if (gqarr[mypoint-kp3+1,2] < 0.10) numsignificant10 <- numsignificant10 + 1
}
gqarr
}
bitmap(file='test0.png')
plot(x[,1], type='l', main='Actuals and Interpolation', ylab='value of Actuals and Interpolation (dots)', xlab='time or index')
points(x[,1]-mysum$resid)
grid()
dev.off()
bitmap(file='test1.png')
plot(mysum$resid, type='b', pch=19, main='Residuals', ylab='value of Residuals', xlab='time or index')
grid()
dev.off()
bitmap(file='test2.png')
hist(mysum$resid, main='Residual Histogram', xlab='values of Residuals')
grid()
dev.off()
bitmap(file='test3.png')
densityplot(~mysum$resid,col='black',main='Residual Density Plot', xlab='values of Residuals')
dev.off()
bitmap(file='test4.png')
qqnorm(mysum$resid, main='Residual Normal Q-Q Plot')
qqline(mysum$resid)
grid()
dev.off()
(myerror <- as.ts(mysum$resid))
bitmap(file='test5.png')
dum <- cbind(lag(myerror,k=1),myerror)
dum
dum1 <- dum[2:length(myerror),]
dum1
z <- as.data.frame(dum1)
z
plot(z,main=paste('Residual Lag plot, lowess, and regression line'), ylab='values of Residuals', xlab='lagged values of Residuals')
lines(lowess(z))
abline(lm(z))
grid()
dev.off()
bitmap(file='test6.png')
acf(mysum$resid, lag.max=length(mysum$resid)/2, main='Residual Autocorrelation Function')
grid()
dev.off()
bitmap(file='test7.png')
pacf(mysum$resid, lag.max=length(mysum$resid)/2, main='Residual Partial Autocorrelation Function')
grid()
dev.off()
bitmap(file='test8.png')
opar <- par(mfrow = c(2,2), oma = c(0, 0, 1.1, 0))
plot(mylm, las = 1, sub='Residual Diagnostics')
par(opar)
dev.off()
if (n > n25) {
bitmap(file='test9.png')
plot(kp3:nmkm3,gqarr[,2], main='Goldfeld-Quandt test',ylab='2-sided p-value',xlab='breakpoint')
grid()
dev.off()
}
load(file='createtable')
a<-table.start()
a<-table.row.start(a)
a<-table.element(a, 'Multiple Linear Regression - Estimated Regression Equation', 1, TRUE)
a<-table.row.end(a)
myeq <- colnames(x)[1]
myeq <- paste(myeq, '[t] = ', sep='')
for (i in 1:k){
if (mysum$coefficients[i,1] > 0) myeq <- paste(myeq, '+', '')
myeq <- paste(myeq, signif(mysum$coefficients[i,1],6), sep=' ')
if (rownames(mysum$coefficients)[i] != '(Intercept)') {
myeq <- paste(myeq, rownames(mysum$coefficients)[i], sep='')
if (rownames(mysum$coefficients)[i] != 't') myeq <- paste(myeq, '[t]', sep='')
}
}
myeq <- paste(myeq, ' + e[t]')
a<-table.row.start(a)
a<-table.element(a, myeq)
a<-table.row.end(a)
a<-table.end(a)
table.save(a,file='mytable1.tab')
a<-table.start()
a<-table.row.start(a)
a<-table.element(a,hyperlink('ols1.htm','Multiple Linear Regression - Ordinary Least Squares',''), 6, TRUE)
a<-table.row.end(a)
a<-table.row.start(a)
a<-table.element(a,'Variable',header=TRUE)
a<-table.element(a,'Parameter',header=TRUE)
a<-table.element(a,'S.D.',header=TRUE)
a<-table.element(a,'T-STAT
H0: parameter = 0',header=TRUE)
a<-table.element(a,'2-tail p-value',header=TRUE)
a<-table.element(a,'1-tail p-value',header=TRUE)
a<-table.row.end(a)
for (i in 1:k){
a<-table.row.start(a)
a<-table.element(a,rownames(mysum$coefficients)[i],header=TRUE)
a<-table.element(a,signif(mysum$coefficients[i,1],6))
a<-table.element(a, signif(mysum$coefficients[i,2],6))
a<-table.element(a, signif(mysum$coefficients[i,3],4))
a<-table.element(a, signif(mysum$coefficients[i,4],6))
a<-table.element(a, signif(mysum$coefficients[i,4]/2,6))
a<-table.row.end(a)
}
a<-table.end(a)
table.save(a,file='mytable2.tab')
a<-table.start()
a<-table.row.start(a)
a<-table.element(a, 'Multiple Linear Regression - Regression Statistics', 2, TRUE)
a<-table.row.end(a)
a<-table.row.start(a)
a<-table.element(a, 'Multiple R',1,TRUE)
a<-table.element(a, signif(sqrt(mysum$r.squared),6))
a<-table.row.end(a)
a<-table.row.start(a)
a<-table.element(a, 'R-squared',1,TRUE)
a<-table.element(a, signif(mysum$r.squared,6))
a<-table.row.end(a)
a<-table.row.start(a)
a<-table.element(a, 'Adjusted R-squared',1,TRUE)
a<-table.element(a, signif(mysum$adj.r.squared,6))
a<-table.row.end(a)
a<-table.row.start(a)
a<-table.element(a, 'F-TEST (value)',1,TRUE)
a<-table.element(a, signif(mysum$fstatistic[1],6))
a<-table.row.end(a)
a<-table.row.start(a)
a<-table.element(a, 'F-TEST (DF numerator)',1,TRUE)
a<-table.element(a, signif(mysum$fstatistic[2],6))
a<-table.row.end(a)
a<-table.row.start(a)
a<-table.element(a, 'F-TEST (DF denominator)',1,TRUE)
a<-table.element(a, signif(mysum$fstatistic[3],6))
a<-table.row.end(a)
a<-table.row.start(a)
a<-table.element(a, 'p-value',1,TRUE)
a<-table.element(a, signif(1-pf(mysum$fstatistic[1],mysum$fstatistic[2],mysum$fstatistic[3]),6))
a<-table.row.end(a)
a<-table.row.start(a)
a<-table.element(a, 'Multiple Linear Regression - Residual Statistics', 2, TRUE)
a<-table.row.end(a)
a<-table.row.start(a)
a<-table.element(a, 'Residual Standard Deviation',1,TRUE)
a<-table.element(a, signif(mysum$sigma,6))
a<-table.row.end(a)
a<-table.row.start(a)
a<-table.element(a, 'Sum Squared Residuals',1,TRUE)
a<-table.element(a, signif(sum(myerror*myerror),6))
a<-table.row.end(a)
a<-table.end(a)
table.save(a,file='mytable3.tab')
a<-table.start()
a<-table.row.start(a)
a<-table.element(a, 'Multiple Linear Regression - Actuals, Interpolation, and Residuals', 4, TRUE)
a<-table.row.end(a)
a<-table.row.start(a)
a<-table.element(a, 'Time or Index', 1, TRUE)
a<-table.element(a, 'Actuals', 1, TRUE)
a<-table.element(a, 'Interpolation
Forecast', 1, TRUE)
a<-table.element(a, 'Residuals
Prediction Error', 1, TRUE)
a<-table.row.end(a)
for (i in 1:n) {
a<-table.row.start(a)
a<-table.element(a,i, 1, TRUE)
a<-table.element(a,signif(x[i],6))
a<-table.element(a,signif(x[i]-mysum$resid[i],6))
a<-table.element(a,signif(mysum$resid[i],6))
a<-table.row.end(a)
}
a<-table.end(a)
table.save(a,file='mytable4.tab')
if (n > n25) {
a<-table.start()
a<-table.row.start(a)
a<-table.element(a,'Goldfeld-Quandt test for Heteroskedasticity',4,TRUE)
a<-table.row.end(a)
a<-table.row.start(a)
a<-table.element(a,'p-values',header=TRUE)
a<-table.element(a,'Alternative Hypothesis',3,header=TRUE)
a<-table.row.end(a)
a<-table.row.start(a)
a<-table.element(a,'breakpoint index',header=TRUE)
a<-table.element(a,'greater',header=TRUE)
a<-table.element(a,'2-sided',header=TRUE)
a<-table.element(a,'less',header=TRUE)
a<-table.row.end(a)
for (mypoint in kp3:nmkm3) {
a<-table.row.start(a)
a<-table.element(a,mypoint,header=TRUE)
a<-table.element(a,signif(gqarr[mypoint-kp3+1,1],6))
a<-table.element(a,signif(gqarr[mypoint-kp3+1,2],6))
a<-table.element(a,signif(gqarr[mypoint-kp3+1,3],6))
a<-table.row.end(a)
}
a<-table.end(a)
table.save(a,file='mytable5.tab')
a<-table.start()
a<-table.row.start(a)
a<-table.element(a,'Meta Analysis of Goldfeld-Quandt test for Heteroskedasticity',4,TRUE)
a<-table.row.end(a)
a<-table.row.start(a)
a<-table.element(a,'Description',header=TRUE)
a<-table.element(a,'# significant tests',header=TRUE)
a<-table.element(a,'% significant tests',header=TRUE)
a<-table.element(a,'OK/NOK',header=TRUE)
a<-table.row.end(a)
a<-table.row.start(a)
a<-table.element(a,'1% type I error level',header=TRUE)
a<-table.element(a,signif(numsignificant1,6))
a<-table.element(a,signif(numsignificant1/numgqtests,6))
if (numsignificant1/numgqtests < 0.01) dum <- 'OK' else dum <- 'NOK'
a<-table.element(a,dum)
a<-table.row.end(a)
a<-table.row.start(a)
a<-table.element(a,'5% type I error level',header=TRUE)
a<-table.element(a,signif(numsignificant5,6))
a<-table.element(a,signif(numsignificant5/numgqtests,6))
if (numsignificant5/numgqtests < 0.05) dum <- 'OK' else dum <- 'NOK'
a<-table.element(a,dum)
a<-table.row.end(a)
a<-table.row.start(a)
a<-table.element(a,'10% type I error level',header=TRUE)
a<-table.element(a,signif(numsignificant10,6))
a<-table.element(a,signif(numsignificant10/numgqtests,6))
if (numsignificant10/numgqtests < 0.1) dum <- 'OK' else dum <- 'NOK'
a<-table.element(a,dum)
a<-table.row.end(a)
a<-table.end(a)
table.save(a,file='mytable6.tab')
}