Free Statistics

of Irreproducible Research!

Author's title

Author*The author of this computation has been verified*
R Software Modulerwasp_multipleregression.wasp
Title produced by softwareMultiple Regression
Date of computationWed, 10 Dec 2014 12:01:35 +0000
Cite this page as followsStatistical Computations at FreeStatistics.org, Office for Research Development and Education, URL https://freestatistics.org/blog/index.php?v=date/2014/Dec/10/t1418214260kl98mvxkqns2p55.htm/, Retrieved Sun, 19 May 2024 14:46:27 +0000
Statistical Computations at FreeStatistics.org, Office for Research Development and Education, URL https://freestatistics.org/blog/index.php?pk=265014, Retrieved Sun, 19 May 2024 14:46:27 +0000
QR Codes:

Original text written by user:
IsPrivate?No (this computation is public)
User-defined keywords
Estimated Impact68
Family? (F = Feedback message, R = changed R code, M = changed R Module, P = changed Parameters, D = changed Data)
-       [Multiple Regression] [Sterfte] [2014-12-10 12:01:35] [c7f962214140f976f2c4b1bb2571d9df] [Current]
Feedback Forum

Post a new message
Dataseries X:
325.87 285.90 387.35 3.40 5.70 4.00
302.25 325.87 316.17 4.80 3.40 5.90
294.00 302.25 283.48 6.50 4.80 7.10
285.43 294.00 280.57 8.50 6.50 10.80
286.19 285.43 266.03 13.60 8.50 15.10
276.70 286.19 273.23 15.70 13.60 16.80
267.77 276.70 265.68 18.80 15.70 15.30
267.03 267.77 266.23 19.20 18.80 18.30
257.87 267.03 257.77 12.90 19.20 16.10
257.19 257.87 269.87 14.40 12.90 11.30
275.60 257.19 287.53 6.20 14.40 7.90
305.68 275.60 285.90 2.40 6.20 5.70
358.06 305.68 325.87 4.60 2.40 3.40
320.07 358.06 302.25 7.10 4.60 4.80
295.90 320.07 294.00 7.80 7.10 6.50
291.27 295.90 285.43 9.90 7.80 8.50
272.87 291.27 286.19 13.90 9.90 13.60
269.27 272.87 276.70 17.10 13.90 15.70
271.32 269.27 267.77 17.80 17.10 18.80
267.45 271.32 267.03 18.30 17.80 19.20
260.33 267.45 257.87 14.70 18.30 12.90
277.94 260.33 257.19 10.50 14.70 14.40
277.07 277.94 275.60 8.60 10.50 6.20
312.65 277.07 305.68 4.40 8.60 2.40
319.71 312.65 358.06 2.30 4.40 4.60
318.39 319.71 320.07 2.80 2.30 7.10
304.90 318.39 295.90 8.80 2.80 7.80
303.73 304.90 291.27 10.70 8.80 9.90
273.29 303.73 272.87 12.80 10.70 13.90
274.33 273.29 269.27 19.30 12.80 17.10
270.45 274.33 271.32 19.50 19.30 17.80
278.23 270.45 267.45 20.30 19.50 18.30
274.03 278.23 260.33 15.30 20.30 14.70
279.00 274.03 277.94 7.90 15.30 10.50
287.50 279.00 277.07 8.30 7.90 8.60
336.87 287.50 312.65 4.50 8.30 4.40
334.10 336.87 319.71 3.20 4.50 2.30
296.07 334.10 318.39 5.00 3.20 2.80
286.84 296.07 304.90 6.60 5.00 8.80
277.63 286.84 303.73 11.10 6.60 10.70
261.32 277.63 273.29 13.40 11.10 12.80
264.07 261.32 274.33 16.30 13.40 19.30
261.94 264.07 270.45 17.40 16.30 19.50
252.84 261.94 278.23 18.90 17.40 20.30
257.83 252.84 274.03 15.80 18.90 15.30
271.16 257.83 279.00 11.70 15.80 7.90
273.63 271.16 287.50 6.40 11.70 8.30
304.87 273.63 336.87 2.90 6.40 4.50
323.90 304.87 334.10 4.70 2.90 3.20
336.11 323.90 296.07 2.40 4.70 5.00
335.65 336.11 286.84 7.00 2.40 6.60
282.23 335.65 277.63 10.60 7.00 11.10
273.03 282.23 261.32 12.80 10.60 13.40
270.07 273.03 264.07 17.70 12.80 16.30
246.03 270.07 261.94 18.20 17.70 17.40
242.35 246.03 252.84 16.50 18.20 18.90
250.33 242.35 257.83 16.20 16.50 15.80
267.45 250.33 271.16 13.90 16.20 11.70
268.80 267.45 273.63 6.60 13.90 6.40
302.68 268.80 304.87 3.60 6.60 2.90
313.10 302.68 323.90 1.40 3.60 4.70
306.39 313.10 336.11 2.60 1.40 2.40
305.61 306.39 335.65 4.30 2.60 7.00
277.27 305.61 282.23 8.80 4.30 10.60
264.94 277.27 273.03 14.50 8.80 12.80
268.63 264.94 270.07 16.80 14.50 17.70
293.90 268.63 246.03 22.70 16.80 18.20
248.65 293.90 242.35 15.70 22.70 16.50
256.00 248.65 250.33 18.20 15.70 16.20
258.52 256.00 267.45 14.20 18.20 13.90
266.90 258.52 268.80 9.10 14.20 6.60
281.23 266.90 302.68 5.90 9.10 3.60
306.00 281.23 313.10 7.00 5.90 1.40
325.46 306.00 306.39 6.20 7.00 2.60
291.13 325.46 305.61 7.80 6.20 4.30
282.53 291.13 277.27 14.30 7.80 8.80
256.52 282.53 264.94 14.60 14.30 14.50
258.63 256.52 268.63 17.30 14.60 16.80
252.74 258.63 293.90 17.10 17.30 22.70
245.16 252.74 248.65 17.00 17.10 15.70
255.03 245.16 256.00 13.90 17.00 18.20
268.35 255.03 258.52 10.30 13.90 14.20
293.73 268.35 266.90 6.70 10.30 9.10
278.39 293.73 281.23 3.90 6.70 5.90


Summary of computational transaction
Raw Inputview raw input (R code)
Raw Outputview raw output of R engine
Computing time5 seconds
R Server'Gwilym Jenkins' @ jenkins.wessa.net

\begin{tabular}{lllllllll}
\hline
Summary of computational transaction \tabularnewline
Raw Input & view raw input (R code)  \tabularnewline
Raw Output & view raw output of R engine  \tabularnewline
Computing time & 5 seconds \tabularnewline
R Server & 'Gwilym Jenkins' @ jenkins.wessa.net \tabularnewline
\hline
\end{tabular}
%Source: https://freestatistics.org/blog/index.php?pk=265014&T=0

[TABLE]
[ROW][C]Summary of computational transaction[/C][/ROW]
[ROW][C]Raw Input[/C][C]view raw input (R code) [/C][/ROW]
[ROW][C]Raw Output[/C][C]view raw output of R engine [/C][/ROW]
[ROW][C]Computing time[/C][C]5 seconds[/C][/ROW]
[ROW][C]R Server[/C][C]'Gwilym Jenkins' @ jenkins.wessa.net[/C][/ROW]
[/TABLE]
Source: https://freestatistics.org/blog/index.php?pk=265014&T=0

Globally Unique Identifier (entire table): ba.freestatistics.org/blog/index.php?pk=265014&T=0

As an alternative you can also use a QR Code:  

The GUIDs for individual cells are displayed in the table below:

Summary of computational transaction
Raw Inputview raw input (R code)
Raw Outputview raw output of R engine
Computing time5 seconds
R Server'Gwilym Jenkins' @ jenkins.wessa.net


Multiple Linear Regression - Estimated Regression Equation
St[t] = + 197.417 + 0.346408`St-1`[t] + 0.0489459`St-12`[t] + 0.743732Tt[t] -1.13676`T-1`[t] + 0.0519019`T-12`[t] + 8.25929M1[t] -9.86171M2[t] -19.7698M3[t] -30.7264M4[t] -38.7954M5[t] -33.4344M6[t] -32.7674M7[t] -37.9906M8[t] -32.221M9[t] -23.7495M10[t] -18.8179M11[t] + e[t]

\begin{tabular}{lllllllll}
\hline
Multiple Linear Regression - Estimated Regression Equation \tabularnewline
St[t] =  +  197.417 +  0.346408`St-1`[t] +  0.0489459`St-12`[t] +  0.743732Tt[t] -1.13676`T-1`[t] +  0.0519019`T-12`[t] +  8.25929M1[t] -9.86171M2[t] -19.7698M3[t] -30.7264M4[t] -38.7954M5[t] -33.4344M6[t] -32.7674M7[t] -37.9906M8[t] -32.221M9[t] -23.7495M10[t] -18.8179M11[t]  + e[t] \tabularnewline
\hline
\end{tabular}
%Source: https://freestatistics.org/blog/index.php?pk=265014&T=1

[TABLE]
[ROW][C]Multiple Linear Regression - Estimated Regression Equation[/C][/ROW]
[ROW][C]St[t] =  +  197.417 +  0.346408`St-1`[t] +  0.0489459`St-12`[t] +  0.743732Tt[t] -1.13676`T-1`[t] +  0.0519019`T-12`[t] +  8.25929M1[t] -9.86171M2[t] -19.7698M3[t] -30.7264M4[t] -38.7954M5[t] -33.4344M6[t] -32.7674M7[t] -37.9906M8[t] -32.221M9[t] -23.7495M10[t] -18.8179M11[t]  + e[t][/C][/ROW]
[/TABLE]
Source: https://freestatistics.org/blog/index.php?pk=265014&T=1

Globally Unique Identifier (entire table): ba.freestatistics.org/blog/index.php?pk=265014&T=1

As an alternative you can also use a QR Code:  

The GUIDs for individual cells are displayed in the table below:

Multiple Linear Regression - Estimated Regression Equation
St[t] = + 197.417 + 0.346408`St-1`[t] + 0.0489459`St-12`[t] + 0.743732Tt[t] -1.13676`T-1`[t] + 0.0519019`T-12`[t] + 8.25929M1[t] -9.86171M2[t] -19.7698M3[t] -30.7264M4[t] -38.7954M5[t] -33.4344M6[t] -32.7674M7[t] -37.9906M8[t] -32.221M9[t] -23.7495M10[t] -18.8179M11[t] + e[t]


Multiple Linear Regression - Ordinary Least Squares
VariableParameterS.D.T-STATH0: parameter = 02-tail p-value1-tail p-value
(Intercept)197.41755.07233.5850.0006353410.000317671
`St-1`0.3464080.1197592.8930.005149470.00257474
`St-12`0.04894590.1129480.43330.6661530.333077
Tt0.7437320.9386550.79230.430960.21548
`T-1`-1.136760.912077-1.2460.216980.10849
`T-12`0.05190190.9934990.052240.9584920.479246
M18.259299.118030.90580.3682770.184139
M2-9.861719.68447-1.0180.3121980.156099
M3-19.76989.65219-2.0480.04446030.0222302
M4-30.726411.9488-2.5720.01235090.00617546
M5-38.795416.309-2.3790.02022730.0101136
M6-33.434421.4448-1.5590.1236860.0618432
M7-32.767424.6851-1.3270.1888760.0944381
M8-37.990624.7287-1.5360.1291750.0645876
M9-32.22121.2129-1.5190.1334830.0667417
M10-23.749515.7739-1.5060.1368660.0684331
M11-18.81799.80508-1.9190.05921910.0296095

\begin{tabular}{lllllllll}
\hline
Multiple Linear Regression - Ordinary Least Squares \tabularnewline
Variable & Parameter & S.D. & T-STATH0: parameter = 0 & 2-tail p-value & 1-tail p-value \tabularnewline
(Intercept) & 197.417 & 55.0723 & 3.585 & 0.000635341 & 0.000317671 \tabularnewline
`St-1` & 0.346408 & 0.119759 & 2.893 & 0.00514947 & 0.00257474 \tabularnewline
`St-12` & 0.0489459 & 0.112948 & 0.4333 & 0.666153 & 0.333077 \tabularnewline
Tt & 0.743732 & 0.938655 & 0.7923 & 0.43096 & 0.21548 \tabularnewline
`T-1` & -1.13676 & 0.912077 & -1.246 & 0.21698 & 0.10849 \tabularnewline
`T-12` & 0.0519019 & 0.993499 & 0.05224 & 0.958492 & 0.479246 \tabularnewline
M1 & 8.25929 & 9.11803 & 0.9058 & 0.368277 & 0.184139 \tabularnewline
M2 & -9.86171 & 9.68447 & -1.018 & 0.312198 & 0.156099 \tabularnewline
M3 & -19.7698 & 9.65219 & -2.048 & 0.0444603 & 0.0222302 \tabularnewline
M4 & -30.7264 & 11.9488 & -2.572 & 0.0123509 & 0.00617546 \tabularnewline
M5 & -38.7954 & 16.309 & -2.379 & 0.0202273 & 0.0101136 \tabularnewline
M6 & -33.4344 & 21.4448 & -1.559 & 0.123686 & 0.0618432 \tabularnewline
M7 & -32.7674 & 24.6851 & -1.327 & 0.188876 & 0.0944381 \tabularnewline
M8 & -37.9906 & 24.7287 & -1.536 & 0.129175 & 0.0645876 \tabularnewline
M9 & -32.221 & 21.2129 & -1.519 & 0.133483 & 0.0667417 \tabularnewline
M10 & -23.7495 & 15.7739 & -1.506 & 0.136866 & 0.0684331 \tabularnewline
M11 & -18.8179 & 9.80508 & -1.919 & 0.0592191 & 0.0296095 \tabularnewline
\hline
\end{tabular}
%Source: https://freestatistics.org/blog/index.php?pk=265014&T=2

[TABLE]
[ROW][C]Multiple Linear Regression - Ordinary Least Squares[/C][/ROW]
[ROW][C]Variable[/C][C]Parameter[/C][C]S.D.[/C][C]T-STATH0: parameter = 0[/C][C]2-tail p-value[/C][C]1-tail p-value[/C][/ROW]
[ROW][C](Intercept)[/C][C]197.417[/C][C]55.0723[/C][C]3.585[/C][C]0.000635341[/C][C]0.000317671[/C][/ROW]
[ROW][C]`St-1`[/C][C]0.346408[/C][C]0.119759[/C][C]2.893[/C][C]0.00514947[/C][C]0.00257474[/C][/ROW]
[ROW][C]`St-12`[/C][C]0.0489459[/C][C]0.112948[/C][C]0.4333[/C][C]0.666153[/C][C]0.333077[/C][/ROW]
[ROW][C]Tt[/C][C]0.743732[/C][C]0.938655[/C][C]0.7923[/C][C]0.43096[/C][C]0.21548[/C][/ROW]
[ROW][C]`T-1`[/C][C]-1.13676[/C][C]0.912077[/C][C]-1.246[/C][C]0.21698[/C][C]0.10849[/C][/ROW]
[ROW][C]`T-12`[/C][C]0.0519019[/C][C]0.993499[/C][C]0.05224[/C][C]0.958492[/C][C]0.479246[/C][/ROW]
[ROW][C]M1[/C][C]8.25929[/C][C]9.11803[/C][C]0.9058[/C][C]0.368277[/C][C]0.184139[/C][/ROW]
[ROW][C]M2[/C][C]-9.86171[/C][C]9.68447[/C][C]-1.018[/C][C]0.312198[/C][C]0.156099[/C][/ROW]
[ROW][C]M3[/C][C]-19.7698[/C][C]9.65219[/C][C]-2.048[/C][C]0.0444603[/C][C]0.0222302[/C][/ROW]
[ROW][C]M4[/C][C]-30.7264[/C][C]11.9488[/C][C]-2.572[/C][C]0.0123509[/C][C]0.00617546[/C][/ROW]
[ROW][C]M5[/C][C]-38.7954[/C][C]16.309[/C][C]-2.379[/C][C]0.0202273[/C][C]0.0101136[/C][/ROW]
[ROW][C]M6[/C][C]-33.4344[/C][C]21.4448[/C][C]-1.559[/C][C]0.123686[/C][C]0.0618432[/C][/ROW]
[ROW][C]M7[/C][C]-32.7674[/C][C]24.6851[/C][C]-1.327[/C][C]0.188876[/C][C]0.0944381[/C][/ROW]
[ROW][C]M8[/C][C]-37.9906[/C][C]24.7287[/C][C]-1.536[/C][C]0.129175[/C][C]0.0645876[/C][/ROW]
[ROW][C]M9[/C][C]-32.221[/C][C]21.2129[/C][C]-1.519[/C][C]0.133483[/C][C]0.0667417[/C][/ROW]
[ROW][C]M10[/C][C]-23.7495[/C][C]15.7739[/C][C]-1.506[/C][C]0.136866[/C][C]0.0684331[/C][/ROW]
[ROW][C]M11[/C][C]-18.8179[/C][C]9.80508[/C][C]-1.919[/C][C]0.0592191[/C][C]0.0296095[/C][/ROW]
[/TABLE]
Source: https://freestatistics.org/blog/index.php?pk=265014&T=2

Globally Unique Identifier (entire table): ba.freestatistics.org/blog/index.php?pk=265014&T=2

As an alternative you can also use a QR Code:  

The GUIDs for individual cells are displayed in the table below:

Multiple Linear Regression - Ordinary Least Squares
VariableParameterS.D.T-STATH0: parameter = 02-tail p-value1-tail p-value
(Intercept)197.41755.07233.5850.0006353410.000317671
`St-1`0.3464080.1197592.8930.005149470.00257474
`St-12`0.04894590.1129480.43330.6661530.333077
Tt0.7437320.9386550.79230.430960.21548
`T-1`-1.136760.912077-1.2460.216980.10849
`T-12`0.05190190.9934990.052240.9584920.479246
M18.259299.118030.90580.3682770.184139
M2-9.861719.68447-1.0180.3121980.156099
M3-19.76989.65219-2.0480.04446030.0222302
M4-30.726411.9488-2.5720.01235090.00617546
M5-38.795416.309-2.3790.02022730.0101136
M6-33.434421.4448-1.5590.1236860.0618432
M7-32.767424.6851-1.3270.1888760.0944381
M8-37.990624.7287-1.5360.1291750.0645876
M9-32.22121.2129-1.5190.1334830.0667417
M10-23.749515.7739-1.5060.1368660.0684331
M11-18.81799.80508-1.9190.05921910.0296095


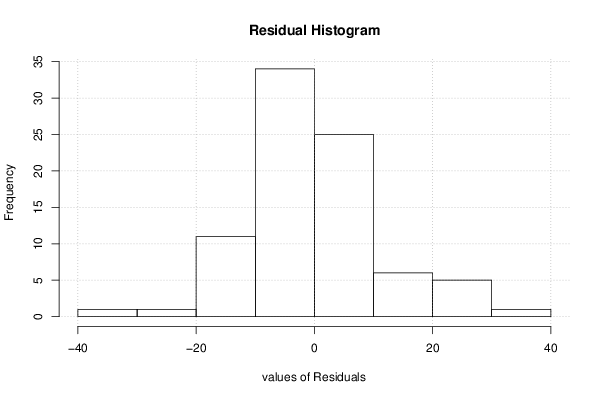
Multiple Linear Regression - Regression Statistics
Multiple R0.895011
R-squared0.801044
Adjusted R-squared0.753532
F-TEST (value)16.8599
F-TEST (DF numerator)16
F-TEST (DF denominator)67
p-value0
Multiple Linear Regression - Residual Statistics
Residual Standard Deviation12.4703
Sum Squared Residuals10419

\begin{tabular}{lllllllll}
\hline
Multiple Linear Regression - Regression Statistics \tabularnewline
Multiple R & 0.895011 \tabularnewline
R-squared & 0.801044 \tabularnewline
Adjusted R-squared & 0.753532 \tabularnewline
F-TEST (value) & 16.8599 \tabularnewline
F-TEST (DF numerator) & 16 \tabularnewline
F-TEST (DF denominator) & 67 \tabularnewline
p-value & 0 \tabularnewline
Multiple Linear Regression - Residual Statistics \tabularnewline
Residual Standard Deviation & 12.4703 \tabularnewline
Sum Squared Residuals & 10419 \tabularnewline
\hline
\end{tabular}
%Source: https://freestatistics.org/blog/index.php?pk=265014&T=3

[TABLE]
[ROW][C]Multiple Linear Regression - Regression Statistics[/C][/ROW]
[ROW][C]Multiple R[/C][C]0.895011[/C][/ROW]
[ROW][C]R-squared[/C][C]0.801044[/C][/ROW]
[ROW][C]Adjusted R-squared[/C][C]0.753532[/C][/ROW]
[ROW][C]F-TEST (value)[/C][C]16.8599[/C][/ROW]
[ROW][C]F-TEST (DF numerator)[/C][C]16[/C][/ROW]
[ROW][C]F-TEST (DF denominator)[/C][C]67[/C][/ROW]
[ROW][C]p-value[/C][C]0[/C][/ROW]
[ROW][C]Multiple Linear Regression - Residual Statistics[/C][/ROW]
[ROW][C]Residual Standard Deviation[/C][C]12.4703[/C][/ROW]
[ROW][C]Sum Squared Residuals[/C][C]10419[/C][/ROW]
[/TABLE]
Source: https://freestatistics.org/blog/index.php?pk=265014&T=3

Globally Unique Identifier (entire table): ba.freestatistics.org/blog/index.php?pk=265014&T=3

As an alternative you can also use a QR Code:  

The GUIDs for individual cells are displayed in the table below:

Multiple Linear Regression - Regression Statistics
Multiple R0.895011
R-squared0.801044
Adjusted R-squared0.753532
F-TEST (value)16.8599
F-TEST (DF numerator)16
F-TEST (DF denominator)67
p-value0
Multiple Linear Regression - Residual Statistics
Residual Standard Deviation12.4703
Sum Squared Residuals10419


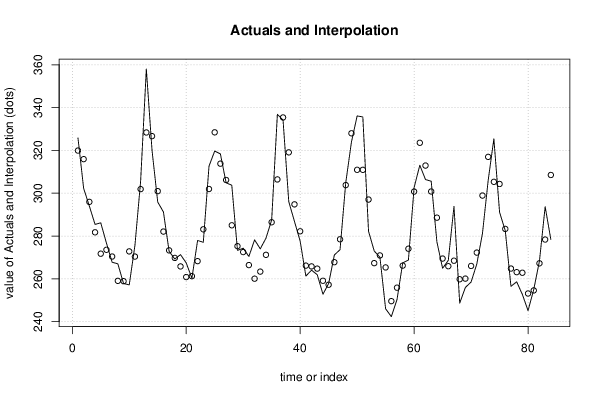
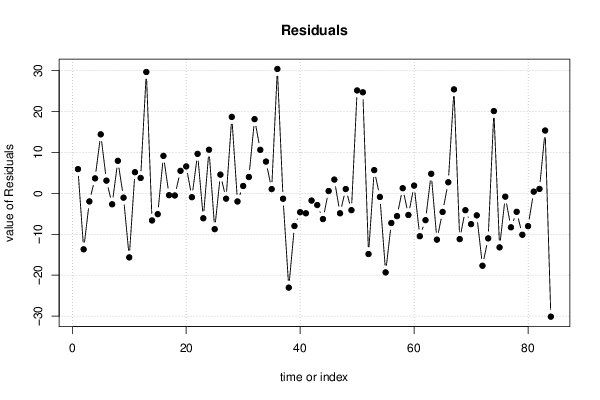
Multiple Linear Regression - Actuals, Interpolation, and Residuals
Time or IndexActualsInterpolationForecastResidualsPrediction Error
1325.87319.935.9402
2302.25315.925-13.6751
3294295.97-1.97004
4285.43281.763.66983
5286.19271.75314.4366
6276.7273.5833.11724
7267.77270.433-2.66335
8267.03259.0737.95708
9257.87258.918-1.0476
10257.19272.836-15.6463
11275.6270.4175.1835
12305.68301.9133.76692
13358.06328.38529.6748
14320.07326.684-6.61405
15295.9300.979-5.07911
16291.27282.19.16971
17272.87273.317-0.446993
18269.27269.782-0.511562
19271.32265.8085.5117
20267.45260.8566.59407
21260.33261.264-0.933701
22277.94268.2829.65795
23277.07283.151-6.08062
24312.65301.97810.6716
25319.71328.453-8.7434
26318.39313.8074.58261
27304.9306.189-1.2894
28303.73285.03518.6953
29273.29275.269-1.97934
30274.33272.5231.80731
31270.45266.4464.00354
32278.23260.08318.1466
33274.03263.38510.6455
34279271.2257.77472
35287.5286.4471.05323
36336.87306.45230.4182
37334.1335.403-1.30263
38296.07319.1-23.0299
39286.84294.813-7.97292
40277.63282.228-4.59832
41261.32266.183-4.86309
42264.07265.825-1.75479
43261.94264.786-2.8464
44252.84259.113-6.27286
45257.83257.2540.575735
46271.16267.7883.37178
47273.63278.493-4.8631
48304.87303.8081.06234
49323.9328.003-4.10304
50336.11310.94925.1606
51335.65310.93824.712
52282.23297.053-14.8232
53273.03267.3445.68603
54270.07270.947-0.876614
55246.03265.343-19.3129
56242.35249.592-7.24175
57250.33255.879-5.54918
58267.45266.1851.26484
59268.8274.078-5.27832
60302.68300.7781.90154
61313.1323.573-10.473
62306.39312.933-6.54313
63305.61300.8174.79286
64277.27288.577-11.3068
65264.94269.478-4.53831
66268.63265.9092.72133
67293.9268.47725.4233
68248.65259.826-11.1759
69256260.112-4.11209
70258.52266.031-7.51149
71266.9272.277-5.37717
72281.23298.918-17.6881
73306316.993-10.993
74325.46305.34120.1191
75291.13304.323-13.1934
76282.53283.337-0.80652
77256.52264.815-8.29489
78258.63263.133-4.50291
79252.74262.856-10.1159
80245.16253.167-8.00727
81255.03254.6090.421378
82268.35267.2611.08854
83293.73278.36815.3625
84278.39308.522-30.1325

\begin{tabular}{lllllllll}
\hline
Multiple Linear Regression - Actuals, Interpolation, and Residuals \tabularnewline
Time or Index & Actuals & InterpolationForecast & ResidualsPrediction Error \tabularnewline
1 & 325.87 & 319.93 & 5.9402 \tabularnewline
2 & 302.25 & 315.925 & -13.6751 \tabularnewline
3 & 294 & 295.97 & -1.97004 \tabularnewline
4 & 285.43 & 281.76 & 3.66983 \tabularnewline
5 & 286.19 & 271.753 & 14.4366 \tabularnewline
6 & 276.7 & 273.583 & 3.11724 \tabularnewline
7 & 267.77 & 270.433 & -2.66335 \tabularnewline
8 & 267.03 & 259.073 & 7.95708 \tabularnewline
9 & 257.87 & 258.918 & -1.0476 \tabularnewline
10 & 257.19 & 272.836 & -15.6463 \tabularnewline
11 & 275.6 & 270.417 & 5.1835 \tabularnewline
12 & 305.68 & 301.913 & 3.76692 \tabularnewline
13 & 358.06 & 328.385 & 29.6748 \tabularnewline
14 & 320.07 & 326.684 & -6.61405 \tabularnewline
15 & 295.9 & 300.979 & -5.07911 \tabularnewline
16 & 291.27 & 282.1 & 9.16971 \tabularnewline
17 & 272.87 & 273.317 & -0.446993 \tabularnewline
18 & 269.27 & 269.782 & -0.511562 \tabularnewline
19 & 271.32 & 265.808 & 5.5117 \tabularnewline
20 & 267.45 & 260.856 & 6.59407 \tabularnewline
21 & 260.33 & 261.264 & -0.933701 \tabularnewline
22 & 277.94 & 268.282 & 9.65795 \tabularnewline
23 & 277.07 & 283.151 & -6.08062 \tabularnewline
24 & 312.65 & 301.978 & 10.6716 \tabularnewline
25 & 319.71 & 328.453 & -8.7434 \tabularnewline
26 & 318.39 & 313.807 & 4.58261 \tabularnewline
27 & 304.9 & 306.189 & -1.2894 \tabularnewline
28 & 303.73 & 285.035 & 18.6953 \tabularnewline
29 & 273.29 & 275.269 & -1.97934 \tabularnewline
30 & 274.33 & 272.523 & 1.80731 \tabularnewline
31 & 270.45 & 266.446 & 4.00354 \tabularnewline
32 & 278.23 & 260.083 & 18.1466 \tabularnewline
33 & 274.03 & 263.385 & 10.6455 \tabularnewline
34 & 279 & 271.225 & 7.77472 \tabularnewline
35 & 287.5 & 286.447 & 1.05323 \tabularnewline
36 & 336.87 & 306.452 & 30.4182 \tabularnewline
37 & 334.1 & 335.403 & -1.30263 \tabularnewline
38 & 296.07 & 319.1 & -23.0299 \tabularnewline
39 & 286.84 & 294.813 & -7.97292 \tabularnewline
40 & 277.63 & 282.228 & -4.59832 \tabularnewline
41 & 261.32 & 266.183 & -4.86309 \tabularnewline
42 & 264.07 & 265.825 & -1.75479 \tabularnewline
43 & 261.94 & 264.786 & -2.8464 \tabularnewline
44 & 252.84 & 259.113 & -6.27286 \tabularnewline
45 & 257.83 & 257.254 & 0.575735 \tabularnewline
46 & 271.16 & 267.788 & 3.37178 \tabularnewline
47 & 273.63 & 278.493 & -4.8631 \tabularnewline
48 & 304.87 & 303.808 & 1.06234 \tabularnewline
49 & 323.9 & 328.003 & -4.10304 \tabularnewline
50 & 336.11 & 310.949 & 25.1606 \tabularnewline
51 & 335.65 & 310.938 & 24.712 \tabularnewline
52 & 282.23 & 297.053 & -14.8232 \tabularnewline
53 & 273.03 & 267.344 & 5.68603 \tabularnewline
54 & 270.07 & 270.947 & -0.876614 \tabularnewline
55 & 246.03 & 265.343 & -19.3129 \tabularnewline
56 & 242.35 & 249.592 & -7.24175 \tabularnewline
57 & 250.33 & 255.879 & -5.54918 \tabularnewline
58 & 267.45 & 266.185 & 1.26484 \tabularnewline
59 & 268.8 & 274.078 & -5.27832 \tabularnewline
60 & 302.68 & 300.778 & 1.90154 \tabularnewline
61 & 313.1 & 323.573 & -10.473 \tabularnewline
62 & 306.39 & 312.933 & -6.54313 \tabularnewline
63 & 305.61 & 300.817 & 4.79286 \tabularnewline
64 & 277.27 & 288.577 & -11.3068 \tabularnewline
65 & 264.94 & 269.478 & -4.53831 \tabularnewline
66 & 268.63 & 265.909 & 2.72133 \tabularnewline
67 & 293.9 & 268.477 & 25.4233 \tabularnewline
68 & 248.65 & 259.826 & -11.1759 \tabularnewline
69 & 256 & 260.112 & -4.11209 \tabularnewline
70 & 258.52 & 266.031 & -7.51149 \tabularnewline
71 & 266.9 & 272.277 & -5.37717 \tabularnewline
72 & 281.23 & 298.918 & -17.6881 \tabularnewline
73 & 306 & 316.993 & -10.993 \tabularnewline
74 & 325.46 & 305.341 & 20.1191 \tabularnewline
75 & 291.13 & 304.323 & -13.1934 \tabularnewline
76 & 282.53 & 283.337 & -0.80652 \tabularnewline
77 & 256.52 & 264.815 & -8.29489 \tabularnewline
78 & 258.63 & 263.133 & -4.50291 \tabularnewline
79 & 252.74 & 262.856 & -10.1159 \tabularnewline
80 & 245.16 & 253.167 & -8.00727 \tabularnewline
81 & 255.03 & 254.609 & 0.421378 \tabularnewline
82 & 268.35 & 267.261 & 1.08854 \tabularnewline
83 & 293.73 & 278.368 & 15.3625 \tabularnewline
84 & 278.39 & 308.522 & -30.1325 \tabularnewline
\hline
\end{tabular}
%Source: https://freestatistics.org/blog/index.php?pk=265014&T=4

[TABLE]
[ROW][C]Multiple Linear Regression - Actuals, Interpolation, and Residuals[/C][/ROW]
[ROW][C]Time or Index[/C][C]Actuals[/C][C]InterpolationForecast[/C][C]ResidualsPrediction Error[/C][/ROW]
[ROW][C]1[/C][C]325.87[/C][C]319.93[/C][C]5.9402[/C][/ROW]
[ROW][C]2[/C][C]302.25[/C][C]315.925[/C][C]-13.6751[/C][/ROW]
[ROW][C]3[/C][C]294[/C][C]295.97[/C][C]-1.97004[/C][/ROW]
[ROW][C]4[/C][C]285.43[/C][C]281.76[/C][C]3.66983[/C][/ROW]
[ROW][C]5[/C][C]286.19[/C][C]271.753[/C][C]14.4366[/C][/ROW]
[ROW][C]6[/C][C]276.7[/C][C]273.583[/C][C]3.11724[/C][/ROW]
[ROW][C]7[/C][C]267.77[/C][C]270.433[/C][C]-2.66335[/C][/ROW]
[ROW][C]8[/C][C]267.03[/C][C]259.073[/C][C]7.95708[/C][/ROW]
[ROW][C]9[/C][C]257.87[/C][C]258.918[/C][C]-1.0476[/C][/ROW]
[ROW][C]10[/C][C]257.19[/C][C]272.836[/C][C]-15.6463[/C][/ROW]
[ROW][C]11[/C][C]275.6[/C][C]270.417[/C][C]5.1835[/C][/ROW]
[ROW][C]12[/C][C]305.68[/C][C]301.913[/C][C]3.76692[/C][/ROW]
[ROW][C]13[/C][C]358.06[/C][C]328.385[/C][C]29.6748[/C][/ROW]
[ROW][C]14[/C][C]320.07[/C][C]326.684[/C][C]-6.61405[/C][/ROW]
[ROW][C]15[/C][C]295.9[/C][C]300.979[/C][C]-5.07911[/C][/ROW]
[ROW][C]16[/C][C]291.27[/C][C]282.1[/C][C]9.16971[/C][/ROW]
[ROW][C]17[/C][C]272.87[/C][C]273.317[/C][C]-0.446993[/C][/ROW]
[ROW][C]18[/C][C]269.27[/C][C]269.782[/C][C]-0.511562[/C][/ROW]
[ROW][C]19[/C][C]271.32[/C][C]265.808[/C][C]5.5117[/C][/ROW]
[ROW][C]20[/C][C]267.45[/C][C]260.856[/C][C]6.59407[/C][/ROW]
[ROW][C]21[/C][C]260.33[/C][C]261.264[/C][C]-0.933701[/C][/ROW]
[ROW][C]22[/C][C]277.94[/C][C]268.282[/C][C]9.65795[/C][/ROW]
[ROW][C]23[/C][C]277.07[/C][C]283.151[/C][C]-6.08062[/C][/ROW]
[ROW][C]24[/C][C]312.65[/C][C]301.978[/C][C]10.6716[/C][/ROW]
[ROW][C]25[/C][C]319.71[/C][C]328.453[/C][C]-8.7434[/C][/ROW]
[ROW][C]26[/C][C]318.39[/C][C]313.807[/C][C]4.58261[/C][/ROW]
[ROW][C]27[/C][C]304.9[/C][C]306.189[/C][C]-1.2894[/C][/ROW]
[ROW][C]28[/C][C]303.73[/C][C]285.035[/C][C]18.6953[/C][/ROW]
[ROW][C]29[/C][C]273.29[/C][C]275.269[/C][C]-1.97934[/C][/ROW]
[ROW][C]30[/C][C]274.33[/C][C]272.523[/C][C]1.80731[/C][/ROW]
[ROW][C]31[/C][C]270.45[/C][C]266.446[/C][C]4.00354[/C][/ROW]
[ROW][C]32[/C][C]278.23[/C][C]260.083[/C][C]18.1466[/C][/ROW]
[ROW][C]33[/C][C]274.03[/C][C]263.385[/C][C]10.6455[/C][/ROW]
[ROW][C]34[/C][C]279[/C][C]271.225[/C][C]7.77472[/C][/ROW]
[ROW][C]35[/C][C]287.5[/C][C]286.447[/C][C]1.05323[/C][/ROW]
[ROW][C]36[/C][C]336.87[/C][C]306.452[/C][C]30.4182[/C][/ROW]
[ROW][C]37[/C][C]334.1[/C][C]335.403[/C][C]-1.30263[/C][/ROW]
[ROW][C]38[/C][C]296.07[/C][C]319.1[/C][C]-23.0299[/C][/ROW]
[ROW][C]39[/C][C]286.84[/C][C]294.813[/C][C]-7.97292[/C][/ROW]
[ROW][C]40[/C][C]277.63[/C][C]282.228[/C][C]-4.59832[/C][/ROW]
[ROW][C]41[/C][C]261.32[/C][C]266.183[/C][C]-4.86309[/C][/ROW]
[ROW][C]42[/C][C]264.07[/C][C]265.825[/C][C]-1.75479[/C][/ROW]
[ROW][C]43[/C][C]261.94[/C][C]264.786[/C][C]-2.8464[/C][/ROW]
[ROW][C]44[/C][C]252.84[/C][C]259.113[/C][C]-6.27286[/C][/ROW]
[ROW][C]45[/C][C]257.83[/C][C]257.254[/C][C]0.575735[/C][/ROW]
[ROW][C]46[/C][C]271.16[/C][C]267.788[/C][C]3.37178[/C][/ROW]
[ROW][C]47[/C][C]273.63[/C][C]278.493[/C][C]-4.8631[/C][/ROW]
[ROW][C]48[/C][C]304.87[/C][C]303.808[/C][C]1.06234[/C][/ROW]
[ROW][C]49[/C][C]323.9[/C][C]328.003[/C][C]-4.10304[/C][/ROW]
[ROW][C]50[/C][C]336.11[/C][C]310.949[/C][C]25.1606[/C][/ROW]
[ROW][C]51[/C][C]335.65[/C][C]310.938[/C][C]24.712[/C][/ROW]
[ROW][C]52[/C][C]282.23[/C][C]297.053[/C][C]-14.8232[/C][/ROW]
[ROW][C]53[/C][C]273.03[/C][C]267.344[/C][C]5.68603[/C][/ROW]
[ROW][C]54[/C][C]270.07[/C][C]270.947[/C][C]-0.876614[/C][/ROW]
[ROW][C]55[/C][C]246.03[/C][C]265.343[/C][C]-19.3129[/C][/ROW]
[ROW][C]56[/C][C]242.35[/C][C]249.592[/C][C]-7.24175[/C][/ROW]
[ROW][C]57[/C][C]250.33[/C][C]255.879[/C][C]-5.54918[/C][/ROW]
[ROW][C]58[/C][C]267.45[/C][C]266.185[/C][C]1.26484[/C][/ROW]
[ROW][C]59[/C][C]268.8[/C][C]274.078[/C][C]-5.27832[/C][/ROW]
[ROW][C]60[/C][C]302.68[/C][C]300.778[/C][C]1.90154[/C][/ROW]
[ROW][C]61[/C][C]313.1[/C][C]323.573[/C][C]-10.473[/C][/ROW]
[ROW][C]62[/C][C]306.39[/C][C]312.933[/C][C]-6.54313[/C][/ROW]
[ROW][C]63[/C][C]305.61[/C][C]300.817[/C][C]4.79286[/C][/ROW]
[ROW][C]64[/C][C]277.27[/C][C]288.577[/C][C]-11.3068[/C][/ROW]
[ROW][C]65[/C][C]264.94[/C][C]269.478[/C][C]-4.53831[/C][/ROW]
[ROW][C]66[/C][C]268.63[/C][C]265.909[/C][C]2.72133[/C][/ROW]
[ROW][C]67[/C][C]293.9[/C][C]268.477[/C][C]25.4233[/C][/ROW]
[ROW][C]68[/C][C]248.65[/C][C]259.826[/C][C]-11.1759[/C][/ROW]
[ROW][C]69[/C][C]256[/C][C]260.112[/C][C]-4.11209[/C][/ROW]
[ROW][C]70[/C][C]258.52[/C][C]266.031[/C][C]-7.51149[/C][/ROW]
[ROW][C]71[/C][C]266.9[/C][C]272.277[/C][C]-5.37717[/C][/ROW]
[ROW][C]72[/C][C]281.23[/C][C]298.918[/C][C]-17.6881[/C][/ROW]
[ROW][C]73[/C][C]306[/C][C]316.993[/C][C]-10.993[/C][/ROW]
[ROW][C]74[/C][C]325.46[/C][C]305.341[/C][C]20.1191[/C][/ROW]
[ROW][C]75[/C][C]291.13[/C][C]304.323[/C][C]-13.1934[/C][/ROW]
[ROW][C]76[/C][C]282.53[/C][C]283.337[/C][C]-0.80652[/C][/ROW]
[ROW][C]77[/C][C]256.52[/C][C]264.815[/C][C]-8.29489[/C][/ROW]
[ROW][C]78[/C][C]258.63[/C][C]263.133[/C][C]-4.50291[/C][/ROW]
[ROW][C]79[/C][C]252.74[/C][C]262.856[/C][C]-10.1159[/C][/ROW]
[ROW][C]80[/C][C]245.16[/C][C]253.167[/C][C]-8.00727[/C][/ROW]
[ROW][C]81[/C][C]255.03[/C][C]254.609[/C][C]0.421378[/C][/ROW]
[ROW][C]82[/C][C]268.35[/C][C]267.261[/C][C]1.08854[/C][/ROW]
[ROW][C]83[/C][C]293.73[/C][C]278.368[/C][C]15.3625[/C][/ROW]
[ROW][C]84[/C][C]278.39[/C][C]308.522[/C][C]-30.1325[/C][/ROW]
[/TABLE]
Source: https://freestatistics.org/blog/index.php?pk=265014&T=4

Globally Unique Identifier (entire table): ba.freestatistics.org/blog/index.php?pk=265014&T=4

As an alternative you can also use a QR Code:  

The GUIDs for individual cells are displayed in the table below:

Multiple Linear Regression - Actuals, Interpolation, and Residuals
Time or IndexActualsInterpolationForecastResidualsPrediction Error
1325.87319.935.9402
2302.25315.925-13.6751
3294295.97-1.97004
4285.43281.763.66983
5286.19271.75314.4366
6276.7273.5833.11724
7267.77270.433-2.66335
8267.03259.0737.95708
9257.87258.918-1.0476
10257.19272.836-15.6463
11275.6270.4175.1835
12305.68301.9133.76692
13358.06328.38529.6748
14320.07326.684-6.61405
15295.9300.979-5.07911
16291.27282.19.16971
17272.87273.317-0.446993
18269.27269.782-0.511562
19271.32265.8085.5117
20267.45260.8566.59407
21260.33261.264-0.933701
22277.94268.2829.65795
23277.07283.151-6.08062
24312.65301.97810.6716
25319.71328.453-8.7434
26318.39313.8074.58261
27304.9306.189-1.2894
28303.73285.03518.6953
29273.29275.269-1.97934
30274.33272.5231.80731
31270.45266.4464.00354
32278.23260.08318.1466
33274.03263.38510.6455
34279271.2257.77472
35287.5286.4471.05323
36336.87306.45230.4182
37334.1335.403-1.30263
38296.07319.1-23.0299
39286.84294.813-7.97292
40277.63282.228-4.59832
41261.32266.183-4.86309
42264.07265.825-1.75479
43261.94264.786-2.8464
44252.84259.113-6.27286
45257.83257.2540.575735
46271.16267.7883.37178
47273.63278.493-4.8631
48304.87303.8081.06234
49323.9328.003-4.10304
50336.11310.94925.1606
51335.65310.93824.712
52282.23297.053-14.8232
53273.03267.3445.68603
54270.07270.947-0.876614
55246.03265.343-19.3129
56242.35249.592-7.24175
57250.33255.879-5.54918
58267.45266.1851.26484
59268.8274.078-5.27832
60302.68300.7781.90154
61313.1323.573-10.473
62306.39312.933-6.54313
63305.61300.8174.79286
64277.27288.577-11.3068
65264.94269.478-4.53831
66268.63265.9092.72133
67293.9268.47725.4233
68248.65259.826-11.1759
69256260.112-4.11209
70258.52266.031-7.51149
71266.9272.277-5.37717
72281.23298.918-17.6881
73306316.993-10.993
74325.46305.34120.1191
75291.13304.323-13.1934
76282.53283.337-0.80652
77256.52264.815-8.29489
78258.63263.133-4.50291
79252.74262.856-10.1159
80245.16253.167-8.00727
81255.03254.6090.421378
82268.35267.2611.08854
83293.73278.36815.3625
84278.39308.522-30.1325


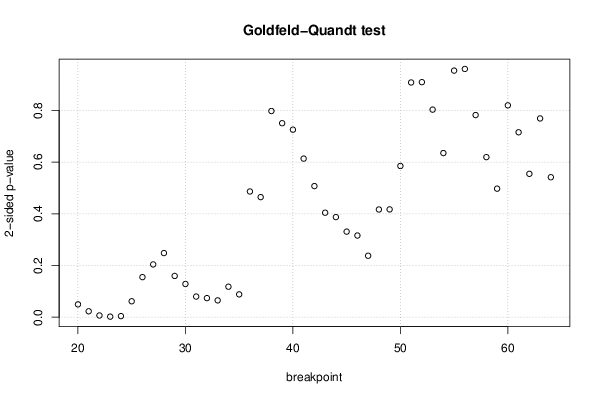
Goldfeld-Quandt test for Heteroskedasticity
p-valuesAlternative Hypothesis
breakpoint indexgreater2-sidedless
200.02489920.04979850.975101
210.01150150.02300310.988498
220.003347560.006695120.996652
230.001118790.002237590.998881
240.002189230.004378460.997811
250.03088720.06177430.969113
260.07747330.1549470.922527
270.1020810.2041630.897919
280.1240810.2481620.875919
290.07984940.1596990.920151
300.06431680.1286340.935683
310.03996560.07993120.960034
320.0369960.07399190.963004
330.03261840.06523680.967382
340.05901280.1180260.940987
350.04420450.0884090.955795
360.2431520.4863030.756848
370.232240.464480.76776
380.3986720.7973430.601328
390.3750950.750190.624905
400.3625950.725190.637405
410.3067210.6134430.693279
420.253550.5071010.74645
430.2020670.4041340.797933
440.1936120.3872240.806388
450.1655030.3310050.834497
460.1580060.3160110.841994
470.1188690.2377390.881131
480.208320.4166410.79168
490.2085210.4170420.791479
500.2924620.5849240.707538
510.4539150.9078310.546085
520.4545320.9090640.545468
530.4013960.8027920.598604
540.3173840.6347680.682616
550.5231570.9536870.476843
560.4800590.9601170.519941
570.3909070.7818150.609093
580.309520.6190390.69048
590.2485590.4971190.751441
600.4096770.8193550.590323
610.3576030.7152060.642397
620.277260.554520.72274
630.3843470.7686930.615653
640.2706830.5413670.729317

\begin{tabular}{lllllllll}
\hline
Goldfeld-Quandt test for Heteroskedasticity \tabularnewline
p-values & Alternative Hypothesis \tabularnewline
breakpoint index & greater & 2-sided & less \tabularnewline
20 & 0.0248992 & 0.0497985 & 0.975101 \tabularnewline
21 & 0.0115015 & 0.0230031 & 0.988498 \tabularnewline
22 & 0.00334756 & 0.00669512 & 0.996652 \tabularnewline
23 & 0.00111879 & 0.00223759 & 0.998881 \tabularnewline
24 & 0.00218923 & 0.00437846 & 0.997811 \tabularnewline
25 & 0.0308872 & 0.0617743 & 0.969113 \tabularnewline
26 & 0.0774733 & 0.154947 & 0.922527 \tabularnewline
27 & 0.102081 & 0.204163 & 0.897919 \tabularnewline
28 & 0.124081 & 0.248162 & 0.875919 \tabularnewline
29 & 0.0798494 & 0.159699 & 0.920151 \tabularnewline
30 & 0.0643168 & 0.128634 & 0.935683 \tabularnewline
31 & 0.0399656 & 0.0799312 & 0.960034 \tabularnewline
32 & 0.036996 & 0.0739919 & 0.963004 \tabularnewline
33 & 0.0326184 & 0.0652368 & 0.967382 \tabularnewline
34 & 0.0590128 & 0.118026 & 0.940987 \tabularnewline
35 & 0.0442045 & 0.088409 & 0.955795 \tabularnewline
36 & 0.243152 & 0.486303 & 0.756848 \tabularnewline
37 & 0.23224 & 0.46448 & 0.76776 \tabularnewline
38 & 0.398672 & 0.797343 & 0.601328 \tabularnewline
39 & 0.375095 & 0.75019 & 0.624905 \tabularnewline
40 & 0.362595 & 0.72519 & 0.637405 \tabularnewline
41 & 0.306721 & 0.613443 & 0.693279 \tabularnewline
42 & 0.25355 & 0.507101 & 0.74645 \tabularnewline
43 & 0.202067 & 0.404134 & 0.797933 \tabularnewline
44 & 0.193612 & 0.387224 & 0.806388 \tabularnewline
45 & 0.165503 & 0.331005 & 0.834497 \tabularnewline
46 & 0.158006 & 0.316011 & 0.841994 \tabularnewline
47 & 0.118869 & 0.237739 & 0.881131 \tabularnewline
48 & 0.20832 & 0.416641 & 0.79168 \tabularnewline
49 & 0.208521 & 0.417042 & 0.791479 \tabularnewline
50 & 0.292462 & 0.584924 & 0.707538 \tabularnewline
51 & 0.453915 & 0.907831 & 0.546085 \tabularnewline
52 & 0.454532 & 0.909064 & 0.545468 \tabularnewline
53 & 0.401396 & 0.802792 & 0.598604 \tabularnewline
54 & 0.317384 & 0.634768 & 0.682616 \tabularnewline
55 & 0.523157 & 0.953687 & 0.476843 \tabularnewline
56 & 0.480059 & 0.960117 & 0.519941 \tabularnewline
57 & 0.390907 & 0.781815 & 0.609093 \tabularnewline
58 & 0.30952 & 0.619039 & 0.69048 \tabularnewline
59 & 0.248559 & 0.497119 & 0.751441 \tabularnewline
60 & 0.409677 & 0.819355 & 0.590323 \tabularnewline
61 & 0.357603 & 0.715206 & 0.642397 \tabularnewline
62 & 0.27726 & 0.55452 & 0.72274 \tabularnewline
63 & 0.384347 & 0.768693 & 0.615653 \tabularnewline
64 & 0.270683 & 0.541367 & 0.729317 \tabularnewline
\hline
\end{tabular}
%Source: https://freestatistics.org/blog/index.php?pk=265014&T=5

[TABLE]
[ROW][C]Goldfeld-Quandt test for Heteroskedasticity[/C][/ROW]
[ROW][C]p-values[/C][C]Alternative Hypothesis[/C][/ROW]
[ROW][C]breakpoint index[/C][C]greater[/C][C]2-sided[/C][C]less[/C][/ROW]
[ROW][C]20[/C][C]0.0248992[/C][C]0.0497985[/C][C]0.975101[/C][/ROW]
[ROW][C]21[/C][C]0.0115015[/C][C]0.0230031[/C][C]0.988498[/C][/ROW]
[ROW][C]22[/C][C]0.00334756[/C][C]0.00669512[/C][C]0.996652[/C][/ROW]
[ROW][C]23[/C][C]0.00111879[/C][C]0.00223759[/C][C]0.998881[/C][/ROW]
[ROW][C]24[/C][C]0.00218923[/C][C]0.00437846[/C][C]0.997811[/C][/ROW]
[ROW][C]25[/C][C]0.0308872[/C][C]0.0617743[/C][C]0.969113[/C][/ROW]
[ROW][C]26[/C][C]0.0774733[/C][C]0.154947[/C][C]0.922527[/C][/ROW]
[ROW][C]27[/C][C]0.102081[/C][C]0.204163[/C][C]0.897919[/C][/ROW]
[ROW][C]28[/C][C]0.124081[/C][C]0.248162[/C][C]0.875919[/C][/ROW]
[ROW][C]29[/C][C]0.0798494[/C][C]0.159699[/C][C]0.920151[/C][/ROW]
[ROW][C]30[/C][C]0.0643168[/C][C]0.128634[/C][C]0.935683[/C][/ROW]
[ROW][C]31[/C][C]0.0399656[/C][C]0.0799312[/C][C]0.960034[/C][/ROW]
[ROW][C]32[/C][C]0.036996[/C][C]0.0739919[/C][C]0.963004[/C][/ROW]
[ROW][C]33[/C][C]0.0326184[/C][C]0.0652368[/C][C]0.967382[/C][/ROW]
[ROW][C]34[/C][C]0.0590128[/C][C]0.118026[/C][C]0.940987[/C][/ROW]
[ROW][C]35[/C][C]0.0442045[/C][C]0.088409[/C][C]0.955795[/C][/ROW]
[ROW][C]36[/C][C]0.243152[/C][C]0.486303[/C][C]0.756848[/C][/ROW]
[ROW][C]37[/C][C]0.23224[/C][C]0.46448[/C][C]0.76776[/C][/ROW]
[ROW][C]38[/C][C]0.398672[/C][C]0.797343[/C][C]0.601328[/C][/ROW]
[ROW][C]39[/C][C]0.375095[/C][C]0.75019[/C][C]0.624905[/C][/ROW]
[ROW][C]40[/C][C]0.362595[/C][C]0.72519[/C][C]0.637405[/C][/ROW]
[ROW][C]41[/C][C]0.306721[/C][C]0.613443[/C][C]0.693279[/C][/ROW]
[ROW][C]42[/C][C]0.25355[/C][C]0.507101[/C][C]0.74645[/C][/ROW]
[ROW][C]43[/C][C]0.202067[/C][C]0.404134[/C][C]0.797933[/C][/ROW]
[ROW][C]44[/C][C]0.193612[/C][C]0.387224[/C][C]0.806388[/C][/ROW]
[ROW][C]45[/C][C]0.165503[/C][C]0.331005[/C][C]0.834497[/C][/ROW]
[ROW][C]46[/C][C]0.158006[/C][C]0.316011[/C][C]0.841994[/C][/ROW]
[ROW][C]47[/C][C]0.118869[/C][C]0.237739[/C][C]0.881131[/C][/ROW]
[ROW][C]48[/C][C]0.20832[/C][C]0.416641[/C][C]0.79168[/C][/ROW]
[ROW][C]49[/C][C]0.208521[/C][C]0.417042[/C][C]0.791479[/C][/ROW]
[ROW][C]50[/C][C]0.292462[/C][C]0.584924[/C][C]0.707538[/C][/ROW]
[ROW][C]51[/C][C]0.453915[/C][C]0.907831[/C][C]0.546085[/C][/ROW]
[ROW][C]52[/C][C]0.454532[/C][C]0.909064[/C][C]0.545468[/C][/ROW]
[ROW][C]53[/C][C]0.401396[/C][C]0.802792[/C][C]0.598604[/C][/ROW]
[ROW][C]54[/C][C]0.317384[/C][C]0.634768[/C][C]0.682616[/C][/ROW]
[ROW][C]55[/C][C]0.523157[/C][C]0.953687[/C][C]0.476843[/C][/ROW]
[ROW][C]56[/C][C]0.480059[/C][C]0.960117[/C][C]0.519941[/C][/ROW]
[ROW][C]57[/C][C]0.390907[/C][C]0.781815[/C][C]0.609093[/C][/ROW]
[ROW][C]58[/C][C]0.30952[/C][C]0.619039[/C][C]0.69048[/C][/ROW]
[ROW][C]59[/C][C]0.248559[/C][C]0.497119[/C][C]0.751441[/C][/ROW]
[ROW][C]60[/C][C]0.409677[/C][C]0.819355[/C][C]0.590323[/C][/ROW]
[ROW][C]61[/C][C]0.357603[/C][C]0.715206[/C][C]0.642397[/C][/ROW]
[ROW][C]62[/C][C]0.27726[/C][C]0.55452[/C][C]0.72274[/C][/ROW]
[ROW][C]63[/C][C]0.384347[/C][C]0.768693[/C][C]0.615653[/C][/ROW]
[ROW][C]64[/C][C]0.270683[/C][C]0.541367[/C][C]0.729317[/C][/ROW]
[/TABLE]
Source: https://freestatistics.org/blog/index.php?pk=265014&T=5

Globally Unique Identifier (entire table): ba.freestatistics.org/blog/index.php?pk=265014&T=5

As an alternative you can also use a QR Code:  

The GUIDs for individual cells are displayed in the table below:

Goldfeld-Quandt test for Heteroskedasticity
p-valuesAlternative Hypothesis
breakpoint indexgreater2-sidedless
200.02489920.04979850.975101
210.01150150.02300310.988498
220.003347560.006695120.996652
230.001118790.002237590.998881
240.002189230.004378460.997811
250.03088720.06177430.969113
260.07747330.1549470.922527
270.1020810.2041630.897919
280.1240810.2481620.875919
290.07984940.1596990.920151
300.06431680.1286340.935683
310.03996560.07993120.960034
320.0369960.07399190.963004
330.03261840.06523680.967382
340.05901280.1180260.940987
350.04420450.0884090.955795
360.2431520.4863030.756848
370.232240.464480.76776
380.3986720.7973430.601328
390.3750950.750190.624905
400.3625950.725190.637405
410.3067210.6134430.693279
420.253550.5071010.74645
430.2020670.4041340.797933
440.1936120.3872240.806388
450.1655030.3310050.834497
460.1580060.3160110.841994
470.1188690.2377390.881131
480.208320.4166410.79168
490.2085210.4170420.791479
500.2924620.5849240.707538
510.4539150.9078310.546085
520.4545320.9090640.545468
530.4013960.8027920.598604
540.3173840.6347680.682616
550.5231570.9536870.476843
560.4800590.9601170.519941
570.3909070.7818150.609093
580.309520.6190390.69048
590.2485590.4971190.751441
600.4096770.8193550.590323
610.3576030.7152060.642397
620.277260.554520.72274
630.3843470.7686930.615653
640.2706830.5413670.729317


Meta Analysis of Goldfeld-Quandt test for Heteroskedasticity
Description# significant tests% significant testsOK/NOK
1% type I error level30.0666667NOK
5% type I error level50.111111NOK
10% type I error level100.222222NOK

\begin{tabular}{lllllllll}
\hline
Meta Analysis of Goldfeld-Quandt test for Heteroskedasticity \tabularnewline
Description & # significant tests & % significant tests & OK/NOK \tabularnewline
1% type I error level & 3 & 0.0666667 & NOK \tabularnewline
5% type I error level & 5 & 0.111111 & NOK \tabularnewline
10% type I error level & 10 & 0.222222 & NOK \tabularnewline
\hline
\end{tabular}
%Source: https://freestatistics.org/blog/index.php?pk=265014&T=6

[TABLE]
[ROW][C]Meta Analysis of Goldfeld-Quandt test for Heteroskedasticity[/C][/ROW]
[ROW][C]Description[/C][C]# significant tests[/C][C]% significant tests[/C][C]OK/NOK[/C][/ROW]
[ROW][C]1% type I error level[/C][C]3[/C][C]0.0666667[/C][C]NOK[/C][/ROW]
[ROW][C]5% type I error level[/C][C]5[/C][C]0.111111[/C][C]NOK[/C][/ROW]
[ROW][C]10% type I error level[/C][C]10[/C][C]0.222222[/C][C]NOK[/C][/ROW]
[/TABLE]
Source: https://freestatistics.org/blog/index.php?pk=265014&T=6

Globally Unique Identifier (entire table): ba.freestatistics.org/blog/index.php?pk=265014&T=6

As an alternative you can also use a QR Code:  

The GUIDs for individual cells are displayed in the table below:

Meta Analysis of Goldfeld-Quandt test for Heteroskedasticity
Description# significant tests% significant testsOK/NOK
1% type I error level30.0666667NOK
5% type I error level50.111111NOK
10% type I error level100.222222NOK


Parameters (Session):
par1 = 1 ; par2 = Include Monthly Dummies ; par3 = No Linear Trend ;
Parameters (R input):
par1 = 1 ; par2 = Include Monthly Dummies ; par3 = No Linear Trend ;
R code (references can be found in the software module):
library(lattice)
library(lmtest)
n25 <- 25 #minimum number of obs. for Goldfeld-Quandt test
par1 <- as.numeric(par1)
x <- t(y)
k <- length(x[1,])
n <- length(x[,1])
x1 <- cbind(x[,par1], x[,1:k!=par1])
mycolnames <- c(colnames(x)[par1], colnames(x)[1:k!=par1])
colnames(x1) <- mycolnames #colnames(x)[par1]
x <- x1
if (par3 == 'First Differences'){
x2 <- array(0, dim=c(n-1,k), dimnames=list(1:(n-1), paste('(1-B)',colnames(x),sep='')))
for (i in 1:n-1) {
for (j in 1:k) {
x2[i,j] <- x[i+1,j] - x[i,j]
}
}
x <- x2
}
if (par2 == 'Include Monthly Dummies'){
x2 <- array(0, dim=c(n,11), dimnames=list(1:n, paste('M', seq(1:11), sep ='')))
for (i in 1:11){
x2[seq(i,n,12),i] <- 1
}
x <- cbind(x, x2)
}
if (par2 == 'Include Quarterly Dummies'){
x2 <- array(0, dim=c(n,3), dimnames=list(1:n, paste('Q', seq(1:3), sep ='')))
for (i in 1:3){
x2[seq(i,n,4),i] <- 1
}
x <- cbind(x, x2)
}
k <- length(x[1,])
if (par3 == 'Linear Trend'){
x <- cbind(x, c(1:n))
colnames(x)[k+1] <- 't'
}
x
k <- length(x[1,])
df <- as.data.frame(x)
(mylm <- lm(df))
(mysum <- summary(mylm))
if (n > n25) {
kp3 <- k + 3
nmkm3 <- n - k - 3
gqarr <- array(NA, dim=c(nmkm3-kp3+1,3))
numgqtests <- 0
numsignificant1 <- 0
numsignificant5 <- 0
numsignificant10 <- 0
for (mypoint in kp3:nmkm3) {
j <- 0
numgqtests <- numgqtests + 1
for (myalt in c('greater', 'two.sided', 'less')) {
j <- j + 1
gqarr[mypoint-kp3+1,j] <- gqtest(mylm, point=mypoint, alternative=myalt)$p.value
}
if (gqarr[mypoint-kp3+1,2] < 0.01) numsignificant1 <- numsignificant1 + 1
if (gqarr[mypoint-kp3+1,2] < 0.05) numsignificant5 <- numsignificant5 + 1
if (gqarr[mypoint-kp3+1,2] < 0.10) numsignificant10 <- numsignificant10 + 1
}
gqarr
}
bitmap(file='test0.png')
plot(x[,1], type='l', main='Actuals and Interpolation', ylab='value of Actuals and Interpolation (dots)', xlab='time or index')
points(x[,1]-mysum$resid)
grid()
dev.off()
bitmap(file='test1.png')
plot(mysum$resid, type='b', pch=19, main='Residuals', ylab='value of Residuals', xlab='time or index')
grid()
dev.off()
bitmap(file='test2.png')
hist(mysum$resid, main='Residual Histogram', xlab='values of Residuals')
grid()
dev.off()
bitmap(file='test3.png')
densityplot(~mysum$resid,col='black',main='Residual Density Plot', xlab='values of Residuals')
dev.off()
bitmap(file='test4.png')
qqnorm(mysum$resid, main='Residual Normal Q-Q Plot')
qqline(mysum$resid)
grid()
dev.off()
(myerror <- as.ts(mysum$resid))
bitmap(file='test5.png')
dum <- cbind(lag(myerror,k=1),myerror)
dum
dum1 <- dum[2:length(myerror),]
dum1
z <- as.data.frame(dum1)
z
plot(z,main=paste('Residual Lag plot, lowess, and regression line'), ylab='values of Residuals', xlab='lagged values of Residuals')
lines(lowess(z))
abline(lm(z))
grid()
dev.off()
bitmap(file='test6.png')
acf(mysum$resid, lag.max=length(mysum$resid)/2, main='Residual Autocorrelation Function')
grid()
dev.off()
bitmap(file='test7.png')
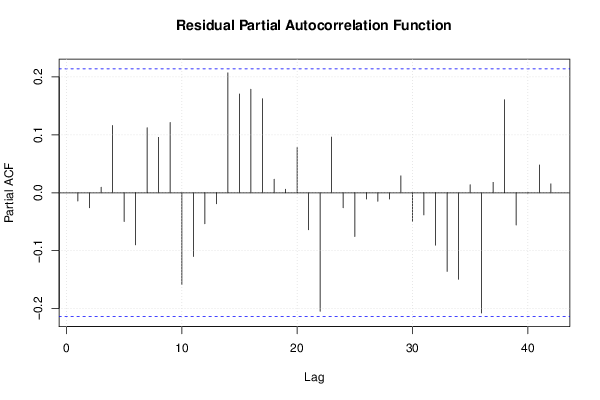
pacf(mysum$resid, lag.max=length(mysum$resid)/2, main='Residual Partial Autocorrelation Function')
grid()
dev.off()
bitmap(file='test8.png')
opar <- par(mfrow = c(2,2), oma = c(0, 0, 1.1, 0))
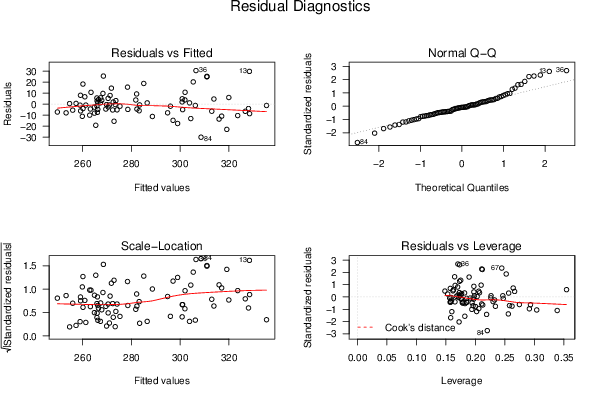
plot(mylm, las = 1, sub='Residual Diagnostics')
par(opar)
dev.off()
if (n > n25) {
bitmap(file='test9.png')
plot(kp3:nmkm3,gqarr[,2], main='Goldfeld-Quandt test',ylab='2-sided p-value',xlab='breakpoint')
grid()
dev.off()
}
load(file='createtable')
a<-table.start()
a<-table.row.start(a)
a<-table.element(a, 'Multiple Linear Regression - Estimated Regression Equation', 1, TRUE)
a<-table.row.end(a)
myeq <- colnames(x)[1]
myeq <- paste(myeq, '[t] = ', sep='')
for (i in 1:k){
if (mysum$coefficients[i,1] > 0) myeq <- paste(myeq, '+', '')
myeq <- paste(myeq, signif(mysum$coefficients[i,1],6), sep=' ')
if (rownames(mysum$coefficients)[i] != '(Intercept)') {
myeq <- paste(myeq, rownames(mysum$coefficients)[i], sep='')
if (rownames(mysum$coefficients)[i] != 't') myeq <- paste(myeq, '[t]', sep='')
}
}
myeq <- paste(myeq, ' + e[t]')
a<-table.row.start(a)
a<-table.element(a, myeq)
a<-table.row.end(a)
a<-table.end(a)
table.save(a,file='mytable1.tab')
a<-table.start()
a<-table.row.start(a)
a<-table.element(a,hyperlink('ols1.htm','Multiple Linear Regression - Ordinary Least Squares',''), 6, TRUE)
a<-table.row.end(a)
a<-table.row.start(a)
a<-table.element(a,'Variable',header=TRUE)
a<-table.element(a,'Parameter',header=TRUE)
a<-table.element(a,'S.D.',header=TRUE)
a<-table.element(a,'T-STAT
H0: parameter = 0',header=TRUE)
a<-table.element(a,'2-tail p-value',header=TRUE)
a<-table.element(a,'1-tail p-value',header=TRUE)
a<-table.row.end(a)
for (i in 1:k){
a<-table.row.start(a)
a<-table.element(a,rownames(mysum$coefficients)[i],header=TRUE)
a<-table.element(a,signif(mysum$coefficients[i,1],6))
a<-table.element(a, signif(mysum$coefficients[i,2],6))
a<-table.element(a, signif(mysum$coefficients[i,3],4))
a<-table.element(a, signif(mysum$coefficients[i,4],6))
a<-table.element(a, signif(mysum$coefficients[i,4]/2,6))
a<-table.row.end(a)
}
a<-table.end(a)
table.save(a,file='mytable2.tab')
a<-table.start()
a<-table.row.start(a)
a<-table.element(a, 'Multiple Linear Regression - Regression Statistics', 2, TRUE)
a<-table.row.end(a)
a<-table.row.start(a)
a<-table.element(a, 'Multiple R',1,TRUE)
a<-table.element(a, signif(sqrt(mysum$r.squared),6))
a<-table.row.end(a)
a<-table.row.start(a)
a<-table.element(a, 'R-squared',1,TRUE)
a<-table.element(a, signif(mysum$r.squared,6))
a<-table.row.end(a)
a<-table.row.start(a)
a<-table.element(a, 'Adjusted R-squared',1,TRUE)
a<-table.element(a, signif(mysum$adj.r.squared,6))
a<-table.row.end(a)
a<-table.row.start(a)
a<-table.element(a, 'F-TEST (value)',1,TRUE)
a<-table.element(a, signif(mysum$fstatistic[1],6))
a<-table.row.end(a)
a<-table.row.start(a)
a<-table.element(a, 'F-TEST (DF numerator)',1,TRUE)
a<-table.element(a, signif(mysum$fstatistic[2],6))
a<-table.row.end(a)
a<-table.row.start(a)
a<-table.element(a, 'F-TEST (DF denominator)',1,TRUE)
a<-table.element(a, signif(mysum$fstatistic[3],6))
a<-table.row.end(a)
a<-table.row.start(a)
a<-table.element(a, 'p-value',1,TRUE)
a<-table.element(a, signif(1-pf(mysum$fstatistic[1],mysum$fstatistic[2],mysum$fstatistic[3]),6))
a<-table.row.end(a)
a<-table.row.start(a)
a<-table.element(a, 'Multiple Linear Regression - Residual Statistics', 2, TRUE)
a<-table.row.end(a)
a<-table.row.start(a)
a<-table.element(a, 'Residual Standard Deviation',1,TRUE)
a<-table.element(a, signif(mysum$sigma,6))
a<-table.row.end(a)
a<-table.row.start(a)
a<-table.element(a, 'Sum Squared Residuals',1,TRUE)
a<-table.element(a, signif(sum(myerror*myerror),6))
a<-table.row.end(a)
a<-table.end(a)
table.save(a,file='mytable3.tab')
a<-table.start()
a<-table.row.start(a)
a<-table.element(a, 'Multiple Linear Regression - Actuals, Interpolation, and Residuals', 4, TRUE)
a<-table.row.end(a)
a<-table.row.start(a)
a<-table.element(a, 'Time or Index', 1, TRUE)
a<-table.element(a, 'Actuals', 1, TRUE)
a<-table.element(a, 'Interpolation
Forecast', 1, TRUE)
a<-table.element(a, 'Residuals
Prediction Error', 1, TRUE)
a<-table.row.end(a)
for (i in 1:n) {
a<-table.row.start(a)
a<-table.element(a,i, 1, TRUE)
a<-table.element(a,signif(x[i],6))
a<-table.element(a,signif(x[i]-mysum$resid[i],6))
a<-table.element(a,signif(mysum$resid[i],6))
a<-table.row.end(a)
}
a<-table.end(a)
table.save(a,file='mytable4.tab')
if (n > n25) {
a<-table.start()
a<-table.row.start(a)
a<-table.element(a,'Goldfeld-Quandt test for Heteroskedasticity',4,TRUE)
a<-table.row.end(a)
a<-table.row.start(a)
a<-table.element(a,'p-values',header=TRUE)
a<-table.element(a,'Alternative Hypothesis',3,header=TRUE)
a<-table.row.end(a)
a<-table.row.start(a)
a<-table.element(a,'breakpoint index',header=TRUE)
a<-table.element(a,'greater',header=TRUE)
a<-table.element(a,'2-sided',header=TRUE)
a<-table.element(a,'less',header=TRUE)
a<-table.row.end(a)
for (mypoint in kp3:nmkm3) {
a<-table.row.start(a)
a<-table.element(a,mypoint,header=TRUE)
a<-table.element(a,signif(gqarr[mypoint-kp3+1,1],6))
a<-table.element(a,signif(gqarr[mypoint-kp3+1,2],6))
a<-table.element(a,signif(gqarr[mypoint-kp3+1,3],6))
a<-table.row.end(a)
}
a<-table.end(a)
table.save(a,file='mytable5.tab')
a<-table.start()
a<-table.row.start(a)
a<-table.element(a,'Meta Analysis of Goldfeld-Quandt test for Heteroskedasticity',4,TRUE)
a<-table.row.end(a)
a<-table.row.start(a)
a<-table.element(a,'Description',header=TRUE)
a<-table.element(a,'# significant tests',header=TRUE)
a<-table.element(a,'% significant tests',header=TRUE)
a<-table.element(a,'OK/NOK',header=TRUE)
a<-table.row.end(a)
a<-table.row.start(a)
a<-table.element(a,'1% type I error level',header=TRUE)
a<-table.element(a,signif(numsignificant1,6))
a<-table.element(a,signif(numsignificant1/numgqtests,6))
if (numsignificant1/numgqtests < 0.01) dum <- 'OK' else dum <- 'NOK'
a<-table.element(a,dum)
a<-table.row.end(a)
a<-table.row.start(a)
a<-table.element(a,'5% type I error level',header=TRUE)
a<-table.element(a,signif(numsignificant5,6))
a<-table.element(a,signif(numsignificant5/numgqtests,6))
if (numsignificant5/numgqtests < 0.05) dum <- 'OK' else dum <- 'NOK'
a<-table.element(a,dum)
a<-table.row.end(a)
a<-table.row.start(a)
a<-table.element(a,'10% type I error level',header=TRUE)
a<-table.element(a,signif(numsignificant10,6))
a<-table.element(a,signif(numsignificant10/numgqtests,6))
if (numsignificant10/numgqtests < 0.1) dum <- 'OK' else dum <- 'NOK'
a<-table.element(a,dum)
a<-table.row.end(a)
a<-table.end(a)
table.save(a,file='mytable6.tab')
}