Free Statistics

of Irreproducible Research!

Author's title

Author*The author of this computation has been verified*
R Software Modulerwasp_multipleregression.wasp
Title produced by softwareMultiple Regression
Date of computationMon, 08 Dec 2014 18:36:48 +0000
Cite this page as followsStatistical Computations at FreeStatistics.org, Office for Research Development and Education, URL https://freestatistics.org/blog/index.php?v=date/2014/Dec/08/t1418064145xdbk7w77ce2whak.htm/, Retrieved Sun, 19 May 2024 12:19:18 +0000
Statistical Computations at FreeStatistics.org, Office for Research Development and Education, URL https://freestatistics.org/blog/index.php?pk=264147, Retrieved Sun, 19 May 2024 12:19:18 +0000
QR Codes:

Original text written by user:
IsPrivate?No (this computation is public)
User-defined keywords
Estimated Impact86
Family? (F = Feedback message, R = changed R code, M = changed R Module, P = changed Parameters, D = changed Data)
-     [Chi-Squared Test, McNemar Test, and Fisher Exact Test] [] [2014-12-06 15:29:08] [4c4ebb0b36a379d1d949ba77427e658a]
- RM D  [Chi-Squared Test, McNemar Test, and Fisher Exact Test] [] [2014-12-08 17:37:26] [4c4ebb0b36a379d1d949ba77427e658a]
-    D    [Chi-Squared Test, McNemar Test, and Fisher Exact Test] [] [2014-12-08 17:38:14] [4c4ebb0b36a379d1d949ba77427e658a]
-    D      [Chi-Squared Test, McNemar Test, and Fisher Exact Test] [] [2014-12-08 17:38:46] [4c4ebb0b36a379d1d949ba77427e658a]
- RMPD          [Multiple Regression] [] [2014-12-08 18:36:48] [d9810f96fa2f1581f787e7f797109997] [Current]
Feedback Forum

Post a new message
Dataseries X:
1 29 17 20 27
0 25 31 17 30
1 24 34 20 24
1 30 38 31 16
0 24 30 16 27
0 28 29 24 18
1 25 31 24 24
1 34 39 27 24
1 24 25 21 18
1 27 31 24 22
0 31 34 16 25
1 23 19 19 16
0 32 27 24 18
1 23 22 24 24
1 29 34 11 24
0 36 28 27 29
1 26 28 21 21
0 27 29 27 23
1 36 33 19 23
1 33 28 27 19
1 26 30 29 24
1 37 41 19 20
1 35 36 29 24
0 29 30 22 22
1 24 23 19 24
0 18 14 18 20
1 21 28 32 23
0 40 22 26 19
0 22 26 22 22
0 32 26 39 24
1 34 30 20 20
1 19 30 17 24
1 30 28 23 26
0 29 34 22 24
1 35 35 14 24
0 18 16 15 21
1 24 30 20 22
1 39 29 31 29
1 15 15 16 23
1 29 28 25 25
1 27 25 13 23
1 41 48 37 30
1 16 18 14 16
1 36 22 15 13
1 28 41 17 29
1 24 29 16 24
0 28 26 15 22
1 26 34 18 26
0 37 42 28 26
1 21 21 14 21
0 29 32 26 23
1 29 31 20 28
1 33 39 14 29
1 24 21 25 16
1 31 35 22 28
1 30 27 26 24
0 27 38 21 24
1 24 30 18 12
1 29 26 22 22
1 27 33 18 22
1 26 23 22 26
0 24 17 11 26


Summary of computational transaction
Raw Inputview raw input (R code)
Raw Outputview raw output of R engine
Computing time5 seconds
R Server'Sir Maurice George Kendall' @ kendall.wessa.net

\begin{tabular}{lllllllll}
\hline
Summary of computational transaction \tabularnewline
Raw Input & view raw input (R code)  \tabularnewline
Raw Output & view raw output of R engine  \tabularnewline
Computing time & 5 seconds \tabularnewline
R Server & 'Sir Maurice George Kendall' @ kendall.wessa.net \tabularnewline
\hline
\end{tabular}
%Source: https://freestatistics.org/blog/index.php?pk=264147&T=0

[TABLE]
[ROW][C]Summary of computational transaction[/C][/ROW]
[ROW][C]Raw Input[/C][C]view raw input (R code) [/C][/ROW]
[ROW][C]Raw Output[/C][C]view raw output of R engine [/C][/ROW]
[ROW][C]Computing time[/C][C]5 seconds[/C][/ROW]
[ROW][C]R Server[/C][C]'Sir Maurice George Kendall' @ kendall.wessa.net[/C][/ROW]
[/TABLE]
Source: https://freestatistics.org/blog/index.php?pk=264147&T=0

Globally Unique Identifier (entire table): ba.freestatistics.org/blog/index.php?pk=264147&T=0

As an alternative you can also use a QR Code:  

The GUIDs for individual cells are displayed in the table below:

Summary of computational transaction
Raw Inputview raw input (R code)
Raw Outputview raw output of R engine
Computing time5 seconds
R Server'Sir Maurice George Kendall' @ kendall.wessa.net


Multiple Linear Regression - Estimated Regression Equation
TOT_BIN[t] = + 0.905456 -0.00669091P1[t] + 0.0134435P2[t] -0.00496521P3[t] -0.0133956P4[t] + e[t]

\begin{tabular}{lllllllll}
\hline
Multiple Linear Regression - Estimated Regression Equation \tabularnewline
TOT_BIN[t] =  +  0.905456 -0.00669091P1[t] +  0.0134435P2[t] -0.00496521P3[t] -0.0133956P4[t]  + e[t] \tabularnewline
\hline
\end{tabular}
%Source: https://freestatistics.org/blog/index.php?pk=264147&T=1

[TABLE]
[ROW][C]Multiple Linear Regression - Estimated Regression Equation[/C][/ROW]
[ROW][C]TOT_BIN[t] =  +  0.905456 -0.00669091P1[t] +  0.0134435P2[t] -0.00496521P3[t] -0.0133956P4[t]  + e[t][/C][/ROW]
[/TABLE]
Source: https://freestatistics.org/blog/index.php?pk=264147&T=1

Globally Unique Identifier (entire table): ba.freestatistics.org/blog/index.php?pk=264147&T=1

As an alternative you can also use a QR Code:  

The GUIDs for individual cells are displayed in the table below:

Multiple Linear Regression - Estimated Regression Equation
TOT_BIN[t] = + 0.905456 -0.00669091P1[t] + 0.0134435P2[t] -0.00496521P3[t] -0.0133956P4[t] + e[t]


Multiple Linear Regression - Ordinary Least Squares
VariableParameterS.D.T-STATH0: parameter = 02-tail p-value1-tail p-value
(Intercept)0.9054560.4330572.0910.04101120.0205056
P1-0.006690910.0134167-0.49870.619910.309955
P20.01344350.01096581.2260.2252590.11263
P3-0.004965210.0112383-0.44180.6602970.330149
P4-0.01339560.0163744-0.81810.4167180.208359

\begin{tabular}{lllllllll}
\hline
Multiple Linear Regression - Ordinary Least Squares \tabularnewline
Variable & Parameter & S.D. & T-STATH0: parameter = 0 & 2-tail p-value & 1-tail p-value \tabularnewline
(Intercept) & 0.905456 & 0.433057 & 2.091 & 0.0410112 & 0.0205056 \tabularnewline
P1 & -0.00669091 & 0.0134167 & -0.4987 & 0.61991 & 0.309955 \tabularnewline
P2 & 0.0134435 & 0.0109658 & 1.226 & 0.225259 & 0.11263 \tabularnewline
P3 & -0.00496521 & 0.0112383 & -0.4418 & 0.660297 & 0.330149 \tabularnewline
P4 & -0.0133956 & 0.0163744 & -0.8181 & 0.416718 & 0.208359 \tabularnewline
\hline
\end{tabular}
%Source: https://freestatistics.org/blog/index.php?pk=264147&T=2

[TABLE]
[ROW][C]Multiple Linear Regression - Ordinary Least Squares[/C][/ROW]
[ROW][C]Variable[/C][C]Parameter[/C][C]S.D.[/C][C]T-STATH0: parameter = 0[/C][C]2-tail p-value[/C][C]1-tail p-value[/C][/ROW]
[ROW][C](Intercept)[/C][C]0.905456[/C][C]0.433057[/C][C]2.091[/C][C]0.0410112[/C][C]0.0205056[/C][/ROW]
[ROW][C]P1[/C][C]-0.00669091[/C][C]0.0134167[/C][C]-0.4987[/C][C]0.61991[/C][C]0.309955[/C][/ROW]
[ROW][C]P2[/C][C]0.0134435[/C][C]0.0109658[/C][C]1.226[/C][C]0.225259[/C][C]0.11263[/C][/ROW]
[ROW][C]P3[/C][C]-0.00496521[/C][C]0.0112383[/C][C]-0.4418[/C][C]0.660297[/C][C]0.330149[/C][/ROW]
[ROW][C]P4[/C][C]-0.0133956[/C][C]0.0163744[/C][C]-0.8181[/C][C]0.416718[/C][C]0.208359[/C][/ROW]
[/TABLE]
Source: https://freestatistics.org/blog/index.php?pk=264147&T=2

Globally Unique Identifier (entire table): ba.freestatistics.org/blog/index.php?pk=264147&T=2

As an alternative you can also use a QR Code:  

The GUIDs for individual cells are displayed in the table below:

Multiple Linear Regression - Ordinary Least Squares
VariableParameterS.D.T-STATH0: parameter = 02-tail p-value1-tail p-value
(Intercept)0.9054560.4330572.0910.04101120.0205056
P1-0.006690910.0134167-0.49870.619910.309955
P20.01344350.01096581.2260.2252590.11263
P3-0.004965210.0112383-0.44180.6602970.330149
P4-0.01339560.0163744-0.81810.4167180.208359


Multiple Linear Regression - Regression Statistics
Multiple R0.178818
R-squared0.031976
Adjusted R-squared-0.0359555
F-TEST (value)0.47071
F-TEST (DF numerator)4
F-TEST (DF denominator)57
p-value0.756984
Multiple Linear Regression - Residual Statistics
Residual Standard Deviation0.473065
Sum Squared Residuals12.7561

\begin{tabular}{lllllllll}
\hline
Multiple Linear Regression - Regression Statistics \tabularnewline
Multiple R & 0.178818 \tabularnewline
R-squared & 0.031976 \tabularnewline
Adjusted R-squared & -0.0359555 \tabularnewline
F-TEST (value) & 0.47071 \tabularnewline
F-TEST (DF numerator) & 4 \tabularnewline
F-TEST (DF denominator) & 57 \tabularnewline
p-value & 0.756984 \tabularnewline
Multiple Linear Regression - Residual Statistics \tabularnewline
Residual Standard Deviation & 0.473065 \tabularnewline
Sum Squared Residuals & 12.7561 \tabularnewline
\hline
\end{tabular}
%Source: https://freestatistics.org/blog/index.php?pk=264147&T=3

[TABLE]
[ROW][C]Multiple Linear Regression - Regression Statistics[/C][/ROW]
[ROW][C]Multiple R[/C][C]0.178818[/C][/ROW]
[ROW][C]R-squared[/C][C]0.031976[/C][/ROW]
[ROW][C]Adjusted R-squared[/C][C]-0.0359555[/C][/ROW]
[ROW][C]F-TEST (value)[/C][C]0.47071[/C][/ROW]
[ROW][C]F-TEST (DF numerator)[/C][C]4[/C][/ROW]
[ROW][C]F-TEST (DF denominator)[/C][C]57[/C][/ROW]
[ROW][C]p-value[/C][C]0.756984[/C][/ROW]
[ROW][C]Multiple Linear Regression - Residual Statistics[/C][/ROW]
[ROW][C]Residual Standard Deviation[/C][C]0.473065[/C][/ROW]
[ROW][C]Sum Squared Residuals[/C][C]12.7561[/C][/ROW]
[/TABLE]
Source: https://freestatistics.org/blog/index.php?pk=264147&T=3

Globally Unique Identifier (entire table): ba.freestatistics.org/blog/index.php?pk=264147&T=3

As an alternative you can also use a QR Code:  

The GUIDs for individual cells are displayed in the table below:

Multiple Linear Regression - Regression Statistics
Multiple R0.178818
R-squared0.031976
Adjusted R-squared-0.0359555
F-TEST (value)0.47071
F-TEST (DF numerator)4
F-TEST (DF denominator)57
p-value0.756984
Multiple Linear Regression - Residual Statistics
Residual Standard Deviation0.473065
Sum Squared Residuals12.7561


Multiple Linear Regression - Actuals, Interpolation, and Residuals
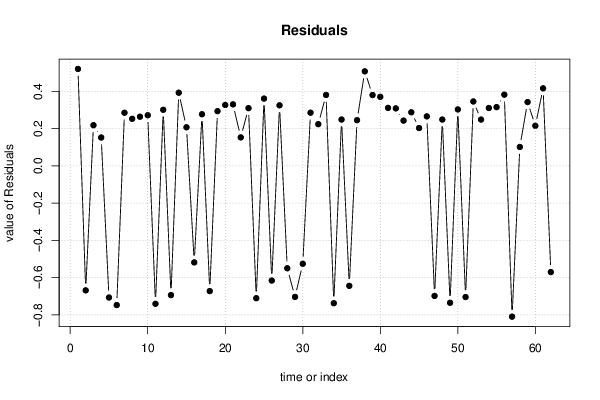
Time or IndexActualsInterpolationForecastResidualsPrediction Error
110.4789740.521026
200.668655-0.668655
310.7811540.218846
410.847330.15267
500.707055-0.707055
600.747686-0.747686
710.7142720.285728
810.7467060.253294
910.7355720.264428
1010.7276820.272318
1100.740783-0.740783
1210.6983230.301677
1300.694036-0.694036
1410.6066630.393337
1510.7923870.207613
1600.518468-0.518468
1710.7223330.277667
1800.672504-0.672504
1910.7057810.294219
2010.6724970.327503
2110.6693120.330688
2210.8468250.153175
2310.6897550.310245
2400.710787-0.710787
2510.6382410.361759
2600.615943-0.615943
2710.6743790.325621
2800.549965-0.549965
2900.703849-0.703849
3000.52574-0.52574
3110.7140540.285946
3210.7757310.224269
3310.6186610.381339
3400.73777-0.73777
3510.7507890.249211
3600.64433-0.64433
3710.7541720.245828
3810.4919780.508022
3910.6192030.380797
4010.6288170.371183
4110.6882420.311758
4210.6908360.309164
4310.7565420.243458
4410.7117190.288281
4510.7964130.203587
4610.7337980.266202
4700.69846-0.69846
4810.7509120.249088
4900.735208-0.735208
5010.696440.30356
5100.704417-0.704417
5210.6537870.346213
5310.7509670.249033
5410.6887280.311272
5510.6842490.315751
5610.6171130.382887
5700.80989-0.80989
5810.8980580.101942
5910.6570130.342987
6010.784360.21564
6110.5831730.416827
6200.570511-0.570511

\begin{tabular}{lllllllll}
\hline
Multiple Linear Regression - Actuals, Interpolation, and Residuals \tabularnewline
Time or Index & Actuals & InterpolationForecast & ResidualsPrediction Error \tabularnewline
1 & 1 & 0.478974 & 0.521026 \tabularnewline
2 & 0 & 0.668655 & -0.668655 \tabularnewline
3 & 1 & 0.781154 & 0.218846 \tabularnewline
4 & 1 & 0.84733 & 0.15267 \tabularnewline
5 & 0 & 0.707055 & -0.707055 \tabularnewline
6 & 0 & 0.747686 & -0.747686 \tabularnewline
7 & 1 & 0.714272 & 0.285728 \tabularnewline
8 & 1 & 0.746706 & 0.253294 \tabularnewline
9 & 1 & 0.735572 & 0.264428 \tabularnewline
10 & 1 & 0.727682 & 0.272318 \tabularnewline
11 & 0 & 0.740783 & -0.740783 \tabularnewline
12 & 1 & 0.698323 & 0.301677 \tabularnewline
13 & 0 & 0.694036 & -0.694036 \tabularnewline
14 & 1 & 0.606663 & 0.393337 \tabularnewline
15 & 1 & 0.792387 & 0.207613 \tabularnewline
16 & 0 & 0.518468 & -0.518468 \tabularnewline
17 & 1 & 0.722333 & 0.277667 \tabularnewline
18 & 0 & 0.672504 & -0.672504 \tabularnewline
19 & 1 & 0.705781 & 0.294219 \tabularnewline
20 & 1 & 0.672497 & 0.327503 \tabularnewline
21 & 1 & 0.669312 & 0.330688 \tabularnewline
22 & 1 & 0.846825 & 0.153175 \tabularnewline
23 & 1 & 0.689755 & 0.310245 \tabularnewline
24 & 0 & 0.710787 & -0.710787 \tabularnewline
25 & 1 & 0.638241 & 0.361759 \tabularnewline
26 & 0 & 0.615943 & -0.615943 \tabularnewline
27 & 1 & 0.674379 & 0.325621 \tabularnewline
28 & 0 & 0.549965 & -0.549965 \tabularnewline
29 & 0 & 0.703849 & -0.703849 \tabularnewline
30 & 0 & 0.52574 & -0.52574 \tabularnewline
31 & 1 & 0.714054 & 0.285946 \tabularnewline
32 & 1 & 0.775731 & 0.224269 \tabularnewline
33 & 1 & 0.618661 & 0.381339 \tabularnewline
34 & 0 & 0.73777 & -0.73777 \tabularnewline
35 & 1 & 0.750789 & 0.249211 \tabularnewline
36 & 0 & 0.64433 & -0.64433 \tabularnewline
37 & 1 & 0.754172 & 0.245828 \tabularnewline
38 & 1 & 0.491978 & 0.508022 \tabularnewline
39 & 1 & 0.619203 & 0.380797 \tabularnewline
40 & 1 & 0.628817 & 0.371183 \tabularnewline
41 & 1 & 0.688242 & 0.311758 \tabularnewline
42 & 1 & 0.690836 & 0.309164 \tabularnewline
43 & 1 & 0.756542 & 0.243458 \tabularnewline
44 & 1 & 0.711719 & 0.288281 \tabularnewline
45 & 1 & 0.796413 & 0.203587 \tabularnewline
46 & 1 & 0.733798 & 0.266202 \tabularnewline
47 & 0 & 0.69846 & -0.69846 \tabularnewline
48 & 1 & 0.750912 & 0.249088 \tabularnewline
49 & 0 & 0.735208 & -0.735208 \tabularnewline
50 & 1 & 0.69644 & 0.30356 \tabularnewline
51 & 0 & 0.704417 & -0.704417 \tabularnewline
52 & 1 & 0.653787 & 0.346213 \tabularnewline
53 & 1 & 0.750967 & 0.249033 \tabularnewline
54 & 1 & 0.688728 & 0.311272 \tabularnewline
55 & 1 & 0.684249 & 0.315751 \tabularnewline
56 & 1 & 0.617113 & 0.382887 \tabularnewline
57 & 0 & 0.80989 & -0.80989 \tabularnewline
58 & 1 & 0.898058 & 0.101942 \tabularnewline
59 & 1 & 0.657013 & 0.342987 \tabularnewline
60 & 1 & 0.78436 & 0.21564 \tabularnewline
61 & 1 & 0.583173 & 0.416827 \tabularnewline
62 & 0 & 0.570511 & -0.570511 \tabularnewline
\hline
\end{tabular}
%Source: https://freestatistics.org/blog/index.php?pk=264147&T=4

[TABLE]
[ROW][C]Multiple Linear Regression - Actuals, Interpolation, and Residuals[/C][/ROW]
[ROW][C]Time or Index[/C][C]Actuals[/C][C]InterpolationForecast[/C][C]ResidualsPrediction Error[/C][/ROW]
[ROW][C]1[/C][C]1[/C][C]0.478974[/C][C]0.521026[/C][/ROW]
[ROW][C]2[/C][C]0[/C][C]0.668655[/C][C]-0.668655[/C][/ROW]
[ROW][C]3[/C][C]1[/C][C]0.781154[/C][C]0.218846[/C][/ROW]
[ROW][C]4[/C][C]1[/C][C]0.84733[/C][C]0.15267[/C][/ROW]
[ROW][C]5[/C][C]0[/C][C]0.707055[/C][C]-0.707055[/C][/ROW]
[ROW][C]6[/C][C]0[/C][C]0.747686[/C][C]-0.747686[/C][/ROW]
[ROW][C]7[/C][C]1[/C][C]0.714272[/C][C]0.285728[/C][/ROW]
[ROW][C]8[/C][C]1[/C][C]0.746706[/C][C]0.253294[/C][/ROW]
[ROW][C]9[/C][C]1[/C][C]0.735572[/C][C]0.264428[/C][/ROW]
[ROW][C]10[/C][C]1[/C][C]0.727682[/C][C]0.272318[/C][/ROW]
[ROW][C]11[/C][C]0[/C][C]0.740783[/C][C]-0.740783[/C][/ROW]
[ROW][C]12[/C][C]1[/C][C]0.698323[/C][C]0.301677[/C][/ROW]
[ROW][C]13[/C][C]0[/C][C]0.694036[/C][C]-0.694036[/C][/ROW]
[ROW][C]14[/C][C]1[/C][C]0.606663[/C][C]0.393337[/C][/ROW]
[ROW][C]15[/C][C]1[/C][C]0.792387[/C][C]0.207613[/C][/ROW]
[ROW][C]16[/C][C]0[/C][C]0.518468[/C][C]-0.518468[/C][/ROW]
[ROW][C]17[/C][C]1[/C][C]0.722333[/C][C]0.277667[/C][/ROW]
[ROW][C]18[/C][C]0[/C][C]0.672504[/C][C]-0.672504[/C][/ROW]
[ROW][C]19[/C][C]1[/C][C]0.705781[/C][C]0.294219[/C][/ROW]
[ROW][C]20[/C][C]1[/C][C]0.672497[/C][C]0.327503[/C][/ROW]
[ROW][C]21[/C][C]1[/C][C]0.669312[/C][C]0.330688[/C][/ROW]
[ROW][C]22[/C][C]1[/C][C]0.846825[/C][C]0.153175[/C][/ROW]
[ROW][C]23[/C][C]1[/C][C]0.689755[/C][C]0.310245[/C][/ROW]
[ROW][C]24[/C][C]0[/C][C]0.710787[/C][C]-0.710787[/C][/ROW]
[ROW][C]25[/C][C]1[/C][C]0.638241[/C][C]0.361759[/C][/ROW]
[ROW][C]26[/C][C]0[/C][C]0.615943[/C][C]-0.615943[/C][/ROW]
[ROW][C]27[/C][C]1[/C][C]0.674379[/C][C]0.325621[/C][/ROW]
[ROW][C]28[/C][C]0[/C][C]0.549965[/C][C]-0.549965[/C][/ROW]
[ROW][C]29[/C][C]0[/C][C]0.703849[/C][C]-0.703849[/C][/ROW]
[ROW][C]30[/C][C]0[/C][C]0.52574[/C][C]-0.52574[/C][/ROW]
[ROW][C]31[/C][C]1[/C][C]0.714054[/C][C]0.285946[/C][/ROW]
[ROW][C]32[/C][C]1[/C][C]0.775731[/C][C]0.224269[/C][/ROW]
[ROW][C]33[/C][C]1[/C][C]0.618661[/C][C]0.381339[/C][/ROW]
[ROW][C]34[/C][C]0[/C][C]0.73777[/C][C]-0.73777[/C][/ROW]
[ROW][C]35[/C][C]1[/C][C]0.750789[/C][C]0.249211[/C][/ROW]
[ROW][C]36[/C][C]0[/C][C]0.64433[/C][C]-0.64433[/C][/ROW]
[ROW][C]37[/C][C]1[/C][C]0.754172[/C][C]0.245828[/C][/ROW]
[ROW][C]38[/C][C]1[/C][C]0.491978[/C][C]0.508022[/C][/ROW]
[ROW][C]39[/C][C]1[/C][C]0.619203[/C][C]0.380797[/C][/ROW]
[ROW][C]40[/C][C]1[/C][C]0.628817[/C][C]0.371183[/C][/ROW]
[ROW][C]41[/C][C]1[/C][C]0.688242[/C][C]0.311758[/C][/ROW]
[ROW][C]42[/C][C]1[/C][C]0.690836[/C][C]0.309164[/C][/ROW]
[ROW][C]43[/C][C]1[/C][C]0.756542[/C][C]0.243458[/C][/ROW]
[ROW][C]44[/C][C]1[/C][C]0.711719[/C][C]0.288281[/C][/ROW]
[ROW][C]45[/C][C]1[/C][C]0.796413[/C][C]0.203587[/C][/ROW]
[ROW][C]46[/C][C]1[/C][C]0.733798[/C][C]0.266202[/C][/ROW]
[ROW][C]47[/C][C]0[/C][C]0.69846[/C][C]-0.69846[/C][/ROW]
[ROW][C]48[/C][C]1[/C][C]0.750912[/C][C]0.249088[/C][/ROW]
[ROW][C]49[/C][C]0[/C][C]0.735208[/C][C]-0.735208[/C][/ROW]
[ROW][C]50[/C][C]1[/C][C]0.69644[/C][C]0.30356[/C][/ROW]
[ROW][C]51[/C][C]0[/C][C]0.704417[/C][C]-0.704417[/C][/ROW]
[ROW][C]52[/C][C]1[/C][C]0.653787[/C][C]0.346213[/C][/ROW]
[ROW][C]53[/C][C]1[/C][C]0.750967[/C][C]0.249033[/C][/ROW]
[ROW][C]54[/C][C]1[/C][C]0.688728[/C][C]0.311272[/C][/ROW]
[ROW][C]55[/C][C]1[/C][C]0.684249[/C][C]0.315751[/C][/ROW]
[ROW][C]56[/C][C]1[/C][C]0.617113[/C][C]0.382887[/C][/ROW]
[ROW][C]57[/C][C]0[/C][C]0.80989[/C][C]-0.80989[/C][/ROW]
[ROW][C]58[/C][C]1[/C][C]0.898058[/C][C]0.101942[/C][/ROW]
[ROW][C]59[/C][C]1[/C][C]0.657013[/C][C]0.342987[/C][/ROW]
[ROW][C]60[/C][C]1[/C][C]0.78436[/C][C]0.21564[/C][/ROW]
[ROW][C]61[/C][C]1[/C][C]0.583173[/C][C]0.416827[/C][/ROW]
[ROW][C]62[/C][C]0[/C][C]0.570511[/C][C]-0.570511[/C][/ROW]
[/TABLE]
Source: https://freestatistics.org/blog/index.php?pk=264147&T=4

Globally Unique Identifier (entire table): ba.freestatistics.org/blog/index.php?pk=264147&T=4

As an alternative you can also use a QR Code:  

The GUIDs for individual cells are displayed in the table below:

Multiple Linear Regression - Actuals, Interpolation, and Residuals
Time or IndexActualsInterpolationForecastResidualsPrediction Error
110.4789740.521026
200.668655-0.668655
310.7811540.218846
410.847330.15267
500.707055-0.707055
600.747686-0.747686
710.7142720.285728
810.7467060.253294
910.7355720.264428
1010.7276820.272318
1100.740783-0.740783
1210.6983230.301677
1300.694036-0.694036
1410.6066630.393337
1510.7923870.207613
1600.518468-0.518468
1710.7223330.277667
1800.672504-0.672504
1910.7057810.294219
2010.6724970.327503
2110.6693120.330688
2210.8468250.153175
2310.6897550.310245
2400.710787-0.710787
2510.6382410.361759
2600.615943-0.615943
2710.6743790.325621
2800.549965-0.549965
2900.703849-0.703849
3000.52574-0.52574
3110.7140540.285946
3210.7757310.224269
3310.6186610.381339
3400.73777-0.73777
3510.7507890.249211
3600.64433-0.64433
3710.7541720.245828
3810.4919780.508022
3910.6192030.380797
4010.6288170.371183
4110.6882420.311758
4210.6908360.309164
4310.7565420.243458
4410.7117190.288281
4510.7964130.203587
4610.7337980.266202
4700.69846-0.69846
4810.7509120.249088
4900.735208-0.735208
5010.696440.30356
5100.704417-0.704417
5210.6537870.346213
5310.7509670.249033
5410.6887280.311272
5510.6842490.315751
5610.6171130.382887
5700.80989-0.80989
5810.8980580.101942
5910.6570130.342987
6010.784360.21564
6110.5831730.416827
6200.570511-0.570511


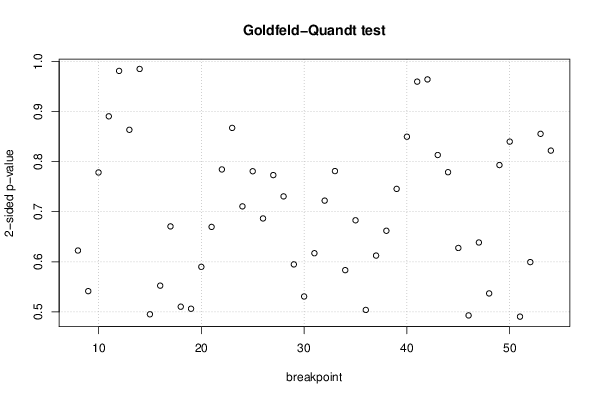
Goldfeld-Quandt test for Heteroskedasticity
p-valuesAlternative Hypothesis
breakpoint indexgreater2-sidedless
80.688750.62250.31125
90.7293030.5413930.270697
100.6108330.7783350.389167
110.5547780.8904440.445222
120.4905470.9810940.509453
130.5682310.8635370.431769
140.507480.9850390.49252
150.7524110.4951770.247589
160.7238370.5523260.276163
170.664660.6706790.33534
180.7448450.5103110.255155
190.7468810.5062380.253119
200.7050470.5899060.294953
210.6651590.6696820.334841
220.6078150.784370.392185
230.5663540.8672920.433646
240.6446650.710670.355335
250.6096060.7807870.390394
260.6567380.6865230.343262
270.6134520.7730970.386548
280.6347080.7305850.365292
290.7026090.5947830.297391
300.7346310.5307390.265369
310.6914530.6170940.308547
320.6389320.7221360.361068
330.6094340.7811320.390566
340.7083510.5832990.291649
350.6585570.6828860.341443
360.7480750.5038510.251925
370.6938060.6123890.306194
380.6690260.6619470.330974
390.6272180.7455630.372782
400.575130.8497390.42487
410.5201550.959690.479845
420.4820910.9641820.517909
430.4065950.813190.593405
440.3894340.7788680.610566
450.3138040.6276080.686196
460.2464560.4929120.753544
470.3192620.6385240.680738
480.2684130.5368260.731587
490.3965760.7931530.603424
500.4199590.8399180.580041
510.7547740.4904510.245226
520.7003190.5993630.299681
530.572240.8555190.42776
540.4109970.8219940.589003

\begin{tabular}{lllllllll}
\hline
Goldfeld-Quandt test for Heteroskedasticity \tabularnewline
p-values & Alternative Hypothesis \tabularnewline
breakpoint index & greater & 2-sided & less \tabularnewline
8 & 0.68875 & 0.6225 & 0.31125 \tabularnewline
9 & 0.729303 & 0.541393 & 0.270697 \tabularnewline
10 & 0.610833 & 0.778335 & 0.389167 \tabularnewline
11 & 0.554778 & 0.890444 & 0.445222 \tabularnewline
12 & 0.490547 & 0.981094 & 0.509453 \tabularnewline
13 & 0.568231 & 0.863537 & 0.431769 \tabularnewline
14 & 0.50748 & 0.985039 & 0.49252 \tabularnewline
15 & 0.752411 & 0.495177 & 0.247589 \tabularnewline
16 & 0.723837 & 0.552326 & 0.276163 \tabularnewline
17 & 0.66466 & 0.670679 & 0.33534 \tabularnewline
18 & 0.744845 & 0.510311 & 0.255155 \tabularnewline
19 & 0.746881 & 0.506238 & 0.253119 \tabularnewline
20 & 0.705047 & 0.589906 & 0.294953 \tabularnewline
21 & 0.665159 & 0.669682 & 0.334841 \tabularnewline
22 & 0.607815 & 0.78437 & 0.392185 \tabularnewline
23 & 0.566354 & 0.867292 & 0.433646 \tabularnewline
24 & 0.644665 & 0.71067 & 0.355335 \tabularnewline
25 & 0.609606 & 0.780787 & 0.390394 \tabularnewline
26 & 0.656738 & 0.686523 & 0.343262 \tabularnewline
27 & 0.613452 & 0.773097 & 0.386548 \tabularnewline
28 & 0.634708 & 0.730585 & 0.365292 \tabularnewline
29 & 0.702609 & 0.594783 & 0.297391 \tabularnewline
30 & 0.734631 & 0.530739 & 0.265369 \tabularnewline
31 & 0.691453 & 0.617094 & 0.308547 \tabularnewline
32 & 0.638932 & 0.722136 & 0.361068 \tabularnewline
33 & 0.609434 & 0.781132 & 0.390566 \tabularnewline
34 & 0.708351 & 0.583299 & 0.291649 \tabularnewline
35 & 0.658557 & 0.682886 & 0.341443 \tabularnewline
36 & 0.748075 & 0.503851 & 0.251925 \tabularnewline
37 & 0.693806 & 0.612389 & 0.306194 \tabularnewline
38 & 0.669026 & 0.661947 & 0.330974 \tabularnewline
39 & 0.627218 & 0.745563 & 0.372782 \tabularnewline
40 & 0.57513 & 0.849739 & 0.42487 \tabularnewline
41 & 0.520155 & 0.95969 & 0.479845 \tabularnewline
42 & 0.482091 & 0.964182 & 0.517909 \tabularnewline
43 & 0.406595 & 0.81319 & 0.593405 \tabularnewline
44 & 0.389434 & 0.778868 & 0.610566 \tabularnewline
45 & 0.313804 & 0.627608 & 0.686196 \tabularnewline
46 & 0.246456 & 0.492912 & 0.753544 \tabularnewline
47 & 0.319262 & 0.638524 & 0.680738 \tabularnewline
48 & 0.268413 & 0.536826 & 0.731587 \tabularnewline
49 & 0.396576 & 0.793153 & 0.603424 \tabularnewline
50 & 0.419959 & 0.839918 & 0.580041 \tabularnewline
51 & 0.754774 & 0.490451 & 0.245226 \tabularnewline
52 & 0.700319 & 0.599363 & 0.299681 \tabularnewline
53 & 0.57224 & 0.855519 & 0.42776 \tabularnewline
54 & 0.410997 & 0.821994 & 0.589003 \tabularnewline
\hline
\end{tabular}
%Source: https://freestatistics.org/blog/index.php?pk=264147&T=5

[TABLE]
[ROW][C]Goldfeld-Quandt test for Heteroskedasticity[/C][/ROW]
[ROW][C]p-values[/C][C]Alternative Hypothesis[/C][/ROW]
[ROW][C]breakpoint index[/C][C]greater[/C][C]2-sided[/C][C]less[/C][/ROW]
[ROW][C]8[/C][C]0.68875[/C][C]0.6225[/C][C]0.31125[/C][/ROW]
[ROW][C]9[/C][C]0.729303[/C][C]0.541393[/C][C]0.270697[/C][/ROW]
[ROW][C]10[/C][C]0.610833[/C][C]0.778335[/C][C]0.389167[/C][/ROW]
[ROW][C]11[/C][C]0.554778[/C][C]0.890444[/C][C]0.445222[/C][/ROW]
[ROW][C]12[/C][C]0.490547[/C][C]0.981094[/C][C]0.509453[/C][/ROW]
[ROW][C]13[/C][C]0.568231[/C][C]0.863537[/C][C]0.431769[/C][/ROW]
[ROW][C]14[/C][C]0.50748[/C][C]0.985039[/C][C]0.49252[/C][/ROW]
[ROW][C]15[/C][C]0.752411[/C][C]0.495177[/C][C]0.247589[/C][/ROW]
[ROW][C]16[/C][C]0.723837[/C][C]0.552326[/C][C]0.276163[/C][/ROW]
[ROW][C]17[/C][C]0.66466[/C][C]0.670679[/C][C]0.33534[/C][/ROW]
[ROW][C]18[/C][C]0.744845[/C][C]0.510311[/C][C]0.255155[/C][/ROW]
[ROW][C]19[/C][C]0.746881[/C][C]0.506238[/C][C]0.253119[/C][/ROW]
[ROW][C]20[/C][C]0.705047[/C][C]0.589906[/C][C]0.294953[/C][/ROW]
[ROW][C]21[/C][C]0.665159[/C][C]0.669682[/C][C]0.334841[/C][/ROW]
[ROW][C]22[/C][C]0.607815[/C][C]0.78437[/C][C]0.392185[/C][/ROW]
[ROW][C]23[/C][C]0.566354[/C][C]0.867292[/C][C]0.433646[/C][/ROW]
[ROW][C]24[/C][C]0.644665[/C][C]0.71067[/C][C]0.355335[/C][/ROW]
[ROW][C]25[/C][C]0.609606[/C][C]0.780787[/C][C]0.390394[/C][/ROW]
[ROW][C]26[/C][C]0.656738[/C][C]0.686523[/C][C]0.343262[/C][/ROW]
[ROW][C]27[/C][C]0.613452[/C][C]0.773097[/C][C]0.386548[/C][/ROW]
[ROW][C]28[/C][C]0.634708[/C][C]0.730585[/C][C]0.365292[/C][/ROW]
[ROW][C]29[/C][C]0.702609[/C][C]0.594783[/C][C]0.297391[/C][/ROW]
[ROW][C]30[/C][C]0.734631[/C][C]0.530739[/C][C]0.265369[/C][/ROW]
[ROW][C]31[/C][C]0.691453[/C][C]0.617094[/C][C]0.308547[/C][/ROW]
[ROW][C]32[/C][C]0.638932[/C][C]0.722136[/C][C]0.361068[/C][/ROW]
[ROW][C]33[/C][C]0.609434[/C][C]0.781132[/C][C]0.390566[/C][/ROW]
[ROW][C]34[/C][C]0.708351[/C][C]0.583299[/C][C]0.291649[/C][/ROW]
[ROW][C]35[/C][C]0.658557[/C][C]0.682886[/C][C]0.341443[/C][/ROW]
[ROW][C]36[/C][C]0.748075[/C][C]0.503851[/C][C]0.251925[/C][/ROW]
[ROW][C]37[/C][C]0.693806[/C][C]0.612389[/C][C]0.306194[/C][/ROW]
[ROW][C]38[/C][C]0.669026[/C][C]0.661947[/C][C]0.330974[/C][/ROW]
[ROW][C]39[/C][C]0.627218[/C][C]0.745563[/C][C]0.372782[/C][/ROW]
[ROW][C]40[/C][C]0.57513[/C][C]0.849739[/C][C]0.42487[/C][/ROW]
[ROW][C]41[/C][C]0.520155[/C][C]0.95969[/C][C]0.479845[/C][/ROW]
[ROW][C]42[/C][C]0.482091[/C][C]0.964182[/C][C]0.517909[/C][/ROW]
[ROW][C]43[/C][C]0.406595[/C][C]0.81319[/C][C]0.593405[/C][/ROW]
[ROW][C]44[/C][C]0.389434[/C][C]0.778868[/C][C]0.610566[/C][/ROW]
[ROW][C]45[/C][C]0.313804[/C][C]0.627608[/C][C]0.686196[/C][/ROW]
[ROW][C]46[/C][C]0.246456[/C][C]0.492912[/C][C]0.753544[/C][/ROW]
[ROW][C]47[/C][C]0.319262[/C][C]0.638524[/C][C]0.680738[/C][/ROW]
[ROW][C]48[/C][C]0.268413[/C][C]0.536826[/C][C]0.731587[/C][/ROW]
[ROW][C]49[/C][C]0.396576[/C][C]0.793153[/C][C]0.603424[/C][/ROW]
[ROW][C]50[/C][C]0.419959[/C][C]0.839918[/C][C]0.580041[/C][/ROW]
[ROW][C]51[/C][C]0.754774[/C][C]0.490451[/C][C]0.245226[/C][/ROW]
[ROW][C]52[/C][C]0.700319[/C][C]0.599363[/C][C]0.299681[/C][/ROW]
[ROW][C]53[/C][C]0.57224[/C][C]0.855519[/C][C]0.42776[/C][/ROW]
[ROW][C]54[/C][C]0.410997[/C][C]0.821994[/C][C]0.589003[/C][/ROW]
[/TABLE]
Source: https://freestatistics.org/blog/index.php?pk=264147&T=5

Globally Unique Identifier (entire table): ba.freestatistics.org/blog/index.php?pk=264147&T=5

As an alternative you can also use a QR Code:  

The GUIDs for individual cells are displayed in the table below:

Goldfeld-Quandt test for Heteroskedasticity
p-valuesAlternative Hypothesis
breakpoint indexgreater2-sidedless
80.688750.62250.31125
90.7293030.5413930.270697
100.6108330.7783350.389167
110.5547780.8904440.445222
120.4905470.9810940.509453
130.5682310.8635370.431769
140.507480.9850390.49252
150.7524110.4951770.247589
160.7238370.5523260.276163
170.664660.6706790.33534
180.7448450.5103110.255155
190.7468810.5062380.253119
200.7050470.5899060.294953
210.6651590.6696820.334841
220.6078150.784370.392185
230.5663540.8672920.433646
240.6446650.710670.355335
250.6096060.7807870.390394
260.6567380.6865230.343262
270.6134520.7730970.386548
280.6347080.7305850.365292
290.7026090.5947830.297391
300.7346310.5307390.265369
310.6914530.6170940.308547
320.6389320.7221360.361068
330.6094340.7811320.390566
340.7083510.5832990.291649
350.6585570.6828860.341443
360.7480750.5038510.251925
370.6938060.6123890.306194
380.6690260.6619470.330974
390.6272180.7455630.372782
400.575130.8497390.42487
410.5201550.959690.479845
420.4820910.9641820.517909
430.4065950.813190.593405
440.3894340.7788680.610566
450.3138040.6276080.686196
460.2464560.4929120.753544
470.3192620.6385240.680738
480.2684130.5368260.731587
490.3965760.7931530.603424
500.4199590.8399180.580041
510.7547740.4904510.245226
520.7003190.5993630.299681
530.572240.8555190.42776
540.4109970.8219940.589003


Meta Analysis of Goldfeld-Quandt test for Heteroskedasticity
Description# significant tests% significant testsOK/NOK
1% type I error level00OK
5% type I error level00OK
10% type I error level00OK

\begin{tabular}{lllllllll}
\hline
Meta Analysis of Goldfeld-Quandt test for Heteroskedasticity \tabularnewline
Description & # significant tests & % significant tests & OK/NOK \tabularnewline
1% type I error level & 0 & 0 & OK \tabularnewline
5% type I error level & 0 & 0 & OK \tabularnewline
10% type I error level & 0 & 0 & OK \tabularnewline
\hline
\end{tabular}
%Source: https://freestatistics.org/blog/index.php?pk=264147&T=6

[TABLE]
[ROW][C]Meta Analysis of Goldfeld-Quandt test for Heteroskedasticity[/C][/ROW]
[ROW][C]Description[/C][C]# significant tests[/C][C]% significant tests[/C][C]OK/NOK[/C][/ROW]
[ROW][C]1% type I error level[/C][C]0[/C][C]0[/C][C]OK[/C][/ROW]
[ROW][C]5% type I error level[/C][C]0[/C][C]0[/C][C]OK[/C][/ROW]
[ROW][C]10% type I error level[/C][C]0[/C][C]0[/C][C]OK[/C][/ROW]
[/TABLE]
Source: https://freestatistics.org/blog/index.php?pk=264147&T=6

Globally Unique Identifier (entire table): ba.freestatistics.org/blog/index.php?pk=264147&T=6

As an alternative you can also use a QR Code:  

The GUIDs for individual cells are displayed in the table below:

Meta Analysis of Goldfeld-Quandt test for Heteroskedasticity
Description# significant tests% significant testsOK/NOK
1% type I error level00OK
5% type I error level00OK
10% type I error level00OK


Parameters (Session):
par1 = 1 ; par2 = Do not include Seasonal Dummies ; par3 = No Linear Trend ;
Parameters (R input):
par1 = 1 ; par2 = Do not include Seasonal Dummies ; par3 = No Linear Trend ;
R code (references can be found in the software module):
library(lattice)
library(lmtest)
n25 <- 25 #minimum number of obs. for Goldfeld-Quandt test
par1 <- as.numeric(par1)
x <- t(y)
k <- length(x[1,])
n <- length(x[,1])
x1 <- cbind(x[,par1], x[,1:k!=par1])
mycolnames <- c(colnames(x)[par1], colnames(x)[1:k!=par1])
colnames(x1) <- mycolnames #colnames(x)[par1]
x <- x1
if (par3 == 'First Differences'){
x2 <- array(0, dim=c(n-1,k), dimnames=list(1:(n-1), paste('(1-B)',colnames(x),sep='')))
for (i in 1:n-1) {
for (j in 1:k) {
x2[i,j] <- x[i+1,j] - x[i,j]
}
}
x <- x2
}
if (par2 == 'Include Monthly Dummies'){
x2 <- array(0, dim=c(n,11), dimnames=list(1:n, paste('M', seq(1:11), sep ='')))
for (i in 1:11){
x2[seq(i,n,12),i] <- 1
}
x <- cbind(x, x2)
}
if (par2 == 'Include Quarterly Dummies'){
x2 <- array(0, dim=c(n,3), dimnames=list(1:n, paste('Q', seq(1:3), sep ='')))
for (i in 1:3){
x2[seq(i,n,4),i] <- 1
}
x <- cbind(x, x2)
}
k <- length(x[1,])
if (par3 == 'Linear Trend'){
x <- cbind(x, c(1:n))
colnames(x)[k+1] <- 't'
}
x
k <- length(x[1,])
df <- as.data.frame(x)
(mylm <- lm(df))
(mysum <- summary(mylm))
if (n > n25) {
kp3 <- k + 3
nmkm3 <- n - k - 3
gqarr <- array(NA, dim=c(nmkm3-kp3+1,3))
numgqtests <- 0
numsignificant1 <- 0
numsignificant5 <- 0
numsignificant10 <- 0
for (mypoint in kp3:nmkm3) {
j <- 0
numgqtests <- numgqtests + 1
for (myalt in c('greater', 'two.sided', 'less')) {
j <- j + 1
gqarr[mypoint-kp3+1,j] <- gqtest(mylm, point=mypoint, alternative=myalt)$p.value
}
if (gqarr[mypoint-kp3+1,2] < 0.01) numsignificant1 <- numsignificant1 + 1
if (gqarr[mypoint-kp3+1,2] < 0.05) numsignificant5 <- numsignificant5 + 1
if (gqarr[mypoint-kp3+1,2] < 0.10) numsignificant10 <- numsignificant10 + 1
}
gqarr
}
bitmap(file='test0.png')
plot(x[,1], type='l', main='Actuals and Interpolation', ylab='value of Actuals and Interpolation (dots)', xlab='time or index')
points(x[,1]-mysum$resid)
grid()
dev.off()
bitmap(file='test1.png')
plot(mysum$resid, type='b', pch=19, main='Residuals', ylab='value of Residuals', xlab='time or index')
grid()
dev.off()
bitmap(file='test2.png')
hist(mysum$resid, main='Residual Histogram', xlab='values of Residuals')
grid()
dev.off()
bitmap(file='test3.png')
densityplot(~mysum$resid,col='black',main='Residual Density Plot', xlab='values of Residuals')
dev.off()
bitmap(file='test4.png')
qqnorm(mysum$resid, main='Residual Normal Q-Q Plot')
qqline(mysum$resid)
grid()
dev.off()
(myerror <- as.ts(mysum$resid))
bitmap(file='test5.png')
dum <- cbind(lag(myerror,k=1),myerror)
dum
dum1 <- dum[2:length(myerror),]
dum1
z <- as.data.frame(dum1)
z
plot(z,main=paste('Residual Lag plot, lowess, and regression line'), ylab='values of Residuals', xlab='lagged values of Residuals')
lines(lowess(z))
abline(lm(z))
grid()
dev.off()
bitmap(file='test6.png')
acf(mysum$resid, lag.max=length(mysum$resid)/2, main='Residual Autocorrelation Function')
grid()
dev.off()
bitmap(file='test7.png')
pacf(mysum$resid, lag.max=length(mysum$resid)/2, main='Residual Partial Autocorrelation Function')
grid()
dev.off()
bitmap(file='test8.png')
opar <- par(mfrow = c(2,2), oma = c(0, 0, 1.1, 0))
plot(mylm, las = 1, sub='Residual Diagnostics')
par(opar)
dev.off()
if (n > n25) {
bitmap(file='test9.png')
plot(kp3:nmkm3,gqarr[,2], main='Goldfeld-Quandt test',ylab='2-sided p-value',xlab='breakpoint')
grid()
dev.off()
}
load(file='createtable')
a<-table.start()
a<-table.row.start(a)
a<-table.element(a, 'Multiple Linear Regression - Estimated Regression Equation', 1, TRUE)
a<-table.row.end(a)
myeq <- colnames(x)[1]
myeq <- paste(myeq, '[t] = ', sep='')
for (i in 1:k){
if (mysum$coefficients[i,1] > 0) myeq <- paste(myeq, '+', '')
myeq <- paste(myeq, signif(mysum$coefficients[i,1],6), sep=' ')
if (rownames(mysum$coefficients)[i] != '(Intercept)') {
myeq <- paste(myeq, rownames(mysum$coefficients)[i], sep='')
if (rownames(mysum$coefficients)[i] != 't') myeq <- paste(myeq, '[t]', sep='')
}
}
myeq <- paste(myeq, ' + e[t]')
a<-table.row.start(a)
a<-table.element(a, myeq)
a<-table.row.end(a)
a<-table.end(a)
table.save(a,file='mytable1.tab')
a<-table.start()
a<-table.row.start(a)
a<-table.element(a,hyperlink('ols1.htm','Multiple Linear Regression - Ordinary Least Squares',''), 6, TRUE)
a<-table.row.end(a)
a<-table.row.start(a)
a<-table.element(a,'Variable',header=TRUE)
a<-table.element(a,'Parameter',header=TRUE)
a<-table.element(a,'S.D.',header=TRUE)
a<-table.element(a,'T-STAT
H0: parameter = 0',header=TRUE)
a<-table.element(a,'2-tail p-value',header=TRUE)
a<-table.element(a,'1-tail p-value',header=TRUE)
a<-table.row.end(a)
for (i in 1:k){
a<-table.row.start(a)
a<-table.element(a,rownames(mysum$coefficients)[i],header=TRUE)
a<-table.element(a,signif(mysum$coefficients[i,1],6))
a<-table.element(a, signif(mysum$coefficients[i,2],6))
a<-table.element(a, signif(mysum$coefficients[i,3],4))
a<-table.element(a, signif(mysum$coefficients[i,4],6))
a<-table.element(a, signif(mysum$coefficients[i,4]/2,6))
a<-table.row.end(a)
}
a<-table.end(a)
table.save(a,file='mytable2.tab')
a<-table.start()
a<-table.row.start(a)
a<-table.element(a, 'Multiple Linear Regression - Regression Statistics', 2, TRUE)
a<-table.row.end(a)
a<-table.row.start(a)
a<-table.element(a, 'Multiple R',1,TRUE)
a<-table.element(a, signif(sqrt(mysum$r.squared),6))
a<-table.row.end(a)
a<-table.row.start(a)
a<-table.element(a, 'R-squared',1,TRUE)
a<-table.element(a, signif(mysum$r.squared,6))
a<-table.row.end(a)
a<-table.row.start(a)
a<-table.element(a, 'Adjusted R-squared',1,TRUE)
a<-table.element(a, signif(mysum$adj.r.squared,6))
a<-table.row.end(a)
a<-table.row.start(a)
a<-table.element(a, 'F-TEST (value)',1,TRUE)
a<-table.element(a, signif(mysum$fstatistic[1],6))
a<-table.row.end(a)
a<-table.row.start(a)
a<-table.element(a, 'F-TEST (DF numerator)',1,TRUE)
a<-table.element(a, signif(mysum$fstatistic[2],6))
a<-table.row.end(a)
a<-table.row.start(a)
a<-table.element(a, 'F-TEST (DF denominator)',1,TRUE)
a<-table.element(a, signif(mysum$fstatistic[3],6))
a<-table.row.end(a)
a<-table.row.start(a)
a<-table.element(a, 'p-value',1,TRUE)
a<-table.element(a, signif(1-pf(mysum$fstatistic[1],mysum$fstatistic[2],mysum$fstatistic[3]),6))
a<-table.row.end(a)
a<-table.row.start(a)
a<-table.element(a, 'Multiple Linear Regression - Residual Statistics', 2, TRUE)
a<-table.row.end(a)
a<-table.row.start(a)
a<-table.element(a, 'Residual Standard Deviation',1,TRUE)
a<-table.element(a, signif(mysum$sigma,6))
a<-table.row.end(a)
a<-table.row.start(a)
a<-table.element(a, 'Sum Squared Residuals',1,TRUE)
a<-table.element(a, signif(sum(myerror*myerror),6))
a<-table.row.end(a)
a<-table.end(a)
table.save(a,file='mytable3.tab')
a<-table.start()
a<-table.row.start(a)
a<-table.element(a, 'Multiple Linear Regression - Actuals, Interpolation, and Residuals', 4, TRUE)
a<-table.row.end(a)
a<-table.row.start(a)
a<-table.element(a, 'Time or Index', 1, TRUE)
a<-table.element(a, 'Actuals', 1, TRUE)
a<-table.element(a, 'Interpolation
Forecast', 1, TRUE)
a<-table.element(a, 'Residuals
Prediction Error', 1, TRUE)
a<-table.row.end(a)
for (i in 1:n) {
a<-table.row.start(a)
a<-table.element(a,i, 1, TRUE)
a<-table.element(a,signif(x[i],6))
a<-table.element(a,signif(x[i]-mysum$resid[i],6))
a<-table.element(a,signif(mysum$resid[i],6))
a<-table.row.end(a)
}
a<-table.end(a)
table.save(a,file='mytable4.tab')
if (n > n25) {
a<-table.start()
a<-table.row.start(a)
a<-table.element(a,'Goldfeld-Quandt test for Heteroskedasticity',4,TRUE)
a<-table.row.end(a)
a<-table.row.start(a)
a<-table.element(a,'p-values',header=TRUE)
a<-table.element(a,'Alternative Hypothesis',3,header=TRUE)
a<-table.row.end(a)
a<-table.row.start(a)
a<-table.element(a,'breakpoint index',header=TRUE)
a<-table.element(a,'greater',header=TRUE)
a<-table.element(a,'2-sided',header=TRUE)
a<-table.element(a,'less',header=TRUE)
a<-table.row.end(a)
for (mypoint in kp3:nmkm3) {
a<-table.row.start(a)
a<-table.element(a,mypoint,header=TRUE)
a<-table.element(a,signif(gqarr[mypoint-kp3+1,1],6))
a<-table.element(a,signif(gqarr[mypoint-kp3+1,2],6))
a<-table.element(a,signif(gqarr[mypoint-kp3+1,3],6))
a<-table.row.end(a)
}
a<-table.end(a)
table.save(a,file='mytable5.tab')
a<-table.start()
a<-table.row.start(a)
a<-table.element(a,'Meta Analysis of Goldfeld-Quandt test for Heteroskedasticity',4,TRUE)
a<-table.row.end(a)
a<-table.row.start(a)
a<-table.element(a,'Description',header=TRUE)
a<-table.element(a,'# significant tests',header=TRUE)
a<-table.element(a,'% significant tests',header=TRUE)
a<-table.element(a,'OK/NOK',header=TRUE)
a<-table.row.end(a)
a<-table.row.start(a)
a<-table.element(a,'1% type I error level',header=TRUE)
a<-table.element(a,signif(numsignificant1,6))
a<-table.element(a,signif(numsignificant1/numgqtests,6))
if (numsignificant1/numgqtests < 0.01) dum <- 'OK' else dum <- 'NOK'
a<-table.element(a,dum)
a<-table.row.end(a)
a<-table.row.start(a)
a<-table.element(a,'5% type I error level',header=TRUE)
a<-table.element(a,signif(numsignificant5,6))
a<-table.element(a,signif(numsignificant5/numgqtests,6))
if (numsignificant5/numgqtests < 0.05) dum <- 'OK' else dum <- 'NOK'
a<-table.element(a,dum)
a<-table.row.end(a)
a<-table.row.start(a)
a<-table.element(a,'10% type I error level',header=TRUE)
a<-table.element(a,signif(numsignificant10,6))
a<-table.element(a,signif(numsignificant10/numgqtests,6))
if (numsignificant10/numgqtests < 0.1) dum <- 'OK' else dum <- 'NOK'
a<-table.element(a,dum)
a<-table.row.end(a)
a<-table.end(a)
table.save(a,file='mytable6.tab')
}