Free Statistics
of Irreproducible Research!
Description of Statistical Computation | |||||||||||||||||||||||||||||||||
|---|---|---|---|---|---|---|---|---|---|---|---|---|---|---|---|---|---|---|---|---|---|---|---|---|---|---|---|---|---|---|---|---|---|
| Author's title | |||||||||||||||||||||||||||||||||
| Author | *The author of this computation has been verified* | ||||||||||||||||||||||||||||||||
| R Software Module | rwasp_meanversusmedian.wasp | ||||||||||||||||||||||||||||||||
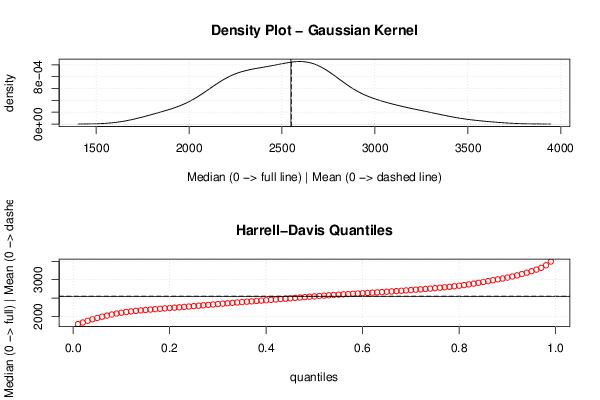
| Title produced by software | Mean versus Median | ||||||||||||||||||||||||||||||||
| Date of computation | Mon, 08 Dec 2014 16:44:07 +0000 | ||||||||||||||||||||||||||||||||
| Cite this page as follows | Statistical Computations at FreeStatistics.org, Office for Research Development and Education, URL https://freestatistics.org/blog/index.php?v=date/2014/Dec/08/t14180571277mm4m66xzehvdvf.htm/, Retrieved Sun, 19 May 2024 08:53:16 +0000 | ||||||||||||||||||||||||||||||||
| Statistical Computations at FreeStatistics.org, Office for Research Development and Education, URL https://freestatistics.org/blog/index.php?pk=264078, Retrieved Sun, 19 May 2024 08:53:16 +0000 | |||||||||||||||||||||||||||||||||
| QR Codes: | |||||||||||||||||||||||||||||||||
|
| |||||||||||||||||||||||||||||||||
| Original text written by user: | |||||||||||||||||||||||||||||||||
| IsPrivate? | No (this computation is public) | ||||||||||||||||||||||||||||||||
| User-defined keywords | |||||||||||||||||||||||||||||||||
| Estimated Impact | 85 | ||||||||||||||||||||||||||||||||
Tree of Dependent Computations | |||||||||||||||||||||||||||||||||
| Family? (F = Feedback message, R = changed R code, M = changed R Module, P = changed Parameters, D = changed Data) | |||||||||||||||||||||||||||||||||
| - [Mean versus Median] [] [2014-12-08 16:25:59] [78252ca1523d3477f114bddbfa59edb4] - R D [Mean versus Median] [] [2014-12-08 16:44:07] [54099b55f731ed0aca9a713a2b2a06c3] [Current] | |||||||||||||||||||||||||||||||||
| Feedback Forum | |||||||||||||||||||||||||||||||||
Post a new message | |||||||||||||||||||||||||||||||||
Dataset | |||||||||||||||||||||||||||||||||
| Dataseries X: | |||||||||||||||||||||||||||||||||
2132,00 1964,00 2209,00 1965,00 2631,00 2583,00 2714,00 2248,00 2364,00 3042,00 2316,00 2735,00 2493,00 2136,00 2467,00 2414,00 2556,00 2768,00 2998,00 2573,00 3005,00 3469,00 2540,00 3187,00 2689,00 2154,00 3065,00 2397,00 2787,00 3579,00 2915,00 3025,00 3245,00 3328,00 2840,00 3342,00 2261,00 2590,00 2624,00 1860,00 2577,00 2646,00 2639,00 2807,00 2350,00 3053,00 2203,00 2471,00 1967,00 2473,00 2397,00 1904,00 2732,00 2297,00 2734,00 2719,00 2296,00 3243,00 2166,00 2261,00 2408,00 2536,00 2324,00 2178,00 2803,00 2604,00 2782,00 2656,00 2801,00 3122,00 2393,00 2233,00 2451,00 2596,00 2467,00 2210,00 2948,00 2507,00 3019,00 2401,00 2818,00 3305,00 2101,00 2582,00 2407,00 2416,00 2463,00 2228,00 2616,00 2934,00 2668,00 2808,00 2664,00 3112,00 2321,00 2718,00 2297,00 2534,00 2647,00 2064,00 2642,00 2702,00 2348,00 2734,00 2709,00 3206,00 2214,00 2531,00 2119,00 2369,00 2682,00 1840,00 2622,00 2570,00 2447,00 2871,00 2485,00 2957,00 2102,00 2250,00 2051,00 2260,00 2327,00 1781,00 2631,00 2180,00 2150,00 2837,00 1976,00 2836,00 2203,00 1770,00 | |||||||||||||||||||||||||||||||||
Tables (Output of Computation) | |||||||||||||||||||||||||||||||||
| |||||||||||||||||||||||||||||||||
Figures (Output of Computation) | |||||||||||||||||||||||||||||||||
Input Parameters & R Code | |||||||||||||||||||||||||||||||||
| Parameters (Session): | |||||||||||||||||||||||||||||||||
| Parameters (R input): | |||||||||||||||||||||||||||||||||
| R code (references can be found in the software module): | |||||||||||||||||||||||||||||||||
library(Hmisc) | |||||||||||||||||||||||||||||||||