Free Statistics

of Irreproducible Research!

Author's title

Author*The author of this computation has been verified*
R Software Modulerwasp_multipleregression.wasp
Title produced by softwareMultiple Regression
Date of computationMon, 08 Dec 2014 11:05:34 +0000
Cite this page as followsStatistical Computations at FreeStatistics.org, Office for Research Development and Education, URL https://freestatistics.org/blog/index.php?v=date/2014/Dec/08/t141803683076zlzb9l60i8rvx.htm/, Retrieved Sun, 19 May 2024 10:21:17 +0000
Statistical Computations at FreeStatistics.org, Office for Research Development and Education, URL https://freestatistics.org/blog/index.php?pk=263933, Retrieved Sun, 19 May 2024 10:21:17 +0000
QR Codes:

Original text written by user:
IsPrivate?No (this computation is public)
User-defined keywords
Estimated Impact119
Family? (F = Feedback message, R = changed R code, M = changed R Module, P = changed Parameters, D = changed Data)
-       [Multiple Regression] [paper] [2014-12-08 11:05:34] [58179e1d3a5a39b9daf58e365d8a3352] [Current]
Feedback Forum

Post a new message
Dataseries X:
149 7.5 1.8 2.1 1.5 12.9
148 6.5 2.2 2 2.1 12.8
158 1 2.3 2.1 1.9 7.4
128 1 2.1 2 1.6 6.7
224 5.5 2.7 2.3 2.1 12.6
159 8.5 2.1 2.1 2.1 14.8
105 6.5 2.4 2.1 2.2 13.3
159 4.5 2.9 2.2 1.5 11.1
167 2 2.2 2.1 1.9 8.2
165 5 2.1 2.1 2.2 11.4
159 0.5 2.2 2.1 1.6 6.4
176 5 2.7 2.3 1.9 12
54 2.5 1.9 1.8 0.1 6.3
91 5 2 2 2.2 11.3
163 5.5 2.5 2.2 1.8 11.9
124 3.5 2.2 2 1.6 9.3
121 4 1.9 2 2.1 10
148 6.5 3.5 2.2 1.6 13.8
221 4.5 2.1 2.2 1.9 10.8
149 5.5 2.3 2.1 1.8 11.7
244 4 2.2 2.3 2.4 10.9
148 7.5 3.5 2.7 2.4 16.1
150 4 1.9 2 1.9 9.9
153 5.5 1.9 2 2.1 11.5
94 2.5 1.9 1.9 1.9 8.3
156 5.5 2.1 2 2.1 11.7
132 3.5 2 2 1.5 9
105 4.5 2.3 2 2.1 10.8
151 4.5 1.8 2 2.1 10.4
131 6 2.4 2.2 2.1 12.7
157 5 2.3 2.1 2.4 11.8
162 6.5 2.3 2.1 2.1 13
163 5 1.8 2 1.9 10.8
59 6 1.9 1.9 2.4 12.3
187 4.5 2.6 2.2 2.1 11.3
116 5 2.1 2.2 2.4 11.6
148 5 1.8 2 2.1 10.9
155 6.5 1.9 2.2 1.5 12.1
125 7 2.4 2 1.9 13.3
116 4.5 1.9 1.9 1.8 10.1
138 8.5 2.1 2 1.6 14.3
164 3.5 2.1 2.1 1.5 9.3
162 6 2.4 2 2.1 12.5
99 1.5 1.8 1.9 2.4 7.6
186 3.5 2.1 2.1 1.5 9.2
188 7.5 2.7 2.2 2.1 14.5
177 5 2.9 2.2 2.1 12.3
139 6.5 2.1 2 1.9 12.6
162 6.5 2.3 2.1 2.1 13
108 6.5 2.2 2.1 1.8 12.6
159 7 2 2.1 2.1 13.2
110 1.5 2.1 2 2.1 7.7
96 4 2.1 2.1 2.2 10.5
87 4.5 2 2.1 2.2 10.9
97 0 1.7 1 1.6 4.3
127 3.5 2.2 2.2 2.4 10.3
74 4.5 2.4 2 2.4 11.4
114 0 1.8 2 1.8 5.6
95 3 1.9 2 1.9 8.8
121 3.5 1.7 2 1.8 9
130 3 2.1 2.2 2.2 9.6
52 1 1.7 1.8 1.9 6.4
118 5.5 1.9 2.1 2.1 11.6


Summary of computational transaction
Raw Inputview raw input (R code)
Raw Outputview raw output of R engine
Computing time5 seconds
R Server'George Udny Yule' @ yule.wessa.net

\begin{tabular}{lllllllll}
\hline
Summary of computational transaction \tabularnewline
Raw Input & view raw input (R code)  \tabularnewline
Raw Output & view raw output of R engine  \tabularnewline
Computing time & 5 seconds \tabularnewline
R Server & 'George Udny Yule' @ yule.wessa.net \tabularnewline
\hline
\end{tabular}
%Source: https://freestatistics.org/blog/index.php?pk=263933&T=0

[TABLE]
[ROW][C]Summary of computational transaction[/C][/ROW]
[ROW][C]Raw Input[/C][C]view raw input (R code) [/C][/ROW]
[ROW][C]Raw Output[/C][C]view raw output of R engine [/C][/ROW]
[ROW][C]Computing time[/C][C]5 seconds[/C][/ROW]
[ROW][C]R Server[/C][C]'George Udny Yule' @ yule.wessa.net[/C][/ROW]
[/TABLE]
Source: https://freestatistics.org/blog/index.php?pk=263933&T=0

Globally Unique Identifier (entire table): ba.freestatistics.org/blog/index.php?pk=263933&T=0

As an alternative you can also use a QR Code:  

The GUIDs for individual cells are displayed in the table below:

Summary of computational transaction
Raw Inputview raw input (R code)
Raw Outputview raw output of R engine
Computing time5 seconds
R Server'George Udny Yule' @ yule.wessa.net


Multiple Linear Regression - Estimated Regression Equation
TOT[t] = + 0.023147 -0.000175379LFM[t] + 1.00081Ex[t] + 0.987089PR[t] + 1.01512PE[t] + 1.00772PA[t] + e[t]

\begin{tabular}{lllllllll}
\hline
Multiple Linear Regression - Estimated Regression Equation \tabularnewline
TOT[t] =  +  0.023147 -0.000175379LFM[t] +  1.00081Ex[t] +  0.987089PR[t] +  1.01512PE[t] +  1.00772PA[t]  + e[t] \tabularnewline
\hline
\end{tabular}
%Source: https://freestatistics.org/blog/index.php?pk=263933&T=1

[TABLE]
[ROW][C]Multiple Linear Regression - Estimated Regression Equation[/C][/ROW]
[ROW][C]TOT[t] =  +  0.023147 -0.000175379LFM[t] +  1.00081Ex[t] +  0.987089PR[t] +  1.01512PE[t] +  1.00772PA[t]  + e[t][/C][/ROW]
[/TABLE]
Source: https://freestatistics.org/blog/index.php?pk=263933&T=1

Globally Unique Identifier (entire table): ba.freestatistics.org/blog/index.php?pk=263933&T=1

As an alternative you can also use a QR Code:  

The GUIDs for individual cells are displayed in the table below:

Multiple Linear Regression - Estimated Regression Equation
TOT[t] = + 0.023147 -0.000175379LFM[t] + 1.00081Ex[t] + 0.987089PR[t] + 1.01512PE[t] + 1.00772PA[t] + e[t]


Multiple Linear Regression - Ordinary Least Squares
VariableParameterS.D.T-STATH0: parameter = 02-tail p-value1-tail p-value
(Intercept)0.0231470.08240720.28090.7798150.389908
LFM-0.0001753790.000217168-0.80760.4226940.211347
Ex1.000810.00396506252.41.36113e-886.80563e-89
PR0.9870890.024664940.022.03806e-431.01903e-43
PE1.015120.0534352192.48243e-261.24122e-26
PA1.007720.020938548.137.45259e-483.72629e-48

\begin{tabular}{lllllllll}
\hline
Multiple Linear Regression - Ordinary Least Squares \tabularnewline
Variable & Parameter & S.D. & T-STATH0: parameter = 0 & 2-tail p-value & 1-tail p-value \tabularnewline
(Intercept) & 0.023147 & 0.0824072 & 0.2809 & 0.779815 & 0.389908 \tabularnewline
LFM & -0.000175379 & 0.000217168 & -0.8076 & 0.422694 & 0.211347 \tabularnewline
Ex & 1.00081 & 0.00396506 & 252.4 & 1.36113e-88 & 6.80563e-89 \tabularnewline
PR & 0.987089 & 0.0246649 & 40.02 & 2.03806e-43 & 1.01903e-43 \tabularnewline
PE & 1.01512 & 0.0534352 & 19 & 2.48243e-26 & 1.24122e-26 \tabularnewline
PA & 1.00772 & 0.0209385 & 48.13 & 7.45259e-48 & 3.72629e-48 \tabularnewline
\hline
\end{tabular}
%Source: https://freestatistics.org/blog/index.php?pk=263933&T=2

[TABLE]
[ROW][C]Multiple Linear Regression - Ordinary Least Squares[/C][/ROW]
[ROW][C]Variable[/C][C]Parameter[/C][C]S.D.[/C][C]T-STATH0: parameter = 0[/C][C]2-tail p-value[/C][C]1-tail p-value[/C][/ROW]
[ROW][C](Intercept)[/C][C]0.023147[/C][C]0.0824072[/C][C]0.2809[/C][C]0.779815[/C][C]0.389908[/C][/ROW]
[ROW][C]LFM[/C][C]-0.000175379[/C][C]0.000217168[/C][C]-0.8076[/C][C]0.422694[/C][C]0.211347[/C][/ROW]
[ROW][C]Ex[/C][C]1.00081[/C][C]0.00396506[/C][C]252.4[/C][C]1.36113e-88[/C][C]6.80563e-89[/C][/ROW]
[ROW][C]PR[/C][C]0.987089[/C][C]0.0246649[/C][C]40.02[/C][C]2.03806e-43[/C][C]1.01903e-43[/C][/ROW]
[ROW][C]PE[/C][C]1.01512[/C][C]0.0534352[/C][C]19[/C][C]2.48243e-26[/C][C]1.24122e-26[/C][/ROW]
[ROW][C]PA[/C][C]1.00772[/C][C]0.0209385[/C][C]48.13[/C][C]7.45259e-48[/C][C]3.72629e-48[/C][/ROW]
[/TABLE]
Source: https://freestatistics.org/blog/index.php?pk=263933&T=2

Globally Unique Identifier (entire table): ba.freestatistics.org/blog/index.php?pk=263933&T=2

As an alternative you can also use a QR Code:  

The GUIDs for individual cells are displayed in the table below:

Multiple Linear Regression - Ordinary Least Squares
VariableParameterS.D.T-STATH0: parameter = 02-tail p-value1-tail p-value
(Intercept)0.0231470.08240720.28090.7798150.389908
LFM-0.0001753790.000217168-0.80760.4226940.211347
Ex1.000810.00396506252.41.36113e-886.80563e-89
PR0.9870890.024664940.022.03806e-431.01903e-43
PE1.015120.0534352192.48243e-261.24122e-26
PA1.007720.020938548.137.45259e-483.72629e-48


Multiple Linear Regression - Regression Statistics
Multiple R0.999749
R-squared0.999498
Adjusted R-squared0.999454
F-TEST (value)22716.5
F-TEST (DF numerator)5
F-TEST (DF denominator)57
p-value0
Multiple Linear Regression - Residual Statistics
Residual Standard Deviation0.0560555
Sum Squared Residuals0.179106

\begin{tabular}{lllllllll}
\hline
Multiple Linear Regression - Regression Statistics \tabularnewline
Multiple R & 0.999749 \tabularnewline
R-squared & 0.999498 \tabularnewline
Adjusted R-squared & 0.999454 \tabularnewline
F-TEST (value) & 22716.5 \tabularnewline
F-TEST (DF numerator) & 5 \tabularnewline
F-TEST (DF denominator) & 57 \tabularnewline
p-value & 0 \tabularnewline
Multiple Linear Regression - Residual Statistics \tabularnewline
Residual Standard Deviation & 0.0560555 \tabularnewline
Sum Squared Residuals & 0.179106 \tabularnewline
\hline
\end{tabular}
%Source: https://freestatistics.org/blog/index.php?pk=263933&T=3

[TABLE]
[ROW][C]Multiple Linear Regression - Regression Statistics[/C][/ROW]
[ROW][C]Multiple R[/C][C]0.999749[/C][/ROW]
[ROW][C]R-squared[/C][C]0.999498[/C][/ROW]
[ROW][C]Adjusted R-squared[/C][C]0.999454[/C][/ROW]
[ROW][C]F-TEST (value)[/C][C]22716.5[/C][/ROW]
[ROW][C]F-TEST (DF numerator)[/C][C]5[/C][/ROW]
[ROW][C]F-TEST (DF denominator)[/C][C]57[/C][/ROW]
[ROW][C]p-value[/C][C]0[/C][/ROW]
[ROW][C]Multiple Linear Regression - Residual Statistics[/C][/ROW]
[ROW][C]Residual Standard Deviation[/C][C]0.0560555[/C][/ROW]
[ROW][C]Sum Squared Residuals[/C][C]0.179106[/C][/ROW]
[/TABLE]
Source: https://freestatistics.org/blog/index.php?pk=263933&T=3

Globally Unique Identifier (entire table): ba.freestatistics.org/blog/index.php?pk=263933&T=3

As an alternative you can also use a QR Code:  

The GUIDs for individual cells are displayed in the table below:

Multiple Linear Regression - Regression Statistics
Multiple R0.999749
R-squared0.999498
Adjusted R-squared0.999454
F-TEST (value)22716.5
F-TEST (DF numerator)5
F-TEST (DF denominator)57
p-value0
Multiple Linear Regression - Residual Statistics
Residual Standard Deviation0.0560555
Sum Squared Residuals0.179106


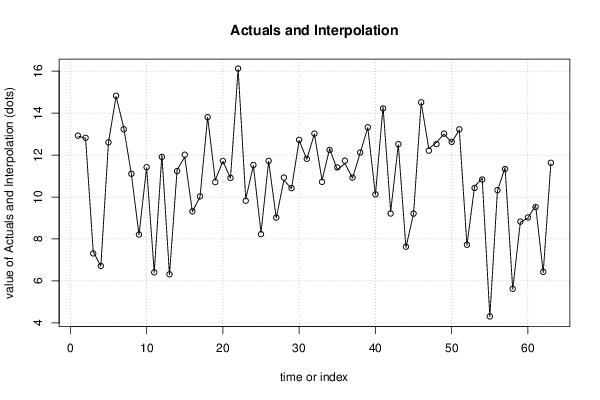
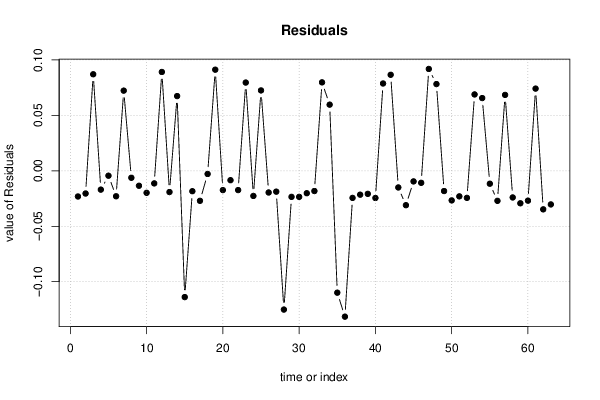
Multiple Linear Regression - Actuals, Interpolation, and Residuals
Time or IndexActualsInterpolationForecastResidualsPrediction Error
112.912.9232-0.0231529
212.812.8205-0.0204756
37.47.312960.0870394
46.76.71698-0.016977
512.612.6044-0.00441991
614.814.823-0.0229633
713.313.22770.0722817
811.111.1063-0.00628825
98.28.21348-0.0134802
1011.411.4199-0.0198582
116.46.41136-0.0113575
121211.91090.0891089
136.36.31915-0.0191482
1411.311.23260.0673845
1511.912.0139-0.113873
169.39.31841-0.018405
171010.0271-0.0270665
1813.813.8029-0.00285683
1910.810.70880.0911699
2011.711.7174-0.0173988
2110.910.9085-0.00847229
2216.116.1174-0.0173967
239.99.820440.079563
2411.511.5227-0.0226649
258.38.227540.0724641
2611.711.7196-0.0195566
2799.01881-0.0188124
2810.810.9251-0.125112
2910.410.4235-0.0234997
3012.712.7235-0.023495
3111.811.8202-0.0202226
321313.0182-0.018241
3310.810.72030.0797448
3412.312.24040.0596426
3511.311.4099-0.109881
3611.611.7315-0.131507
3710.910.9244-0.0244293
3812.112.1215-0.0215143
3913.313.3208-0.0207872
4010.110.1245-0.0245199
4114.314.22130.0787242
429.39.213420.086579
4312.512.515-0.0150347
447.67.631-0.0310018
459.29.20956-0.00956265
4614.514.5108-0.0108358
4712.312.20820.0918347
4812.612.52180.0781984
491313.0182-0.018241
5012.612.6267-0.0266874
5113.213.223-0.0230438
527.77.7244-0.024396
5310.510.43120.0688476
5410.910.83440.0655746
554.34.31165-0.011653
5610.310.3271-0.0270763
5711.411.33160.0684273
585.65.62404-0.024042
598.88.82928-0.0292759
6099.02693-0.0269299
619.69.525890.0741057
626.46.43476-0.0347617
6311.611.6303-0.0303149

\begin{tabular}{lllllllll}
\hline
Multiple Linear Regression - Actuals, Interpolation, and Residuals \tabularnewline
Time or Index & Actuals & InterpolationForecast & ResidualsPrediction Error \tabularnewline
1 & 12.9 & 12.9232 & -0.0231529 \tabularnewline
2 & 12.8 & 12.8205 & -0.0204756 \tabularnewline
3 & 7.4 & 7.31296 & 0.0870394 \tabularnewline
4 & 6.7 & 6.71698 & -0.016977 \tabularnewline
5 & 12.6 & 12.6044 & -0.00441991 \tabularnewline
6 & 14.8 & 14.823 & -0.0229633 \tabularnewline
7 & 13.3 & 13.2277 & 0.0722817 \tabularnewline
8 & 11.1 & 11.1063 & -0.00628825 \tabularnewline
9 & 8.2 & 8.21348 & -0.0134802 \tabularnewline
10 & 11.4 & 11.4199 & -0.0198582 \tabularnewline
11 & 6.4 & 6.41136 & -0.0113575 \tabularnewline
12 & 12 & 11.9109 & 0.0891089 \tabularnewline
13 & 6.3 & 6.31915 & -0.0191482 \tabularnewline
14 & 11.3 & 11.2326 & 0.0673845 \tabularnewline
15 & 11.9 & 12.0139 & -0.113873 \tabularnewline
16 & 9.3 & 9.31841 & -0.018405 \tabularnewline
17 & 10 & 10.0271 & -0.0270665 \tabularnewline
18 & 13.8 & 13.8029 & -0.00285683 \tabularnewline
19 & 10.8 & 10.7088 & 0.0911699 \tabularnewline
20 & 11.7 & 11.7174 & -0.0173988 \tabularnewline
21 & 10.9 & 10.9085 & -0.00847229 \tabularnewline
22 & 16.1 & 16.1174 & -0.0173967 \tabularnewline
23 & 9.9 & 9.82044 & 0.079563 \tabularnewline
24 & 11.5 & 11.5227 & -0.0226649 \tabularnewline
25 & 8.3 & 8.22754 & 0.0724641 \tabularnewline
26 & 11.7 & 11.7196 & -0.0195566 \tabularnewline
27 & 9 & 9.01881 & -0.0188124 \tabularnewline
28 & 10.8 & 10.9251 & -0.125112 \tabularnewline
29 & 10.4 & 10.4235 & -0.0234997 \tabularnewline
30 & 12.7 & 12.7235 & -0.023495 \tabularnewline
31 & 11.8 & 11.8202 & -0.0202226 \tabularnewline
32 & 13 & 13.0182 & -0.018241 \tabularnewline
33 & 10.8 & 10.7203 & 0.0797448 \tabularnewline
34 & 12.3 & 12.2404 & 0.0596426 \tabularnewline
35 & 11.3 & 11.4099 & -0.109881 \tabularnewline
36 & 11.6 & 11.7315 & -0.131507 \tabularnewline
37 & 10.9 & 10.9244 & -0.0244293 \tabularnewline
38 & 12.1 & 12.1215 & -0.0215143 \tabularnewline
39 & 13.3 & 13.3208 & -0.0207872 \tabularnewline
40 & 10.1 & 10.1245 & -0.0245199 \tabularnewline
41 & 14.3 & 14.2213 & 0.0787242 \tabularnewline
42 & 9.3 & 9.21342 & 0.086579 \tabularnewline
43 & 12.5 & 12.515 & -0.0150347 \tabularnewline
44 & 7.6 & 7.631 & -0.0310018 \tabularnewline
45 & 9.2 & 9.20956 & -0.00956265 \tabularnewline
46 & 14.5 & 14.5108 & -0.0108358 \tabularnewline
47 & 12.3 & 12.2082 & 0.0918347 \tabularnewline
48 & 12.6 & 12.5218 & 0.0781984 \tabularnewline
49 & 13 & 13.0182 & -0.018241 \tabularnewline
50 & 12.6 & 12.6267 & -0.0266874 \tabularnewline
51 & 13.2 & 13.223 & -0.0230438 \tabularnewline
52 & 7.7 & 7.7244 & -0.024396 \tabularnewline
53 & 10.5 & 10.4312 & 0.0688476 \tabularnewline
54 & 10.9 & 10.8344 & 0.0655746 \tabularnewline
55 & 4.3 & 4.31165 & -0.011653 \tabularnewline
56 & 10.3 & 10.3271 & -0.0270763 \tabularnewline
57 & 11.4 & 11.3316 & 0.0684273 \tabularnewline
58 & 5.6 & 5.62404 & -0.024042 \tabularnewline
59 & 8.8 & 8.82928 & -0.0292759 \tabularnewline
60 & 9 & 9.02693 & -0.0269299 \tabularnewline
61 & 9.6 & 9.52589 & 0.0741057 \tabularnewline
62 & 6.4 & 6.43476 & -0.0347617 \tabularnewline
63 & 11.6 & 11.6303 & -0.0303149 \tabularnewline
\hline
\end{tabular}
%Source: https://freestatistics.org/blog/index.php?pk=263933&T=4

[TABLE]
[ROW][C]Multiple Linear Regression - Actuals, Interpolation, and Residuals[/C][/ROW]
[ROW][C]Time or Index[/C][C]Actuals[/C][C]InterpolationForecast[/C][C]ResidualsPrediction Error[/C][/ROW]
[ROW][C]1[/C][C]12.9[/C][C]12.9232[/C][C]-0.0231529[/C][/ROW]
[ROW][C]2[/C][C]12.8[/C][C]12.8205[/C][C]-0.0204756[/C][/ROW]
[ROW][C]3[/C][C]7.4[/C][C]7.31296[/C][C]0.0870394[/C][/ROW]
[ROW][C]4[/C][C]6.7[/C][C]6.71698[/C][C]-0.016977[/C][/ROW]
[ROW][C]5[/C][C]12.6[/C][C]12.6044[/C][C]-0.00441991[/C][/ROW]
[ROW][C]6[/C][C]14.8[/C][C]14.823[/C][C]-0.0229633[/C][/ROW]
[ROW][C]7[/C][C]13.3[/C][C]13.2277[/C][C]0.0722817[/C][/ROW]
[ROW][C]8[/C][C]11.1[/C][C]11.1063[/C][C]-0.00628825[/C][/ROW]
[ROW][C]9[/C][C]8.2[/C][C]8.21348[/C][C]-0.0134802[/C][/ROW]
[ROW][C]10[/C][C]11.4[/C][C]11.4199[/C][C]-0.0198582[/C][/ROW]
[ROW][C]11[/C][C]6.4[/C][C]6.41136[/C][C]-0.0113575[/C][/ROW]
[ROW][C]12[/C][C]12[/C][C]11.9109[/C][C]0.0891089[/C][/ROW]
[ROW][C]13[/C][C]6.3[/C][C]6.31915[/C][C]-0.0191482[/C][/ROW]
[ROW][C]14[/C][C]11.3[/C][C]11.2326[/C][C]0.0673845[/C][/ROW]
[ROW][C]15[/C][C]11.9[/C][C]12.0139[/C][C]-0.113873[/C][/ROW]
[ROW][C]16[/C][C]9.3[/C][C]9.31841[/C][C]-0.018405[/C][/ROW]
[ROW][C]17[/C][C]10[/C][C]10.0271[/C][C]-0.0270665[/C][/ROW]
[ROW][C]18[/C][C]13.8[/C][C]13.8029[/C][C]-0.00285683[/C][/ROW]
[ROW][C]19[/C][C]10.8[/C][C]10.7088[/C][C]0.0911699[/C][/ROW]
[ROW][C]20[/C][C]11.7[/C][C]11.7174[/C][C]-0.0173988[/C][/ROW]
[ROW][C]21[/C][C]10.9[/C][C]10.9085[/C][C]-0.00847229[/C][/ROW]
[ROW][C]22[/C][C]16.1[/C][C]16.1174[/C][C]-0.0173967[/C][/ROW]
[ROW][C]23[/C][C]9.9[/C][C]9.82044[/C][C]0.079563[/C][/ROW]
[ROW][C]24[/C][C]11.5[/C][C]11.5227[/C][C]-0.0226649[/C][/ROW]
[ROW][C]25[/C][C]8.3[/C][C]8.22754[/C][C]0.0724641[/C][/ROW]
[ROW][C]26[/C][C]11.7[/C][C]11.7196[/C][C]-0.0195566[/C][/ROW]
[ROW][C]27[/C][C]9[/C][C]9.01881[/C][C]-0.0188124[/C][/ROW]
[ROW][C]28[/C][C]10.8[/C][C]10.9251[/C][C]-0.125112[/C][/ROW]
[ROW][C]29[/C][C]10.4[/C][C]10.4235[/C][C]-0.0234997[/C][/ROW]
[ROW][C]30[/C][C]12.7[/C][C]12.7235[/C][C]-0.023495[/C][/ROW]
[ROW][C]31[/C][C]11.8[/C][C]11.8202[/C][C]-0.0202226[/C][/ROW]
[ROW][C]32[/C][C]13[/C][C]13.0182[/C][C]-0.018241[/C][/ROW]
[ROW][C]33[/C][C]10.8[/C][C]10.7203[/C][C]0.0797448[/C][/ROW]
[ROW][C]34[/C][C]12.3[/C][C]12.2404[/C][C]0.0596426[/C][/ROW]
[ROW][C]35[/C][C]11.3[/C][C]11.4099[/C][C]-0.109881[/C][/ROW]
[ROW][C]36[/C][C]11.6[/C][C]11.7315[/C][C]-0.131507[/C][/ROW]
[ROW][C]37[/C][C]10.9[/C][C]10.9244[/C][C]-0.0244293[/C][/ROW]
[ROW][C]38[/C][C]12.1[/C][C]12.1215[/C][C]-0.0215143[/C][/ROW]
[ROW][C]39[/C][C]13.3[/C][C]13.3208[/C][C]-0.0207872[/C][/ROW]
[ROW][C]40[/C][C]10.1[/C][C]10.1245[/C][C]-0.0245199[/C][/ROW]
[ROW][C]41[/C][C]14.3[/C][C]14.2213[/C][C]0.0787242[/C][/ROW]
[ROW][C]42[/C][C]9.3[/C][C]9.21342[/C][C]0.086579[/C][/ROW]
[ROW][C]43[/C][C]12.5[/C][C]12.515[/C][C]-0.0150347[/C][/ROW]
[ROW][C]44[/C][C]7.6[/C][C]7.631[/C][C]-0.0310018[/C][/ROW]
[ROW][C]45[/C][C]9.2[/C][C]9.20956[/C][C]-0.00956265[/C][/ROW]
[ROW][C]46[/C][C]14.5[/C][C]14.5108[/C][C]-0.0108358[/C][/ROW]
[ROW][C]47[/C][C]12.3[/C][C]12.2082[/C][C]0.0918347[/C][/ROW]
[ROW][C]48[/C][C]12.6[/C][C]12.5218[/C][C]0.0781984[/C][/ROW]
[ROW][C]49[/C][C]13[/C][C]13.0182[/C][C]-0.018241[/C][/ROW]
[ROW][C]50[/C][C]12.6[/C][C]12.6267[/C][C]-0.0266874[/C][/ROW]
[ROW][C]51[/C][C]13.2[/C][C]13.223[/C][C]-0.0230438[/C][/ROW]
[ROW][C]52[/C][C]7.7[/C][C]7.7244[/C][C]-0.024396[/C][/ROW]
[ROW][C]53[/C][C]10.5[/C][C]10.4312[/C][C]0.0688476[/C][/ROW]
[ROW][C]54[/C][C]10.9[/C][C]10.8344[/C][C]0.0655746[/C][/ROW]
[ROW][C]55[/C][C]4.3[/C][C]4.31165[/C][C]-0.011653[/C][/ROW]
[ROW][C]56[/C][C]10.3[/C][C]10.3271[/C][C]-0.0270763[/C][/ROW]
[ROW][C]57[/C][C]11.4[/C][C]11.3316[/C][C]0.0684273[/C][/ROW]
[ROW][C]58[/C][C]5.6[/C][C]5.62404[/C][C]-0.024042[/C][/ROW]
[ROW][C]59[/C][C]8.8[/C][C]8.82928[/C][C]-0.0292759[/C][/ROW]
[ROW][C]60[/C][C]9[/C][C]9.02693[/C][C]-0.0269299[/C][/ROW]
[ROW][C]61[/C][C]9.6[/C][C]9.52589[/C][C]0.0741057[/C][/ROW]
[ROW][C]62[/C][C]6.4[/C][C]6.43476[/C][C]-0.0347617[/C][/ROW]
[ROW][C]63[/C][C]11.6[/C][C]11.6303[/C][C]-0.0303149[/C][/ROW]
[/TABLE]
Source: https://freestatistics.org/blog/index.php?pk=263933&T=4

Globally Unique Identifier (entire table): ba.freestatistics.org/blog/index.php?pk=263933&T=4

As an alternative you can also use a QR Code:  

The GUIDs for individual cells are displayed in the table below:

Multiple Linear Regression - Actuals, Interpolation, and Residuals
Time or IndexActualsInterpolationForecastResidualsPrediction Error
112.912.9232-0.0231529
212.812.8205-0.0204756
37.47.312960.0870394
46.76.71698-0.016977
512.612.6044-0.00441991
614.814.823-0.0229633
713.313.22770.0722817
811.111.1063-0.00628825
98.28.21348-0.0134802
1011.411.4199-0.0198582
116.46.41136-0.0113575
121211.91090.0891089
136.36.31915-0.0191482
1411.311.23260.0673845
1511.912.0139-0.113873
169.39.31841-0.018405
171010.0271-0.0270665
1813.813.8029-0.00285683
1910.810.70880.0911699
2011.711.7174-0.0173988
2110.910.9085-0.00847229
2216.116.1174-0.0173967
239.99.820440.079563
2411.511.5227-0.0226649
258.38.227540.0724641
2611.711.7196-0.0195566
2799.01881-0.0188124
2810.810.9251-0.125112
2910.410.4235-0.0234997
3012.712.7235-0.023495
3111.811.8202-0.0202226
321313.0182-0.018241
3310.810.72030.0797448
3412.312.24040.0596426
3511.311.4099-0.109881
3611.611.7315-0.131507
3710.910.9244-0.0244293
3812.112.1215-0.0215143
3913.313.3208-0.0207872
4010.110.1245-0.0245199
4114.314.22130.0787242
429.39.213420.086579
4312.512.515-0.0150347
447.67.631-0.0310018
459.29.20956-0.00956265
4614.514.5108-0.0108358
4712.312.20820.0918347
4812.612.52180.0781984
491313.0182-0.018241
5012.612.6267-0.0266874
5113.213.223-0.0230438
527.77.7244-0.024396
5310.510.43120.0688476
5410.910.83440.0655746
554.34.31165-0.011653
5610.310.3271-0.0270763
5711.411.33160.0684273
585.65.62404-0.024042
598.88.82928-0.0292759
6099.02693-0.0269299
619.69.525890.0741057
626.46.43476-0.0347617
6311.611.6303-0.0303149


Goldfeld-Quandt test for Heteroskedasticity
p-valuesAlternative Hypothesis
breakpoint indexgreater2-sidedless
90.2827320.5654640.717268
100.2041180.4082370.795882
110.1200580.2401170.879942
120.08938240.1787650.910618
130.07800560.1560110.921994
140.04400590.08801190.955994
150.4550040.9100080.544996
160.3627560.7255130.637244
170.3262590.6525170.673741
180.2442880.4885770.755712
190.5232620.9534760.476738
200.4396580.8793160.560342
210.371870.7437410.62813
220.3671190.7342370.632881
230.4277110.8554210.572289
240.3635260.7270510.636474
250.3577660.7155320.642234
260.2954890.5909790.704511
270.2392170.4784340.760783
280.5842290.8315430.415771
290.5149390.9701230.485061
300.4551520.9103050.544848
310.3825290.7650580.617471
320.3121050.6242110.687895
330.4436190.8872380.556381
340.4406470.8812940.559353
350.6793240.6413520.320676
360.9146690.1706630.0853313
370.8802610.2394780.119739
380.8416690.3166610.158331
390.8441530.3116940.155847
400.8037850.3924290.196215
410.8239480.3521050.176052
420.8955690.2088610.104431
430.8644870.2710250.135513
440.8201480.3597030.179852
450.761810.476380.23819
460.7537880.4924240.246212
470.7315930.5368140.268407
480.8598710.2802590.140129
490.7905490.4189020.209451
500.7261060.5477890.273894
510.6359260.7281490.364074
520.5745240.8509530.425476
530.5186060.9627880.481394
540.5792170.8415660.420783

\begin{tabular}{lllllllll}
\hline
Goldfeld-Quandt test for Heteroskedasticity \tabularnewline
p-values & Alternative Hypothesis \tabularnewline
breakpoint index & greater & 2-sided & less \tabularnewline
9 & 0.282732 & 0.565464 & 0.717268 \tabularnewline
10 & 0.204118 & 0.408237 & 0.795882 \tabularnewline
11 & 0.120058 & 0.240117 & 0.879942 \tabularnewline
12 & 0.0893824 & 0.178765 & 0.910618 \tabularnewline
13 & 0.0780056 & 0.156011 & 0.921994 \tabularnewline
14 & 0.0440059 & 0.0880119 & 0.955994 \tabularnewline
15 & 0.455004 & 0.910008 & 0.544996 \tabularnewline
16 & 0.362756 & 0.725513 & 0.637244 \tabularnewline
17 & 0.326259 & 0.652517 & 0.673741 \tabularnewline
18 & 0.244288 & 0.488577 & 0.755712 \tabularnewline
19 & 0.523262 & 0.953476 & 0.476738 \tabularnewline
20 & 0.439658 & 0.879316 & 0.560342 \tabularnewline
21 & 0.37187 & 0.743741 & 0.62813 \tabularnewline
22 & 0.367119 & 0.734237 & 0.632881 \tabularnewline
23 & 0.427711 & 0.855421 & 0.572289 \tabularnewline
24 & 0.363526 & 0.727051 & 0.636474 \tabularnewline
25 & 0.357766 & 0.715532 & 0.642234 \tabularnewline
26 & 0.295489 & 0.590979 & 0.704511 \tabularnewline
27 & 0.239217 & 0.478434 & 0.760783 \tabularnewline
28 & 0.584229 & 0.831543 & 0.415771 \tabularnewline
29 & 0.514939 & 0.970123 & 0.485061 \tabularnewline
30 & 0.455152 & 0.910305 & 0.544848 \tabularnewline
31 & 0.382529 & 0.765058 & 0.617471 \tabularnewline
32 & 0.312105 & 0.624211 & 0.687895 \tabularnewline
33 & 0.443619 & 0.887238 & 0.556381 \tabularnewline
34 & 0.440647 & 0.881294 & 0.559353 \tabularnewline
35 & 0.679324 & 0.641352 & 0.320676 \tabularnewline
36 & 0.914669 & 0.170663 & 0.0853313 \tabularnewline
37 & 0.880261 & 0.239478 & 0.119739 \tabularnewline
38 & 0.841669 & 0.316661 & 0.158331 \tabularnewline
39 & 0.844153 & 0.311694 & 0.155847 \tabularnewline
40 & 0.803785 & 0.392429 & 0.196215 \tabularnewline
41 & 0.823948 & 0.352105 & 0.176052 \tabularnewline
42 & 0.895569 & 0.208861 & 0.104431 \tabularnewline
43 & 0.864487 & 0.271025 & 0.135513 \tabularnewline
44 & 0.820148 & 0.359703 & 0.179852 \tabularnewline
45 & 0.76181 & 0.47638 & 0.23819 \tabularnewline
46 & 0.753788 & 0.492424 & 0.246212 \tabularnewline
47 & 0.731593 & 0.536814 & 0.268407 \tabularnewline
48 & 0.859871 & 0.280259 & 0.140129 \tabularnewline
49 & 0.790549 & 0.418902 & 0.209451 \tabularnewline
50 & 0.726106 & 0.547789 & 0.273894 \tabularnewline
51 & 0.635926 & 0.728149 & 0.364074 \tabularnewline
52 & 0.574524 & 0.850953 & 0.425476 \tabularnewline
53 & 0.518606 & 0.962788 & 0.481394 \tabularnewline
54 & 0.579217 & 0.841566 & 0.420783 \tabularnewline
\hline
\end{tabular}
%Source: https://freestatistics.org/blog/index.php?pk=263933&T=5

[TABLE]
[ROW][C]Goldfeld-Quandt test for Heteroskedasticity[/C][/ROW]
[ROW][C]p-values[/C][C]Alternative Hypothesis[/C][/ROW]
[ROW][C]breakpoint index[/C][C]greater[/C][C]2-sided[/C][C]less[/C][/ROW]
[ROW][C]9[/C][C]0.282732[/C][C]0.565464[/C][C]0.717268[/C][/ROW]
[ROW][C]10[/C][C]0.204118[/C][C]0.408237[/C][C]0.795882[/C][/ROW]
[ROW][C]11[/C][C]0.120058[/C][C]0.240117[/C][C]0.879942[/C][/ROW]
[ROW][C]12[/C][C]0.0893824[/C][C]0.178765[/C][C]0.910618[/C][/ROW]
[ROW][C]13[/C][C]0.0780056[/C][C]0.156011[/C][C]0.921994[/C][/ROW]
[ROW][C]14[/C][C]0.0440059[/C][C]0.0880119[/C][C]0.955994[/C][/ROW]
[ROW][C]15[/C][C]0.455004[/C][C]0.910008[/C][C]0.544996[/C][/ROW]
[ROW][C]16[/C][C]0.362756[/C][C]0.725513[/C][C]0.637244[/C][/ROW]
[ROW][C]17[/C][C]0.326259[/C][C]0.652517[/C][C]0.673741[/C][/ROW]
[ROW][C]18[/C][C]0.244288[/C][C]0.488577[/C][C]0.755712[/C][/ROW]
[ROW][C]19[/C][C]0.523262[/C][C]0.953476[/C][C]0.476738[/C][/ROW]
[ROW][C]20[/C][C]0.439658[/C][C]0.879316[/C][C]0.560342[/C][/ROW]
[ROW][C]21[/C][C]0.37187[/C][C]0.743741[/C][C]0.62813[/C][/ROW]
[ROW][C]22[/C][C]0.367119[/C][C]0.734237[/C][C]0.632881[/C][/ROW]
[ROW][C]23[/C][C]0.427711[/C][C]0.855421[/C][C]0.572289[/C][/ROW]
[ROW][C]24[/C][C]0.363526[/C][C]0.727051[/C][C]0.636474[/C][/ROW]
[ROW][C]25[/C][C]0.357766[/C][C]0.715532[/C][C]0.642234[/C][/ROW]
[ROW][C]26[/C][C]0.295489[/C][C]0.590979[/C][C]0.704511[/C][/ROW]
[ROW][C]27[/C][C]0.239217[/C][C]0.478434[/C][C]0.760783[/C][/ROW]
[ROW][C]28[/C][C]0.584229[/C][C]0.831543[/C][C]0.415771[/C][/ROW]
[ROW][C]29[/C][C]0.514939[/C][C]0.970123[/C][C]0.485061[/C][/ROW]
[ROW][C]30[/C][C]0.455152[/C][C]0.910305[/C][C]0.544848[/C][/ROW]
[ROW][C]31[/C][C]0.382529[/C][C]0.765058[/C][C]0.617471[/C][/ROW]
[ROW][C]32[/C][C]0.312105[/C][C]0.624211[/C][C]0.687895[/C][/ROW]
[ROW][C]33[/C][C]0.443619[/C][C]0.887238[/C][C]0.556381[/C][/ROW]
[ROW][C]34[/C][C]0.440647[/C][C]0.881294[/C][C]0.559353[/C][/ROW]
[ROW][C]35[/C][C]0.679324[/C][C]0.641352[/C][C]0.320676[/C][/ROW]
[ROW][C]36[/C][C]0.914669[/C][C]0.170663[/C][C]0.0853313[/C][/ROW]
[ROW][C]37[/C][C]0.880261[/C][C]0.239478[/C][C]0.119739[/C][/ROW]
[ROW][C]38[/C][C]0.841669[/C][C]0.316661[/C][C]0.158331[/C][/ROW]
[ROW][C]39[/C][C]0.844153[/C][C]0.311694[/C][C]0.155847[/C][/ROW]
[ROW][C]40[/C][C]0.803785[/C][C]0.392429[/C][C]0.196215[/C][/ROW]
[ROW][C]41[/C][C]0.823948[/C][C]0.352105[/C][C]0.176052[/C][/ROW]
[ROW][C]42[/C][C]0.895569[/C][C]0.208861[/C][C]0.104431[/C][/ROW]
[ROW][C]43[/C][C]0.864487[/C][C]0.271025[/C][C]0.135513[/C][/ROW]
[ROW][C]44[/C][C]0.820148[/C][C]0.359703[/C][C]0.179852[/C][/ROW]
[ROW][C]45[/C][C]0.76181[/C][C]0.47638[/C][C]0.23819[/C][/ROW]
[ROW][C]46[/C][C]0.753788[/C][C]0.492424[/C][C]0.246212[/C][/ROW]
[ROW][C]47[/C][C]0.731593[/C][C]0.536814[/C][C]0.268407[/C][/ROW]
[ROW][C]48[/C][C]0.859871[/C][C]0.280259[/C][C]0.140129[/C][/ROW]
[ROW][C]49[/C][C]0.790549[/C][C]0.418902[/C][C]0.209451[/C][/ROW]
[ROW][C]50[/C][C]0.726106[/C][C]0.547789[/C][C]0.273894[/C][/ROW]
[ROW][C]51[/C][C]0.635926[/C][C]0.728149[/C][C]0.364074[/C][/ROW]
[ROW][C]52[/C][C]0.574524[/C][C]0.850953[/C][C]0.425476[/C][/ROW]
[ROW][C]53[/C][C]0.518606[/C][C]0.962788[/C][C]0.481394[/C][/ROW]
[ROW][C]54[/C][C]0.579217[/C][C]0.841566[/C][C]0.420783[/C][/ROW]
[/TABLE]
Source: https://freestatistics.org/blog/index.php?pk=263933&T=5

Globally Unique Identifier (entire table): ba.freestatistics.org/blog/index.php?pk=263933&T=5

As an alternative you can also use a QR Code:  

The GUIDs for individual cells are displayed in the table below:

Goldfeld-Quandt test for Heteroskedasticity
p-valuesAlternative Hypothesis
breakpoint indexgreater2-sidedless
90.2827320.5654640.717268
100.2041180.4082370.795882
110.1200580.2401170.879942
120.08938240.1787650.910618
130.07800560.1560110.921994
140.04400590.08801190.955994
150.4550040.9100080.544996
160.3627560.7255130.637244
170.3262590.6525170.673741
180.2442880.4885770.755712
190.5232620.9534760.476738
200.4396580.8793160.560342
210.371870.7437410.62813
220.3671190.7342370.632881
230.4277110.8554210.572289
240.3635260.7270510.636474
250.3577660.7155320.642234
260.2954890.5909790.704511
270.2392170.4784340.760783
280.5842290.8315430.415771
290.5149390.9701230.485061
300.4551520.9103050.544848
310.3825290.7650580.617471
320.3121050.6242110.687895
330.4436190.8872380.556381
340.4406470.8812940.559353
350.6793240.6413520.320676
360.9146690.1706630.0853313
370.8802610.2394780.119739
380.8416690.3166610.158331
390.8441530.3116940.155847
400.8037850.3924290.196215
410.8239480.3521050.176052
420.8955690.2088610.104431
430.8644870.2710250.135513
440.8201480.3597030.179852
450.761810.476380.23819
460.7537880.4924240.246212
470.7315930.5368140.268407
480.8598710.2802590.140129
490.7905490.4189020.209451
500.7261060.5477890.273894
510.6359260.7281490.364074
520.5745240.8509530.425476
530.5186060.9627880.481394
540.5792170.8415660.420783


Meta Analysis of Goldfeld-Quandt test for Heteroskedasticity
Description# significant tests% significant testsOK/NOK
1% type I error level00OK
5% type I error level00OK
10% type I error level10.0217391OK

\begin{tabular}{lllllllll}
\hline
Meta Analysis of Goldfeld-Quandt test for Heteroskedasticity \tabularnewline
Description & # significant tests & % significant tests & OK/NOK \tabularnewline
1% type I error level & 0 & 0 & OK \tabularnewline
5% type I error level & 0 & 0 & OK \tabularnewline
10% type I error level & 1 & 0.0217391 & OK \tabularnewline
\hline
\end{tabular}
%Source: https://freestatistics.org/blog/index.php?pk=263933&T=6

[TABLE]
[ROW][C]Meta Analysis of Goldfeld-Quandt test for Heteroskedasticity[/C][/ROW]
[ROW][C]Description[/C][C]# significant tests[/C][C]% significant tests[/C][C]OK/NOK[/C][/ROW]
[ROW][C]1% type I error level[/C][C]0[/C][C]0[/C][C]OK[/C][/ROW]
[ROW][C]5% type I error level[/C][C]0[/C][C]0[/C][C]OK[/C][/ROW]
[ROW][C]10% type I error level[/C][C]1[/C][C]0.0217391[/C][C]OK[/C][/ROW]
[/TABLE]
Source: https://freestatistics.org/blog/index.php?pk=263933&T=6

Globally Unique Identifier (entire table): ba.freestatistics.org/blog/index.php?pk=263933&T=6

As an alternative you can also use a QR Code:  

The GUIDs for individual cells are displayed in the table below:

Meta Analysis of Goldfeld-Quandt test for Heteroskedasticity
Description# significant tests% significant testsOK/NOK
1% type I error level00OK
5% type I error level00OK
10% type I error level10.0217391OK


Parameters (Session):
par1 = 3 ; par2 = Do not include Seasonal Dummies ; par3 = No Linear Trend ;
Parameters (R input):
par1 = 6 ; par2 = Do not include Seasonal Dummies ; par3 = No Linear Trend ;
R code (references can be found in the software module):
library(lattice)
library(lmtest)
n25 <- 25 #minimum number of obs. for Goldfeld-Quandt test
par1 <- as.numeric(par1)
x <- t(y)
k <- length(x[1,])
n <- length(x[,1])
x1 <- cbind(x[,par1], x[,1:k!=par1])
mycolnames <- c(colnames(x)[par1], colnames(x)[1:k!=par1])
colnames(x1) <- mycolnames #colnames(x)[par1]
x <- x1
if (par3 == 'First Differences'){
x2 <- array(0, dim=c(n-1,k), dimnames=list(1:(n-1), paste('(1-B)',colnames(x),sep='')))
for (i in 1:n-1) {
for (j in 1:k) {
x2[i,j] <- x[i+1,j] - x[i,j]
}
}
x <- x2
}
if (par2 == 'Include Monthly Dummies'){
x2 <- array(0, dim=c(n,11), dimnames=list(1:n, paste('M', seq(1:11), sep ='')))
for (i in 1:11){
x2[seq(i,n,12),i] <- 1
}
x <- cbind(x, x2)
}
if (par2 == 'Include Quarterly Dummies'){
x2 <- array(0, dim=c(n,3), dimnames=list(1:n, paste('Q', seq(1:3), sep ='')))
for (i in 1:3){
x2[seq(i,n,4),i] <- 1
}
x <- cbind(x, x2)
}
k <- length(x[1,])
if (par3 == 'Linear Trend'){
x <- cbind(x, c(1:n))
colnames(x)[k+1] <- 't'
}
x
k <- length(x[1,])
df <- as.data.frame(x)
(mylm <- lm(df))
(mysum <- summary(mylm))
if (n > n25) {
kp3 <- k + 3
nmkm3 <- n - k - 3
gqarr <- array(NA, dim=c(nmkm3-kp3+1,3))
numgqtests <- 0
numsignificant1 <- 0
numsignificant5 <- 0
numsignificant10 <- 0
for (mypoint in kp3:nmkm3) {
j <- 0
numgqtests <- numgqtests + 1
for (myalt in c('greater', 'two.sided', 'less')) {
j <- j + 1
gqarr[mypoint-kp3+1,j] <- gqtest(mylm, point=mypoint, alternative=myalt)$p.value
}
if (gqarr[mypoint-kp3+1,2] < 0.01) numsignificant1 <- numsignificant1 + 1
if (gqarr[mypoint-kp3+1,2] < 0.05) numsignificant5 <- numsignificant5 + 1
if (gqarr[mypoint-kp3+1,2] < 0.10) numsignificant10 <- numsignificant10 + 1
}
gqarr
}
bitmap(file='test0.png')
plot(x[,1], type='l', main='Actuals and Interpolation', ylab='value of Actuals and Interpolation (dots)', xlab='time or index')
points(x[,1]-mysum$resid)
grid()
dev.off()
bitmap(file='test1.png')
plot(mysum$resid, type='b', pch=19, main='Residuals', ylab='value of Residuals', xlab='time or index')
grid()
dev.off()
bitmap(file='test2.png')
hist(mysum$resid, main='Residual Histogram', xlab='values of Residuals')
grid()
dev.off()
bitmap(file='test3.png')
densityplot(~mysum$resid,col='black',main='Residual Density Plot', xlab='values of Residuals')
dev.off()
bitmap(file='test4.png')
qqnorm(mysum$resid, main='Residual Normal Q-Q Plot')
qqline(mysum$resid)
grid()
dev.off()
(myerror <- as.ts(mysum$resid))
bitmap(file='test5.png')
dum <- cbind(lag(myerror,k=1),myerror)
dum
dum1 <- dum[2:length(myerror),]
dum1
z <- as.data.frame(dum1)
z
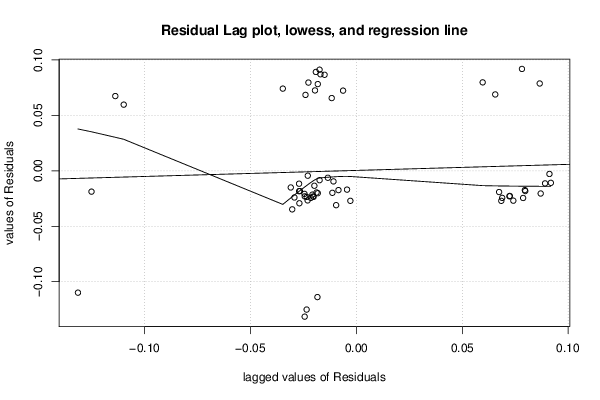
plot(z,main=paste('Residual Lag plot, lowess, and regression line'), ylab='values of Residuals', xlab='lagged values of Residuals')
lines(lowess(z))
abline(lm(z))
grid()
dev.off()
bitmap(file='test6.png')
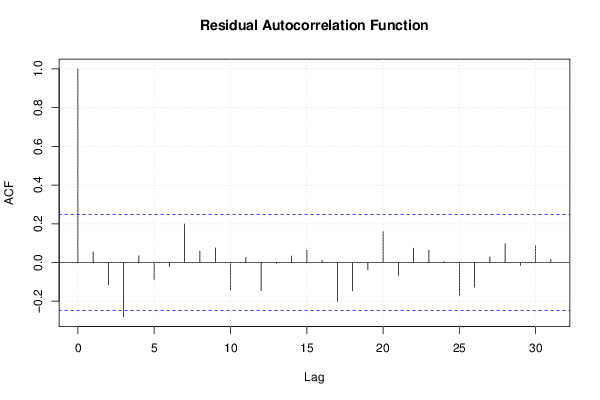
acf(mysum$resid, lag.max=length(mysum$resid)/2, main='Residual Autocorrelation Function')
grid()
dev.off()
bitmap(file='test7.png')
pacf(mysum$resid, lag.max=length(mysum$resid)/2, main='Residual Partial Autocorrelation Function')
grid()
dev.off()
bitmap(file='test8.png')
opar <- par(mfrow = c(2,2), oma = c(0, 0, 1.1, 0))
plot(mylm, las = 1, sub='Residual Diagnostics')
par(opar)
dev.off()
if (n > n25) {
bitmap(file='test9.png')
plot(kp3:nmkm3,gqarr[,2], main='Goldfeld-Quandt test',ylab='2-sided p-value',xlab='breakpoint')
grid()
dev.off()
}
load(file='createtable')
a<-table.start()
a<-table.row.start(a)
a<-table.element(a, 'Multiple Linear Regression - Estimated Regression Equation', 1, TRUE)
a<-table.row.end(a)
myeq <- colnames(x)[1]
myeq <- paste(myeq, '[t] = ', sep='')
for (i in 1:k){
if (mysum$coefficients[i,1] > 0) myeq <- paste(myeq, '+', '')
myeq <- paste(myeq, signif(mysum$coefficients[i,1],6), sep=' ')
if (rownames(mysum$coefficients)[i] != '(Intercept)') {
myeq <- paste(myeq, rownames(mysum$coefficients)[i], sep='')
if (rownames(mysum$coefficients)[i] != 't') myeq <- paste(myeq, '[t]', sep='')
}
}
myeq <- paste(myeq, ' + e[t]')
a<-table.row.start(a)
a<-table.element(a, myeq)
a<-table.row.end(a)
a<-table.end(a)
table.save(a,file='mytable1.tab')
a<-table.start()
a<-table.row.start(a)
a<-table.element(a,hyperlink('ols1.htm','Multiple Linear Regression - Ordinary Least Squares',''), 6, TRUE)
a<-table.row.end(a)
a<-table.row.start(a)
a<-table.element(a,'Variable',header=TRUE)
a<-table.element(a,'Parameter',header=TRUE)
a<-table.element(a,'S.D.',header=TRUE)
a<-table.element(a,'T-STAT
H0: parameter = 0',header=TRUE)
a<-table.element(a,'2-tail p-value',header=TRUE)
a<-table.element(a,'1-tail p-value',header=TRUE)
a<-table.row.end(a)
for (i in 1:k){
a<-table.row.start(a)
a<-table.element(a,rownames(mysum$coefficients)[i],header=TRUE)
a<-table.element(a,signif(mysum$coefficients[i,1],6))
a<-table.element(a, signif(mysum$coefficients[i,2],6))
a<-table.element(a, signif(mysum$coefficients[i,3],4))
a<-table.element(a, signif(mysum$coefficients[i,4],6))
a<-table.element(a, signif(mysum$coefficients[i,4]/2,6))
a<-table.row.end(a)
}
a<-table.end(a)
table.save(a,file='mytable2.tab')
a<-table.start()
a<-table.row.start(a)
a<-table.element(a, 'Multiple Linear Regression - Regression Statistics', 2, TRUE)
a<-table.row.end(a)
a<-table.row.start(a)
a<-table.element(a, 'Multiple R',1,TRUE)
a<-table.element(a, signif(sqrt(mysum$r.squared),6))
a<-table.row.end(a)
a<-table.row.start(a)
a<-table.element(a, 'R-squared',1,TRUE)
a<-table.element(a, signif(mysum$r.squared,6))
a<-table.row.end(a)
a<-table.row.start(a)
a<-table.element(a, 'Adjusted R-squared',1,TRUE)
a<-table.element(a, signif(mysum$adj.r.squared,6))
a<-table.row.end(a)
a<-table.row.start(a)
a<-table.element(a, 'F-TEST (value)',1,TRUE)
a<-table.element(a, signif(mysum$fstatistic[1],6))
a<-table.row.end(a)
a<-table.row.start(a)
a<-table.element(a, 'F-TEST (DF numerator)',1,TRUE)
a<-table.element(a, signif(mysum$fstatistic[2],6))
a<-table.row.end(a)
a<-table.row.start(a)
a<-table.element(a, 'F-TEST (DF denominator)',1,TRUE)
a<-table.element(a, signif(mysum$fstatistic[3],6))
a<-table.row.end(a)
a<-table.row.start(a)
a<-table.element(a, 'p-value',1,TRUE)
a<-table.element(a, signif(1-pf(mysum$fstatistic[1],mysum$fstatistic[2],mysum$fstatistic[3]),6))
a<-table.row.end(a)
a<-table.row.start(a)
a<-table.element(a, 'Multiple Linear Regression - Residual Statistics', 2, TRUE)
a<-table.row.end(a)
a<-table.row.start(a)
a<-table.element(a, 'Residual Standard Deviation',1,TRUE)
a<-table.element(a, signif(mysum$sigma,6))
a<-table.row.end(a)
a<-table.row.start(a)
a<-table.element(a, 'Sum Squared Residuals',1,TRUE)
a<-table.element(a, signif(sum(myerror*myerror),6))
a<-table.row.end(a)
a<-table.end(a)
table.save(a,file='mytable3.tab')
a<-table.start()
a<-table.row.start(a)
a<-table.element(a, 'Multiple Linear Regression - Actuals, Interpolation, and Residuals', 4, TRUE)
a<-table.row.end(a)
a<-table.row.start(a)
a<-table.element(a, 'Time or Index', 1, TRUE)
a<-table.element(a, 'Actuals', 1, TRUE)
a<-table.element(a, 'Interpolation
Forecast', 1, TRUE)
a<-table.element(a, 'Residuals
Prediction Error', 1, TRUE)
a<-table.row.end(a)
for (i in 1:n) {
a<-table.row.start(a)
a<-table.element(a,i, 1, TRUE)
a<-table.element(a,signif(x[i],6))
a<-table.element(a,signif(x[i]-mysum$resid[i],6))
a<-table.element(a,signif(mysum$resid[i],6))
a<-table.row.end(a)
}
a<-table.end(a)
table.save(a,file='mytable4.tab')
if (n > n25) {
a<-table.start()
a<-table.row.start(a)
a<-table.element(a,'Goldfeld-Quandt test for Heteroskedasticity',4,TRUE)
a<-table.row.end(a)
a<-table.row.start(a)
a<-table.element(a,'p-values',header=TRUE)
a<-table.element(a,'Alternative Hypothesis',3,header=TRUE)
a<-table.row.end(a)
a<-table.row.start(a)
a<-table.element(a,'breakpoint index',header=TRUE)
a<-table.element(a,'greater',header=TRUE)
a<-table.element(a,'2-sided',header=TRUE)
a<-table.element(a,'less',header=TRUE)
a<-table.row.end(a)
for (mypoint in kp3:nmkm3) {
a<-table.row.start(a)
a<-table.element(a,mypoint,header=TRUE)
a<-table.element(a,signif(gqarr[mypoint-kp3+1,1],6))
a<-table.element(a,signif(gqarr[mypoint-kp3+1,2],6))
a<-table.element(a,signif(gqarr[mypoint-kp3+1,3],6))
a<-table.row.end(a)
}
a<-table.end(a)
table.save(a,file='mytable5.tab')
a<-table.start()
a<-table.row.start(a)
a<-table.element(a,'Meta Analysis of Goldfeld-Quandt test for Heteroskedasticity',4,TRUE)
a<-table.row.end(a)
a<-table.row.start(a)
a<-table.element(a,'Description',header=TRUE)
a<-table.element(a,'# significant tests',header=TRUE)
a<-table.element(a,'% significant tests',header=TRUE)
a<-table.element(a,'OK/NOK',header=TRUE)
a<-table.row.end(a)
a<-table.row.start(a)
a<-table.element(a,'1% type I error level',header=TRUE)
a<-table.element(a,signif(numsignificant1,6))
a<-table.element(a,signif(numsignificant1/numgqtests,6))
if (numsignificant1/numgqtests < 0.01) dum <- 'OK' else dum <- 'NOK'
a<-table.element(a,dum)
a<-table.row.end(a)
a<-table.row.start(a)
a<-table.element(a,'5% type I error level',header=TRUE)
a<-table.element(a,signif(numsignificant5,6))
a<-table.element(a,signif(numsignificant5/numgqtests,6))
if (numsignificant5/numgqtests < 0.05) dum <- 'OK' else dum <- 'NOK'
a<-table.element(a,dum)
a<-table.row.end(a)
a<-table.row.start(a)
a<-table.element(a,'10% type I error level',header=TRUE)
a<-table.element(a,signif(numsignificant10,6))
a<-table.element(a,signif(numsignificant10/numgqtests,6))
if (numsignificant10/numgqtests < 0.1) dum <- 'OK' else dum <- 'NOK'
a<-table.element(a,dum)
a<-table.row.end(a)
a<-table.end(a)
table.save(a,file='mytable6.tab')
}