Free Statistics
of Irreproducible Research!
Description of Statistical Computation | ||||||||||||||||||||||||||||||
|---|---|---|---|---|---|---|---|---|---|---|---|---|---|---|---|---|---|---|---|---|---|---|---|---|---|---|---|---|---|---|
| Author's title | ||||||||||||||||||||||||||||||
| Author | *The author of this computation has been verified* | |||||||||||||||||||||||||||||
| R Software Module | rwasp_Distributional Plots.wasp | |||||||||||||||||||||||||||||
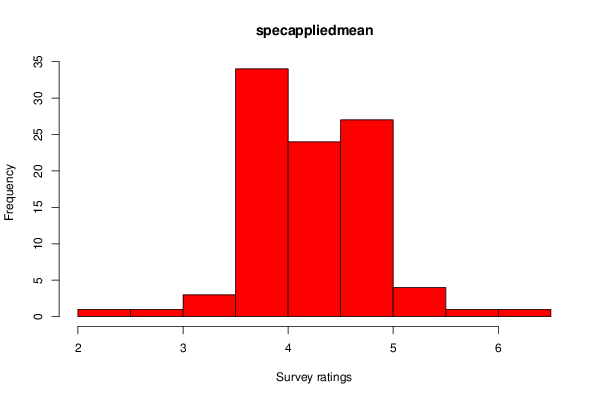
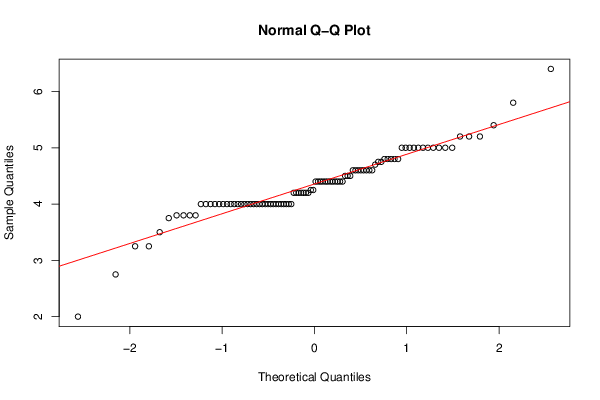
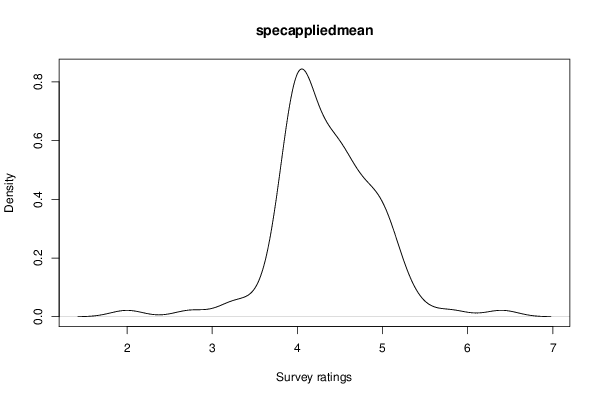
| Title produced by software | Histogram, QQplot and Density | |||||||||||||||||||||||||||||
| Date of computation | Mon, 01 Dec 2014 18:25:28 +0000 | |||||||||||||||||||||||||||||
| Cite this page as follows | Statistical Computations at FreeStatistics.org, Office for Research Development and Education, URL https://freestatistics.org/blog/index.php?v=date/2014/Dec/01/t1417458397to6naoddc13p7cb.htm/, Retrieved Sun, 19 May 2024 14:44:12 +0000 | |||||||||||||||||||||||||||||
| Statistical Computations at FreeStatistics.org, Office for Research Development and Education, URL https://freestatistics.org/blog/index.php?pk=262168, Retrieved Sun, 19 May 2024 14:44:12 +0000 | ||||||||||||||||||||||||||||||
| QR Codes: | ||||||||||||||||||||||||||||||
|
| ||||||||||||||||||||||||||||||
| Original text written by user: | ||||||||||||||||||||||||||||||
| IsPrivate? | No (this computation is public) | |||||||||||||||||||||||||||||
| User-defined keywords | ||||||||||||||||||||||||||||||
| Estimated Impact | 106 | |||||||||||||||||||||||||||||
Tree of Dependent Computations | ||||||||||||||||||||||||||||||
| Family? (F = Feedback message, R = changed R code, M = changed R Module, P = changed Parameters, D = changed Data) | ||||||||||||||||||||||||||||||
| - [Histogram, QQplot and Density] [] [2014-10-11 09:05:01] [32b17a345b130fdf5cc88718ed94a974] - R D [Histogram, QQplot and Density] [compmemomean NO] [2014-12-01 17:59:29] [db73a12161c07082da7682d758029ebc] - D [Histogram, QQplot and Density] [compattenmean NO] [2014-12-01 18:04:36] [db73a12161c07082da7682d758029ebc] - D [Histogram, QQplot and Density] [NO ] [2014-12-01 18:07:44] [db73a12161c07082da7682d758029ebc] - D [Histogram, QQplot and Density] [Almost.. NO] [2014-12-01 18:15:27] [db73a12161c07082da7682d758029ebc] - D [Histogram, QQplot and Density] [specattenmean NP....] [2014-12-01 18:19:37] [db73a12161c07082da7682d758029ebc] - D [Histogram, QQplot and Density] [specappliedmean NO] [2014-12-01 18:25:28] [b1266da26a0b890274b48408df050392] [Current] | ||||||||||||||||||||||||||||||
| Feedback Forum | ||||||||||||||||||||||||||||||
Post a new message | ||||||||||||||||||||||||||||||
Dataset | ||||||||||||||||||||||||||||||
| Dataseries X: | ||||||||||||||||||||||||||||||
4.6 4 4.8 4 5 5 4 4 4.4 4 4 5 3.8 4.6 4 4.6 4.7 4 4 4.4 4.8 5.8 4.6 4.75 5 2.75 4 3.8 4.4 4.8 4.25 4.4 4 4.5 5 3.5 2 4.4 4.4 4.25 3.25 4.2 4.75 4.4 4 4.2 5 4.6 4.4 4 4.4 4.5 5.2 4.4 3.25 4.6 3.75 5 3.8 4 5.4 5 5 4.2 4.4 4 4.6 4.2 5.2 6.4 4 4 5 4 4.2 4 4 4 4 4 4.2 4 4 4 5.2 4.2 4.8 4 4.8 5 4.6 4 4.4 4 3.8 4.5 | ||||||||||||||||||||||||||||||
Tables (Output of Computation) | ||||||||||||||||||||||||||||||
| ||||||||||||||||||||||||||||||
Figures (Output of Computation) | ||||||||||||||||||||||||||||||
Input Parameters & R Code | ||||||||||||||||||||||||||||||
| Parameters (Session): | ||||||||||||||||||||||||||||||
| par1 = 10 ; | ||||||||||||||||||||||||||||||
| Parameters (R input): | ||||||||||||||||||||||||||||||
| par1 = 10 ; | ||||||||||||||||||||||||||||||
| R code (references can be found in the software module): | ||||||||||||||||||||||||||||||
x <- x[!is.na(x)] | ||||||||||||||||||||||||||||||