Free Statistics

of Irreproducible Research!

Author's title

Author*Unverified author*
R Software Modulerwasp_autocorrelation.wasp
Title produced by software(Partial) Autocorrelation Function
Date of computationSun, 17 Aug 2014 19:33:20 +0100
Cite this page as followsStatistical Computations at FreeStatistics.org, Office for Research Development and Education, URL https://freestatistics.org/blog/index.php?v=date/2014/Aug/17/t14083004916bormf7oxhh073t.htm/, Retrieved Fri, 17 May 2024 04:49:20 +0000
Statistical Computations at FreeStatistics.org, Office for Research Development and Education, URL https://freestatistics.org/blog/index.php?pk=235631, Retrieved Fri, 17 May 2024 04:49:20 +0000
QR Codes:

Original text written by user:
IsPrivate?No (this computation is public)
User-defined keywordsVan Reusel Raphael
Estimated Impact102
Family? (F = Feedback message, R = changed R code, M = changed R Module, P = changed Parameters, D = changed Data)
-     [Harrell-Davis Quantiles] [Tijdreeks 1] [2014-08-17 17:04:09] [01050b0485b0192e33ca8050be87927f]
- RMP     [(Partial) Autocorrelation Function] [Tijdreeks 1] [2014-08-17 18:33:20] [bf566d88435d8cc6ce5d208f6f8dd684] [Current]
Feedback Forum

Post a new message
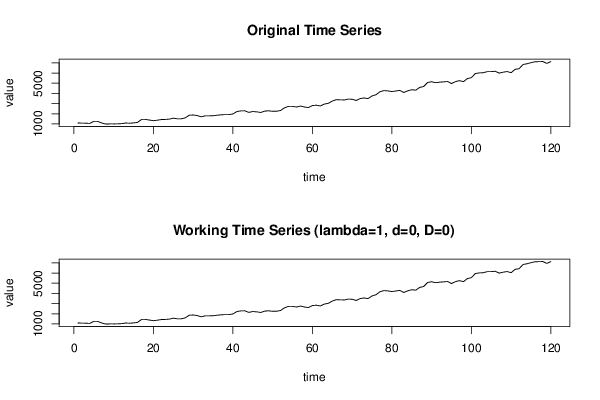
Dataseries X:
1095
1085
1075
1054
1261
1250
1095
992
1002
1002
1013
1033
1095
1075
1106
1157
1447
1447
1385
1323
1374
1436
1447
1478
1571
1509
1509
1602
1860
1881
1829
1705
1798
1798
1808
1860
1901
1922
1922
1984
2222
2284
2294
2139
2222
2191
2129
2263
2294
2242
2253
2325
2594
2728
2728
2666
2759
2666
2614
2811
2842
2769
2955
3028
3245
3389
3369
3358
3441
3431
3307
3493
3555
3493
3751
3875
4164
4278
4247
4185
4237
4299
4092
4257
4361
4319
4588
4681
5074
5146
5053
5105
5136
5167
4970
5156
5259
5156
5456
5549
5952
6014
6034
6138
6138
6179
5993
6086
6148
6034
6365
6427
6840
6913
7016
7109
7119
7130
6944
7130


Summary of computational transaction
Raw Inputview raw input (R code)
Raw Outputview raw output of R engine
Computing time1 seconds
R Server'Sir Maurice George Kendall' @ kendall.wessa.net

\begin{tabular}{lllllllll}
\hline
Summary of computational transaction \tabularnewline
Raw Input & view raw input (R code)  \tabularnewline
Raw Output & view raw output of R engine  \tabularnewline
Computing time & 1 seconds \tabularnewline
R Server & 'Sir Maurice George Kendall' @ kendall.wessa.net \tabularnewline
\hline
\end{tabular}
%Source: https://freestatistics.org/blog/index.php?pk=235631&T=0

[TABLE]
[ROW][C]Summary of computational transaction[/C][/ROW]
[ROW][C]Raw Input[/C][C]view raw input (R code) [/C][/ROW]
[ROW][C]Raw Output[/C][C]view raw output of R engine [/C][/ROW]
[ROW][C]Computing time[/C][C]1 seconds[/C][/ROW]
[ROW][C]R Server[/C][C]'Sir Maurice George Kendall' @ kendall.wessa.net[/C][/ROW]
[/TABLE]
Source: https://freestatistics.org/blog/index.php?pk=235631&T=0

Globally Unique Identifier (entire table): ba.freestatistics.org/blog/index.php?pk=235631&T=0

As an alternative you can also use a QR Code:  

The GUIDs for individual cells are displayed in the table below:

Summary of computational transaction
Raw Inputview raw input (R code)
Raw Outputview raw output of R engine
Computing time1 seconds
R Server'Sir Maurice George Kendall' @ kendall.wessa.net


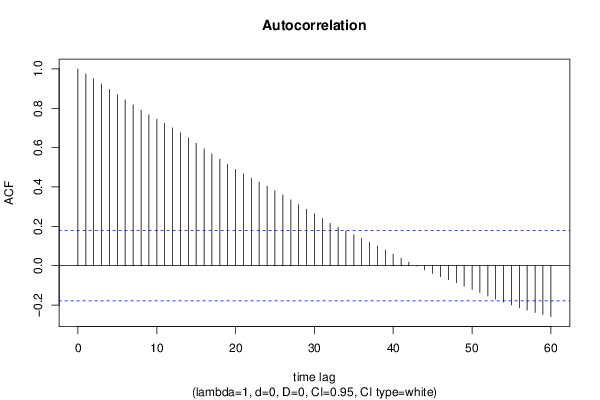
Autocorrelation Function
Time lag kACF(k)T-STATP-value
10.97471910.67750
20.95039510.41110
30.92351610.11660
40.8958759.81380
50.8690739.52020
60.8423129.22710
70.8164478.94370
80.78988.65180
90.7667188.3990
100.7435868.14560
110.7229077.9190
120.7006377.67510
130.6751797.39620
140.6498347.11860
150.6222476.81640
160.5944656.5120
170.5678066.220
180.5415125.9320
190.5156235.64840
200.4892595.35960
210.4665485.11081e-06
220.4446314.87072e-06
230.4250514.65624e-06
240.4040824.42651.1e-05
250.3812884.17682.8e-05
260.3591693.93457e-05
270.3347333.66680.000184
280.3102513.39860.00046
290.2869823.14370.001051
300.2639382.89130.002278
310.2401662.63090.004817
320.2159122.36520.009812
330.1953362.13980.017198
340.1754091.92150.02852
350.1575821.72620.04344
360.1390191.52290.06521
370.1191121.30480.097228
380.1001571.09720.137384
390.0790290.86570.194185
400.0579970.63530.263214
410.0382730.41930.337887
420.0181420.19870.421401
43-0.001972-0.02160.491399
44-0.022262-0.24390.403875
45-0.039939-0.43750.331264
46-0.056615-0.62020.268154
47-0.071657-0.7850.21701
48-0.087163-0.95480.170793
49-0.103813-1.13720.128856
50-0.119634-1.31050.09626
51-0.136567-1.4960.068637
52-0.15392-1.68610.047187
53-0.169468-1.85640.032922
54-0.184434-2.02040.022785
55-0.199431-2.18470.015429
56-0.213686-2.34080.010446
57-0.225839-2.47390.007381
58-0.23756-2.60230.005213
59-0.248252-2.71950.003755
60-0.259063-2.83790.002667

\begin{tabular}{lllllllll}
\hline
Autocorrelation Function \tabularnewline
Time lag k & ACF(k) & T-STAT & P-value \tabularnewline
1 & 0.974719 & 10.6775 & 0 \tabularnewline
2 & 0.950395 & 10.4111 & 0 \tabularnewline
3 & 0.923516 & 10.1166 & 0 \tabularnewline
4 & 0.895875 & 9.8138 & 0 \tabularnewline
5 & 0.869073 & 9.5202 & 0 \tabularnewline
6 & 0.842312 & 9.2271 & 0 \tabularnewline
7 & 0.816447 & 8.9437 & 0 \tabularnewline
8 & 0.7898 & 8.6518 & 0 \tabularnewline
9 & 0.766718 & 8.399 & 0 \tabularnewline
10 & 0.743586 & 8.1456 & 0 \tabularnewline
11 & 0.722907 & 7.919 & 0 \tabularnewline
12 & 0.700637 & 7.6751 & 0 \tabularnewline
13 & 0.675179 & 7.3962 & 0 \tabularnewline
14 & 0.649834 & 7.1186 & 0 \tabularnewline
15 & 0.622247 & 6.8164 & 0 \tabularnewline
16 & 0.594465 & 6.512 & 0 \tabularnewline
17 & 0.567806 & 6.22 & 0 \tabularnewline
18 & 0.541512 & 5.932 & 0 \tabularnewline
19 & 0.515623 & 5.6484 & 0 \tabularnewline
20 & 0.489259 & 5.3596 & 0 \tabularnewline
21 & 0.466548 & 5.1108 & 1e-06 \tabularnewline
22 & 0.444631 & 4.8707 & 2e-06 \tabularnewline
23 & 0.425051 & 4.6562 & 4e-06 \tabularnewline
24 & 0.404082 & 4.4265 & 1.1e-05 \tabularnewline
25 & 0.381288 & 4.1768 & 2.8e-05 \tabularnewline
26 & 0.359169 & 3.9345 & 7e-05 \tabularnewline
27 & 0.334733 & 3.6668 & 0.000184 \tabularnewline
28 & 0.310251 & 3.3986 & 0.00046 \tabularnewline
29 & 0.286982 & 3.1437 & 0.001051 \tabularnewline
30 & 0.263938 & 2.8913 & 0.002278 \tabularnewline
31 & 0.240166 & 2.6309 & 0.004817 \tabularnewline
32 & 0.215912 & 2.3652 & 0.009812 \tabularnewline
33 & 0.195336 & 2.1398 & 0.017198 \tabularnewline
34 & 0.175409 & 1.9215 & 0.02852 \tabularnewline
35 & 0.157582 & 1.7262 & 0.04344 \tabularnewline
36 & 0.139019 & 1.5229 & 0.06521 \tabularnewline
37 & 0.119112 & 1.3048 & 0.097228 \tabularnewline
38 & 0.100157 & 1.0972 & 0.137384 \tabularnewline
39 & 0.079029 & 0.8657 & 0.194185 \tabularnewline
40 & 0.057997 & 0.6353 & 0.263214 \tabularnewline
41 & 0.038273 & 0.4193 & 0.337887 \tabularnewline
42 & 0.018142 & 0.1987 & 0.421401 \tabularnewline
43 & -0.001972 & -0.0216 & 0.491399 \tabularnewline
44 & -0.022262 & -0.2439 & 0.403875 \tabularnewline
45 & -0.039939 & -0.4375 & 0.331264 \tabularnewline
46 & -0.056615 & -0.6202 & 0.268154 \tabularnewline
47 & -0.071657 & -0.785 & 0.21701 \tabularnewline
48 & -0.087163 & -0.9548 & 0.170793 \tabularnewline
49 & -0.103813 & -1.1372 & 0.128856 \tabularnewline
50 & -0.119634 & -1.3105 & 0.09626 \tabularnewline
51 & -0.136567 & -1.496 & 0.068637 \tabularnewline
52 & -0.15392 & -1.6861 & 0.047187 \tabularnewline
53 & -0.169468 & -1.8564 & 0.032922 \tabularnewline
54 & -0.184434 & -2.0204 & 0.022785 \tabularnewline
55 & -0.199431 & -2.1847 & 0.015429 \tabularnewline
56 & -0.213686 & -2.3408 & 0.010446 \tabularnewline
57 & -0.225839 & -2.4739 & 0.007381 \tabularnewline
58 & -0.23756 & -2.6023 & 0.005213 \tabularnewline
59 & -0.248252 & -2.7195 & 0.003755 \tabularnewline
60 & -0.259063 & -2.8379 & 0.002667 \tabularnewline
\hline
\end{tabular}
%Source: https://freestatistics.org/blog/index.php?pk=235631&T=1

[TABLE]
[ROW][C]Autocorrelation Function[/C][/ROW]
[ROW][C]Time lag k[/C][C]ACF(k)[/C][C]T-STAT[/C][C]P-value[/C][/ROW]
[ROW][C]1[/C][C]0.974719[/C][C]10.6775[/C][C]0[/C][/ROW]
[ROW][C]2[/C][C]0.950395[/C][C]10.4111[/C][C]0[/C][/ROW]
[ROW][C]3[/C][C]0.923516[/C][C]10.1166[/C][C]0[/C][/ROW]
[ROW][C]4[/C][C]0.895875[/C][C]9.8138[/C][C]0[/C][/ROW]
[ROW][C]5[/C][C]0.869073[/C][C]9.5202[/C][C]0[/C][/ROW]
[ROW][C]6[/C][C]0.842312[/C][C]9.2271[/C][C]0[/C][/ROW]
[ROW][C]7[/C][C]0.816447[/C][C]8.9437[/C][C]0[/C][/ROW]
[ROW][C]8[/C][C]0.7898[/C][C]8.6518[/C][C]0[/C][/ROW]
[ROW][C]9[/C][C]0.766718[/C][C]8.399[/C][C]0[/C][/ROW]
[ROW][C]10[/C][C]0.743586[/C][C]8.1456[/C][C]0[/C][/ROW]
[ROW][C]11[/C][C]0.722907[/C][C]7.919[/C][C]0[/C][/ROW]
[ROW][C]12[/C][C]0.700637[/C][C]7.6751[/C][C]0[/C][/ROW]
[ROW][C]13[/C][C]0.675179[/C][C]7.3962[/C][C]0[/C][/ROW]
[ROW][C]14[/C][C]0.649834[/C][C]7.1186[/C][C]0[/C][/ROW]
[ROW][C]15[/C][C]0.622247[/C][C]6.8164[/C][C]0[/C][/ROW]
[ROW][C]16[/C][C]0.594465[/C][C]6.512[/C][C]0[/C][/ROW]
[ROW][C]17[/C][C]0.567806[/C][C]6.22[/C][C]0[/C][/ROW]
[ROW][C]18[/C][C]0.541512[/C][C]5.932[/C][C]0[/C][/ROW]
[ROW][C]19[/C][C]0.515623[/C][C]5.6484[/C][C]0[/C][/ROW]
[ROW][C]20[/C][C]0.489259[/C][C]5.3596[/C][C]0[/C][/ROW]
[ROW][C]21[/C][C]0.466548[/C][C]5.1108[/C][C]1e-06[/C][/ROW]
[ROW][C]22[/C][C]0.444631[/C][C]4.8707[/C][C]2e-06[/C][/ROW]
[ROW][C]23[/C][C]0.425051[/C][C]4.6562[/C][C]4e-06[/C][/ROW]
[ROW][C]24[/C][C]0.404082[/C][C]4.4265[/C][C]1.1e-05[/C][/ROW]
[ROW][C]25[/C][C]0.381288[/C][C]4.1768[/C][C]2.8e-05[/C][/ROW]
[ROW][C]26[/C][C]0.359169[/C][C]3.9345[/C][C]7e-05[/C][/ROW]
[ROW][C]27[/C][C]0.334733[/C][C]3.6668[/C][C]0.000184[/C][/ROW]
[ROW][C]28[/C][C]0.310251[/C][C]3.3986[/C][C]0.00046[/C][/ROW]
[ROW][C]29[/C][C]0.286982[/C][C]3.1437[/C][C]0.001051[/C][/ROW]
[ROW][C]30[/C][C]0.263938[/C][C]2.8913[/C][C]0.002278[/C][/ROW]
[ROW][C]31[/C][C]0.240166[/C][C]2.6309[/C][C]0.004817[/C][/ROW]
[ROW][C]32[/C][C]0.215912[/C][C]2.3652[/C][C]0.009812[/C][/ROW]
[ROW][C]33[/C][C]0.195336[/C][C]2.1398[/C][C]0.017198[/C][/ROW]
[ROW][C]34[/C][C]0.175409[/C][C]1.9215[/C][C]0.02852[/C][/ROW]
[ROW][C]35[/C][C]0.157582[/C][C]1.7262[/C][C]0.04344[/C][/ROW]
[ROW][C]36[/C][C]0.139019[/C][C]1.5229[/C][C]0.06521[/C][/ROW]
[ROW][C]37[/C][C]0.119112[/C][C]1.3048[/C][C]0.097228[/C][/ROW]
[ROW][C]38[/C][C]0.100157[/C][C]1.0972[/C][C]0.137384[/C][/ROW]
[ROW][C]39[/C][C]0.079029[/C][C]0.8657[/C][C]0.194185[/C][/ROW]
[ROW][C]40[/C][C]0.057997[/C][C]0.6353[/C][C]0.263214[/C][/ROW]
[ROW][C]41[/C][C]0.038273[/C][C]0.4193[/C][C]0.337887[/C][/ROW]
[ROW][C]42[/C][C]0.018142[/C][C]0.1987[/C][C]0.421401[/C][/ROW]
[ROW][C]43[/C][C]-0.001972[/C][C]-0.0216[/C][C]0.491399[/C][/ROW]
[ROW][C]44[/C][C]-0.022262[/C][C]-0.2439[/C][C]0.403875[/C][/ROW]
[ROW][C]45[/C][C]-0.039939[/C][C]-0.4375[/C][C]0.331264[/C][/ROW]
[ROW][C]46[/C][C]-0.056615[/C][C]-0.6202[/C][C]0.268154[/C][/ROW]
[ROW][C]47[/C][C]-0.071657[/C][C]-0.785[/C][C]0.21701[/C][/ROW]
[ROW][C]48[/C][C]-0.087163[/C][C]-0.9548[/C][C]0.170793[/C][/ROW]
[ROW][C]49[/C][C]-0.103813[/C][C]-1.1372[/C][C]0.128856[/C][/ROW]
[ROW][C]50[/C][C]-0.119634[/C][C]-1.3105[/C][C]0.09626[/C][/ROW]
[ROW][C]51[/C][C]-0.136567[/C][C]-1.496[/C][C]0.068637[/C][/ROW]
[ROW][C]52[/C][C]-0.15392[/C][C]-1.6861[/C][C]0.047187[/C][/ROW]
[ROW][C]53[/C][C]-0.169468[/C][C]-1.8564[/C][C]0.032922[/C][/ROW]
[ROW][C]54[/C][C]-0.184434[/C][C]-2.0204[/C][C]0.022785[/C][/ROW]
[ROW][C]55[/C][C]-0.199431[/C][C]-2.1847[/C][C]0.015429[/C][/ROW]
[ROW][C]56[/C][C]-0.213686[/C][C]-2.3408[/C][C]0.010446[/C][/ROW]
[ROW][C]57[/C][C]-0.225839[/C][C]-2.4739[/C][C]0.007381[/C][/ROW]
[ROW][C]58[/C][C]-0.23756[/C][C]-2.6023[/C][C]0.005213[/C][/ROW]
[ROW][C]59[/C][C]-0.248252[/C][C]-2.7195[/C][C]0.003755[/C][/ROW]
[ROW][C]60[/C][C]-0.259063[/C][C]-2.8379[/C][C]0.002667[/C][/ROW]
[/TABLE]
Source: https://freestatistics.org/blog/index.php?pk=235631&T=1

Globally Unique Identifier (entire table): ba.freestatistics.org/blog/index.php?pk=235631&T=1

As an alternative you can also use a QR Code:  

The GUIDs for individual cells are displayed in the table below:

Autocorrelation Function
Time lag kACF(k)T-STATP-value
10.97471910.67750
20.95039510.41110
30.92351610.11660
40.8958759.81380
50.8690739.52020
60.8423129.22710
70.8164478.94370
80.78988.65180
90.7667188.3990
100.7435868.14560
110.7229077.9190
120.7006377.67510
130.6751797.39620
140.6498347.11860
150.6222476.81640
160.5944656.5120
170.5678066.220
180.5415125.9320
190.5156235.64840
200.4892595.35960
210.4665485.11081e-06
220.4446314.87072e-06
230.4250514.65624e-06
240.4040824.42651.1e-05
250.3812884.17682.8e-05
260.3591693.93457e-05
270.3347333.66680.000184
280.3102513.39860.00046
290.2869823.14370.001051
300.2639382.89130.002278
310.2401662.63090.004817
320.2159122.36520.009812
330.1953362.13980.017198
340.1754091.92150.02852
350.1575821.72620.04344
360.1390191.52290.06521
370.1191121.30480.097228
380.1001571.09720.137384
390.0790290.86570.194185
400.0579970.63530.263214
410.0382730.41930.337887
420.0181420.19870.421401
43-0.001972-0.02160.491399
44-0.022262-0.24390.403875
45-0.039939-0.43750.331264
46-0.056615-0.62020.268154
47-0.071657-0.7850.21701
48-0.087163-0.95480.170793
49-0.103813-1.13720.128856
50-0.119634-1.31050.09626
51-0.136567-1.4960.068637
52-0.15392-1.68610.047187
53-0.169468-1.85640.032922
54-0.184434-2.02040.022785
55-0.199431-2.18470.015429
56-0.213686-2.34080.010446
57-0.225839-2.47390.007381
58-0.23756-2.60230.005213
59-0.248252-2.71950.003755
60-0.259063-2.83790.002667


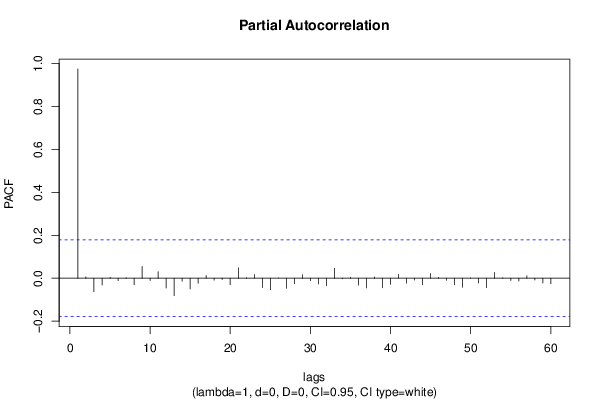
Partial Autocorrelation Function
Time lag kPACF(k)T-STATP-value
10.97471910.67750
20.0063630.06970.472272
3-0.0633-0.69340.244694
4-0.031196-0.34170.366575
50.0041730.04570.481808
6-0.011202-0.12270.451269
70.0020520.02250.491054
8-0.030056-0.32920.371273
90.0548230.60060.274635
10-0.010442-0.11440.454559
110.0302560.33140.370447
12-0.045711-0.50070.308734
13-0.08093-0.88650.188548
14-0.014014-0.15350.439123
15-0.049495-0.54220.294346
16-0.023276-0.2550.399589
170.0129680.14210.443637
18-0.008739-0.09570.461948
19-0.006112-0.0670.473366
20-0.030355-0.33250.370038
210.0483690.52990.298596
220.0021760.02380.490511
230.0173530.19010.424777
24-0.043153-0.47270.318635
25-0.053018-0.58080.281237
26-7.5e-05-8e-040.499672
27-0.046978-0.51460.303881
28-0.02507-0.27460.392035
290.0165130.18090.428379
30-0.011368-0.12450.450553
31-0.026357-0.28870.386645
32-0.035434-0.38820.349291
330.0459350.50320.307876
34-0.002603-0.02850.488649
350.0043030.04710.481242
36-0.032215-0.35290.362394
37-0.04508-0.49380.311167
380.0056730.06210.475274
39-0.044364-0.4860.313931
40-0.028297-0.310.37856
410.0185360.20310.41972
42-0.022838-0.25020.401439
43-0.008325-0.09120.463744
44-0.029997-0.32860.371514
450.0216440.23710.406493
460.0039340.04310.482847
47-0.009768-0.1070.457482
48-0.030049-0.32920.3713
49-0.042049-0.46060.322951
500.0011240.01230.495098
51-0.022258-0.24380.403892
52-0.04387-0.48060.315848
530.0268460.29410.384599
540.0021450.02350.490645
55-0.010629-0.11640.453751
56-0.013258-0.14520.442385
570.011660.12770.449289
58-0.007906-0.08660.465566
59-0.022421-0.24560.403203
60-0.025422-0.27850.390558

\begin{tabular}{lllllllll}
\hline
Partial Autocorrelation Function \tabularnewline
Time lag k & PACF(k) & T-STAT & P-value \tabularnewline
1 & 0.974719 & 10.6775 & 0 \tabularnewline
2 & 0.006363 & 0.0697 & 0.472272 \tabularnewline
3 & -0.0633 & -0.6934 & 0.244694 \tabularnewline
4 & -0.031196 & -0.3417 & 0.366575 \tabularnewline
5 & 0.004173 & 0.0457 & 0.481808 \tabularnewline
6 & -0.011202 & -0.1227 & 0.451269 \tabularnewline
7 & 0.002052 & 0.0225 & 0.491054 \tabularnewline
8 & -0.030056 & -0.3292 & 0.371273 \tabularnewline
9 & 0.054823 & 0.6006 & 0.274635 \tabularnewline
10 & -0.010442 & -0.1144 & 0.454559 \tabularnewline
11 & 0.030256 & 0.3314 & 0.370447 \tabularnewline
12 & -0.045711 & -0.5007 & 0.308734 \tabularnewline
13 & -0.08093 & -0.8865 & 0.188548 \tabularnewline
14 & -0.014014 & -0.1535 & 0.439123 \tabularnewline
15 & -0.049495 & -0.5422 & 0.294346 \tabularnewline
16 & -0.023276 & -0.255 & 0.399589 \tabularnewline
17 & 0.012968 & 0.1421 & 0.443637 \tabularnewline
18 & -0.008739 & -0.0957 & 0.461948 \tabularnewline
19 & -0.006112 & -0.067 & 0.473366 \tabularnewline
20 & -0.030355 & -0.3325 & 0.370038 \tabularnewline
21 & 0.048369 & 0.5299 & 0.298596 \tabularnewline
22 & 0.002176 & 0.0238 & 0.490511 \tabularnewline
23 & 0.017353 & 0.1901 & 0.424777 \tabularnewline
24 & -0.043153 & -0.4727 & 0.318635 \tabularnewline
25 & -0.053018 & -0.5808 & 0.281237 \tabularnewline
26 & -7.5e-05 & -8e-04 & 0.499672 \tabularnewline
27 & -0.046978 & -0.5146 & 0.303881 \tabularnewline
28 & -0.02507 & -0.2746 & 0.392035 \tabularnewline
29 & 0.016513 & 0.1809 & 0.428379 \tabularnewline
30 & -0.011368 & -0.1245 & 0.450553 \tabularnewline
31 & -0.026357 & -0.2887 & 0.386645 \tabularnewline
32 & -0.035434 & -0.3882 & 0.349291 \tabularnewline
33 & 0.045935 & 0.5032 & 0.307876 \tabularnewline
34 & -0.002603 & -0.0285 & 0.488649 \tabularnewline
35 & 0.004303 & 0.0471 & 0.481242 \tabularnewline
36 & -0.032215 & -0.3529 & 0.362394 \tabularnewline
37 & -0.04508 & -0.4938 & 0.311167 \tabularnewline
38 & 0.005673 & 0.0621 & 0.475274 \tabularnewline
39 & -0.044364 & -0.486 & 0.313931 \tabularnewline
40 & -0.028297 & -0.31 & 0.37856 \tabularnewline
41 & 0.018536 & 0.2031 & 0.41972 \tabularnewline
42 & -0.022838 & -0.2502 & 0.401439 \tabularnewline
43 & -0.008325 & -0.0912 & 0.463744 \tabularnewline
44 & -0.029997 & -0.3286 & 0.371514 \tabularnewline
45 & 0.021644 & 0.2371 & 0.406493 \tabularnewline
46 & 0.003934 & 0.0431 & 0.482847 \tabularnewline
47 & -0.009768 & -0.107 & 0.457482 \tabularnewline
48 & -0.030049 & -0.3292 & 0.3713 \tabularnewline
49 & -0.042049 & -0.4606 & 0.322951 \tabularnewline
50 & 0.001124 & 0.0123 & 0.495098 \tabularnewline
51 & -0.022258 & -0.2438 & 0.403892 \tabularnewline
52 & -0.04387 & -0.4806 & 0.315848 \tabularnewline
53 & 0.026846 & 0.2941 & 0.384599 \tabularnewline
54 & 0.002145 & 0.0235 & 0.490645 \tabularnewline
55 & -0.010629 & -0.1164 & 0.453751 \tabularnewline
56 & -0.013258 & -0.1452 & 0.442385 \tabularnewline
57 & 0.01166 & 0.1277 & 0.449289 \tabularnewline
58 & -0.007906 & -0.0866 & 0.465566 \tabularnewline
59 & -0.022421 & -0.2456 & 0.403203 \tabularnewline
60 & -0.025422 & -0.2785 & 0.390558 \tabularnewline
\hline
\end{tabular}
%Source: https://freestatistics.org/blog/index.php?pk=235631&T=2

[TABLE]
[ROW][C]Partial Autocorrelation Function[/C][/ROW]
[ROW][C]Time lag k[/C][C]PACF(k)[/C][C]T-STAT[/C][C]P-value[/C][/ROW]
[ROW][C]1[/C][C]0.974719[/C][C]10.6775[/C][C]0[/C][/ROW]
[ROW][C]2[/C][C]0.006363[/C][C]0.0697[/C][C]0.472272[/C][/ROW]
[ROW][C]3[/C][C]-0.0633[/C][C]-0.6934[/C][C]0.244694[/C][/ROW]
[ROW][C]4[/C][C]-0.031196[/C][C]-0.3417[/C][C]0.366575[/C][/ROW]
[ROW][C]5[/C][C]0.004173[/C][C]0.0457[/C][C]0.481808[/C][/ROW]
[ROW][C]6[/C][C]-0.011202[/C][C]-0.1227[/C][C]0.451269[/C][/ROW]
[ROW][C]7[/C][C]0.002052[/C][C]0.0225[/C][C]0.491054[/C][/ROW]
[ROW][C]8[/C][C]-0.030056[/C][C]-0.3292[/C][C]0.371273[/C][/ROW]
[ROW][C]9[/C][C]0.054823[/C][C]0.6006[/C][C]0.274635[/C][/ROW]
[ROW][C]10[/C][C]-0.010442[/C][C]-0.1144[/C][C]0.454559[/C][/ROW]
[ROW][C]11[/C][C]0.030256[/C][C]0.3314[/C][C]0.370447[/C][/ROW]
[ROW][C]12[/C][C]-0.045711[/C][C]-0.5007[/C][C]0.308734[/C][/ROW]
[ROW][C]13[/C][C]-0.08093[/C][C]-0.8865[/C][C]0.188548[/C][/ROW]
[ROW][C]14[/C][C]-0.014014[/C][C]-0.1535[/C][C]0.439123[/C][/ROW]
[ROW][C]15[/C][C]-0.049495[/C][C]-0.5422[/C][C]0.294346[/C][/ROW]
[ROW][C]16[/C][C]-0.023276[/C][C]-0.255[/C][C]0.399589[/C][/ROW]
[ROW][C]17[/C][C]0.012968[/C][C]0.1421[/C][C]0.443637[/C][/ROW]
[ROW][C]18[/C][C]-0.008739[/C][C]-0.0957[/C][C]0.461948[/C][/ROW]
[ROW][C]19[/C][C]-0.006112[/C][C]-0.067[/C][C]0.473366[/C][/ROW]
[ROW][C]20[/C][C]-0.030355[/C][C]-0.3325[/C][C]0.370038[/C][/ROW]
[ROW][C]21[/C][C]0.048369[/C][C]0.5299[/C][C]0.298596[/C][/ROW]
[ROW][C]22[/C][C]0.002176[/C][C]0.0238[/C][C]0.490511[/C][/ROW]
[ROW][C]23[/C][C]0.017353[/C][C]0.1901[/C][C]0.424777[/C][/ROW]
[ROW][C]24[/C][C]-0.043153[/C][C]-0.4727[/C][C]0.318635[/C][/ROW]
[ROW][C]25[/C][C]-0.053018[/C][C]-0.5808[/C][C]0.281237[/C][/ROW]
[ROW][C]26[/C][C]-7.5e-05[/C][C]-8e-04[/C][C]0.499672[/C][/ROW]
[ROW][C]27[/C][C]-0.046978[/C][C]-0.5146[/C][C]0.303881[/C][/ROW]
[ROW][C]28[/C][C]-0.02507[/C][C]-0.2746[/C][C]0.392035[/C][/ROW]
[ROW][C]29[/C][C]0.016513[/C][C]0.1809[/C][C]0.428379[/C][/ROW]
[ROW][C]30[/C][C]-0.011368[/C][C]-0.1245[/C][C]0.450553[/C][/ROW]
[ROW][C]31[/C][C]-0.026357[/C][C]-0.2887[/C][C]0.386645[/C][/ROW]
[ROW][C]32[/C][C]-0.035434[/C][C]-0.3882[/C][C]0.349291[/C][/ROW]
[ROW][C]33[/C][C]0.045935[/C][C]0.5032[/C][C]0.307876[/C][/ROW]
[ROW][C]34[/C][C]-0.002603[/C][C]-0.0285[/C][C]0.488649[/C][/ROW]
[ROW][C]35[/C][C]0.004303[/C][C]0.0471[/C][C]0.481242[/C][/ROW]
[ROW][C]36[/C][C]-0.032215[/C][C]-0.3529[/C][C]0.362394[/C][/ROW]
[ROW][C]37[/C][C]-0.04508[/C][C]-0.4938[/C][C]0.311167[/C][/ROW]
[ROW][C]38[/C][C]0.005673[/C][C]0.0621[/C][C]0.475274[/C][/ROW]
[ROW][C]39[/C][C]-0.044364[/C][C]-0.486[/C][C]0.313931[/C][/ROW]
[ROW][C]40[/C][C]-0.028297[/C][C]-0.31[/C][C]0.37856[/C][/ROW]
[ROW][C]41[/C][C]0.018536[/C][C]0.2031[/C][C]0.41972[/C][/ROW]
[ROW][C]42[/C][C]-0.022838[/C][C]-0.2502[/C][C]0.401439[/C][/ROW]
[ROW][C]43[/C][C]-0.008325[/C][C]-0.0912[/C][C]0.463744[/C][/ROW]
[ROW][C]44[/C][C]-0.029997[/C][C]-0.3286[/C][C]0.371514[/C][/ROW]
[ROW][C]45[/C][C]0.021644[/C][C]0.2371[/C][C]0.406493[/C][/ROW]
[ROW][C]46[/C][C]0.003934[/C][C]0.0431[/C][C]0.482847[/C][/ROW]
[ROW][C]47[/C][C]-0.009768[/C][C]-0.107[/C][C]0.457482[/C][/ROW]
[ROW][C]48[/C][C]-0.030049[/C][C]-0.3292[/C][C]0.3713[/C][/ROW]
[ROW][C]49[/C][C]-0.042049[/C][C]-0.4606[/C][C]0.322951[/C][/ROW]
[ROW][C]50[/C][C]0.001124[/C][C]0.0123[/C][C]0.495098[/C][/ROW]
[ROW][C]51[/C][C]-0.022258[/C][C]-0.2438[/C][C]0.403892[/C][/ROW]
[ROW][C]52[/C][C]-0.04387[/C][C]-0.4806[/C][C]0.315848[/C][/ROW]
[ROW][C]53[/C][C]0.026846[/C][C]0.2941[/C][C]0.384599[/C][/ROW]
[ROW][C]54[/C][C]0.002145[/C][C]0.0235[/C][C]0.490645[/C][/ROW]
[ROW][C]55[/C][C]-0.010629[/C][C]-0.1164[/C][C]0.453751[/C][/ROW]
[ROW][C]56[/C][C]-0.013258[/C][C]-0.1452[/C][C]0.442385[/C][/ROW]
[ROW][C]57[/C][C]0.01166[/C][C]0.1277[/C][C]0.449289[/C][/ROW]
[ROW][C]58[/C][C]-0.007906[/C][C]-0.0866[/C][C]0.465566[/C][/ROW]
[ROW][C]59[/C][C]-0.022421[/C][C]-0.2456[/C][C]0.403203[/C][/ROW]
[ROW][C]60[/C][C]-0.025422[/C][C]-0.2785[/C][C]0.390558[/C][/ROW]
[/TABLE]
Source: https://freestatistics.org/blog/index.php?pk=235631&T=2

Globally Unique Identifier (entire table): ba.freestatistics.org/blog/index.php?pk=235631&T=2

As an alternative you can also use a QR Code:  

The GUIDs for individual cells are displayed in the table below:

Partial Autocorrelation Function
Time lag kPACF(k)T-STATP-value
10.97471910.67750
20.0063630.06970.472272
3-0.0633-0.69340.244694
4-0.031196-0.34170.366575
50.0041730.04570.481808
6-0.011202-0.12270.451269
70.0020520.02250.491054
8-0.030056-0.32920.371273
90.0548230.60060.274635
10-0.010442-0.11440.454559
110.0302560.33140.370447
12-0.045711-0.50070.308734
13-0.08093-0.88650.188548
14-0.014014-0.15350.439123
15-0.049495-0.54220.294346
16-0.023276-0.2550.399589
170.0129680.14210.443637
18-0.008739-0.09570.461948
19-0.006112-0.0670.473366
20-0.030355-0.33250.370038
210.0483690.52990.298596
220.0021760.02380.490511
230.0173530.19010.424777
24-0.043153-0.47270.318635
25-0.053018-0.58080.281237
26-7.5e-05-8e-040.499672
27-0.046978-0.51460.303881
28-0.02507-0.27460.392035
290.0165130.18090.428379
30-0.011368-0.12450.450553
31-0.026357-0.28870.386645
32-0.035434-0.38820.349291
330.0459350.50320.307876
34-0.002603-0.02850.488649
350.0043030.04710.481242
36-0.032215-0.35290.362394
37-0.04508-0.49380.311167
380.0056730.06210.475274
39-0.044364-0.4860.313931
40-0.028297-0.310.37856
410.0185360.20310.41972
42-0.022838-0.25020.401439
43-0.008325-0.09120.463744
44-0.029997-0.32860.371514
450.0216440.23710.406493
460.0039340.04310.482847
47-0.009768-0.1070.457482
48-0.030049-0.32920.3713
49-0.042049-0.46060.322951
500.0011240.01230.495098
51-0.022258-0.24380.403892
52-0.04387-0.48060.315848
530.0268460.29410.384599
540.0021450.02350.490645
55-0.010629-0.11640.453751
56-0.013258-0.14520.442385
570.011660.12770.449289
58-0.007906-0.08660.465566
59-0.022421-0.24560.403203
60-0.025422-0.27850.390558


Parameters (Session):
par1 = 48 ; par2 = 1 ; par3 = 0 ; par4 = 0 ; par5 = 12 ; par6 = White Noise ; par7 = 0.95 ;
Parameters (R input):
par1 = 60 ; par2 = 1 ; par3 = 0 ; par4 = 0 ; par5 = 12 ; par6 = White Noise ; par7 = 0.95 ; par8 = ;
R code (references can be found in the software module):
par8 <- ''
par7 <- '0.95'
par6 <- 'White Noise'
par5 <- '12'
par4 <- '0'
par3 <- '0'
par2 <- '1'
par1 <- '60'
if (par1 == 'Default') {
par1 = 10*log10(length(x))
} else {
par1 <- as.numeric(par1)
}
par2 <- as.numeric(par2)
par3 <- as.numeric(par3)
par4 <- as.numeric(par4)
par5 <- as.numeric(par5)
if (par6 == 'White Noise') par6 <- 'white' else par6 <- 'ma'
par7 <- as.numeric(par7)
if (par8 != '') par8 <- as.numeric(par8)
ox <- x
if (par8 == '') {
if (par2 == 0) {
x <- log(x)
} else {
x <- (x ^ par2 - 1) / par2
}
} else {
x <- log(x,base=par8)
}
if (par3 > 0) x <- diff(x,lag=1,difference=par3)
if (par4 > 0) x <- diff(x,lag=par5,difference=par4)
bitmap(file='picts.png')
op <- par(mfrow=c(2,1))
plot(ox,type='l',main='Original Time Series',xlab='time',ylab='value')
if (par8=='') {
mytitle <- paste('Working Time Series (lambda=',par2,', d=',par3,', D=',par4,')',sep='')
mysub <- paste('(lambda=',par2,', d=',par3,', D=',par4,', CI=', par7, ', CI type=',par6,')',sep='')
} else {
mytitle <- paste('Working Time Series (base=',par8,', d=',par3,', D=',par4,')',sep='')
mysub <- paste('(base=',par8,', d=',par3,', D=',par4,', CI=', par7, ', CI type=',par6,')',sep='')
}
plot(x,type='l', main=mytitle,xlab='time',ylab='value')
par(op)
dev.off()
bitmap(file='pic1.png')
racf <- acf(x, par1, main='Autocorrelation', xlab='time lag', ylab='ACF', ci.type=par6, ci=par7, sub=mysub)
dev.off()
bitmap(file='pic2.png')
rpacf <- pacf(x,par1,main='Partial Autocorrelation',xlab='lags',ylab='PACF',sub=mysub)
dev.off()
(myacf <- c(racf$acf))
(mypacf <- c(rpacf$acf))
lengthx <- length(x)
sqrtn <- sqrt(lengthx)
load(file='createtable')
a<-table.start()
a<-table.row.start(a)
a<-table.element(a,'Autocorrelation Function',4,TRUE)
a<-table.row.end(a)
a<-table.row.start(a)
a<-table.element(a,'Time lag k',header=TRUE)
a<-table.element(a,hyperlink('basics.htm','ACF(k)','click here for more information about the Autocorrelation Function'),header=TRUE)
a<-table.element(a,'T-STAT',header=TRUE)
a<-table.element(a,'P-value',header=TRUE)
a<-table.row.end(a)
for (i in 2:(par1+1)) {
a<-table.row.start(a)
a<-table.element(a,i-1,header=TRUE)
a<-table.element(a,round(myacf[i],6))
mytstat <- myacf[i]*sqrtn
a<-table.element(a,round(mytstat,4))
a<-table.element(a,round(1-pt(abs(mytstat),lengthx),6))
a<-table.row.end(a)
}
a<-table.end(a)
table.save(a,file='mytable.tab')
a<-table.start()
a<-table.row.start(a)
a<-table.element(a,'Partial Autocorrelation Function',4,TRUE)
a<-table.row.end(a)
a<-table.row.start(a)
a<-table.element(a,'Time lag k',header=TRUE)
a<-table.element(a,hyperlink('basics.htm','PACF(k)','click here for more information about the Partial Autocorrelation Function'),header=TRUE)
a<-table.element(a,'T-STAT',header=TRUE)
a<-table.element(a,'P-value',header=TRUE)
a<-table.row.end(a)
for (i in 1:par1) {
a<-table.row.start(a)
a<-table.element(a,i,header=TRUE)
a<-table.element(a,round(mypacf[i],6))
mytstat <- mypacf[i]*sqrtn
a<-table.element(a,round(mytstat,4))
a<-table.element(a,round(1-pt(abs(mytstat),lengthx),6))
a<-table.row.end(a)
}
a<-table.end(a)
table.save(a,file='mytable1.tab')