Free Statistics

of Irreproducible Research!

Author's title

Author*Unverified author*
R Software Modulerwasp_cross.wasp
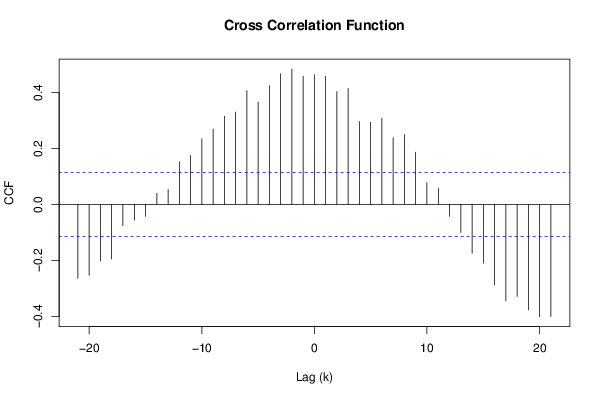
Title produced by softwareCross Correlation Function
Date of computationSun, 17 Aug 2014 11:51:24 +0100
Cite this page as followsStatistical Computations at FreeStatistics.org, Office for Research Development and Education, URL https://freestatistics.org/blog/index.php?v=date/2014/Aug/17/t1408273098z5sxv4u4uxfx128.htm/, Retrieved Fri, 17 May 2024 05:35:46 +0000
Statistical Computations at FreeStatistics.org, Office for Research Development and Education, URL https://freestatistics.org/blog/index.php?pk=235610, Retrieved Fri, 17 May 2024 05:35:46 +0000
QR Codes:

Original text written by user:none
IsPrivate?No (this computation is public)
User-defined keywordselectrons
Estimated Impact95
Family? (F = Feedback message, R = changed R code, M = changed R Module, P = changed Parameters, D = changed Data)
-       [Cross Correlation Function] [stereo a and b] [2014-08-17 10:51:24] [d41d8cd98f00b204e9800998ecf8427e] [Current]
Feedback Forum

Post a new message
Dataseries X:
0.0307
0.0286
0.0279
0.031
0.0304
0.0324
0.0312
0.0315
0.0317
0.0339
0.0323
0.0341
0.0316
0.0335
0.0376
0.0363
0.036
0.0357
0.0322
0.0343
0.0345
0.0337
0.0361
0.0314
0.0309
0.0318
0.0315
0.0289
0.0279
0.0309
0.0299
0.029
0.0313
0.0285
0.0281
0.0305
0.0279
0.0262
0.0283
0.0317
0.0281
0.0321
0.0284
0.028
0.0299
0.0323
0.029
0.03
0.0313
0.0304
0.0323
0.0319
0.0306
0.0308
0.0327
0.0338
0.0356
0.0344
0.0333
0.0355
0.0332
0.0338
0.0332
0.0318
0.0357
0.0349
0.0316
0.0325
0.0321
0.0311
0.0353
0.0321
0.0305
0.0328
0.0304
0.0301
0.0295
0.0287
0.0297
0.031
0.0292
0.0299
0.0296
0.0306
0.0299
0.0305
0.028
0.0279
0.0293
0.0271
0.0259
0.0291
0.0299
0.0287
0.0285
0.0284
0.0309
0.0315
0.0326
0.0337
0.031
0.0334
0.036
0.0323
0.0363
0.0328
0.0335
0.0339
0.033
0.0351
0.0344
0.0337
0.0312
0.0311
0.0349
0.0322
0.0309
0.0308
0.0319
0.0312
0.0293
0.0311
0.0321
0.0309
0.0325
0.0297
0.034
0.0328
0.0285
0.0302
0.0337
0.0309
0.0305
0.0305
0.0295
0.0311
0.034
0.0295
0.0283
0.0303
0.0305
0.0331
0.0278
0.0296
0.0302
0.0296
0.0314
0.0317
0.0322
0.0308
0.0304
0.0313
0.0314
0.0324
0.0318
0.0337
0.0327
0.0374
0.038
0.0364
0.0349
0.0345
0.0336
0.0323
0.031
0.0338
0.0316
0.0306
0.0305
0.0323
0.0301
0.0333
0.0318
0.0308
0.0308
0.0302
0.0305
0.0307
0.0319
0.0313
0.0296
0.0297
0.0302
0.0313
0.0313
0.0296
0.0309
0.0307
0.0297
0.029
0.0294
0.0319
0.0326
0.032
0.0363
0.0332
0.0351
0.0355
0.0307
0.0334
0.0323
0.0323
0.0347
0.0314
0.0327
0.032
0.0334
0.0334
0.0327
0.0312
0.0332
0.0309
0.0331
0.0329
0.0345
0.0321
0.0326
0.0315
0.0324
0.0307
0.0321
0.0321
0.03
0.0292
0.0328
0.0291
0.0304
0.0301
0.0287
0.0314
0.0279
0.0292
0.0284
0.0302
0.0293
0.0298
0.0304
0.0295
0.0311
0.0293
0.0303
0.0317
0.0277
0.0302
0.0276
0.0311
0.0294
0.0289
0.0306
0.0321
0.0286
0.0303
0.029
0.0314
0.0308
0.0314
0.0331
0.0314
0.0336
0.0302
0.0313
0.0296
0.0335
0.0311
0.0309
0.0317
0.0322
0.0327
0.0317
0.0319
0.0322
0.0321
0.0311
0.0313
0.0286
0.0303
0.0304
0.0305
0.0307
0.0286
0.0293
0.0304
0.0305
0.0291
0.0302
0.0307
0.029
0.031
0.0309
0.0298
0.0298
0.0295
0.0308
Dataseries Y:
0.0357
0.0332
0.037
0.0345
0.037
0.0373
0.0393
0.0385
0.042
0.0411
0.0392
0.0414
0.0449
0.0394
0.0415
0.0406
0.0391
0.0391
0.0349
0.0381
0.0381
0.036
0.0381
0.0375
0.0379
0.0362
0.0381
0.0358
0.0363
0.0335
0.034
0.0361
0.0352
0.0367
0.0329
0.0325
0.0347
0.0348
0.0366
0.0342
0.0341
0.0337
0.0356
0.037
0.0338
0.0347
0.0334
0.0361
0.0333
0.0327
0.0342
0.0363
0.0351
0.0369
0.0418
0.0391
0.04
0.0413
0.0422
0.0418
0.0393
0.0409
0.0396
0.0391
0.0409
0.04
0.0379
0.0392
0.0374
0.0376
0.0399
0.0395
0.0389
0.0376
0.0358
0.0363
0.0387
0.0357
0.0339
0.0355
0.0352
0.0328
0.0322
0.0338
0.0331
0.0329
0.0337
0.0346
0.0338
0.0316
0.0339
0.0345
0.034
0.034
0.0335
0.0339
0.0378
0.0329
0.0365
0.0357
0.0356
0.0356
0.0391
0.0374
0.0345
0.0348
0.0385
0.0345
0.0392
0.0381
0.0386
0.0409
0.0409
0.0374
0.0377
0.0359
0.0403
0.0382
0.0407
0.0369
0.0396
0.0381
0.0363
0.0386
0.0362
0.0369
0.0378
0.0354
0.038
0.0384
0.0377
0.0355
0.0371
0.0352
0.0357
0.036
0.0368
0.0334
0.0361
0.0332
0.0341
0.0337
0.0341
0.0382
0.0351
0.0339
0.0359
0.0359
0.0366
0.0385
0.0366
0.0377
0.033
0.0367
0.0352
0.0336
0.0345
0.0376
0.0368
0.0342
0.0373
0.0381
0.0403
0.0399
0.0379
0.038
0.0382
0.0349
0.0379
0.0357
0.0382
0.0347
0.0379
0.0381
0.0383
0.0361
0.0351
0.0358
0.0353
0.0349
0.0355
0.0349
0.0351
0.0355
0.0376
0.0363
0.0358
0.0356
0.0381
0.0339
0.0351
0.0344
0.0346
0.0369
0.0385
0.0377
0.0383
0.0375
0.0374
0.0405
0.0376
0.0385
0.0391
0.0438
0.0409
0.0447
0.0421
0.0412
0.0378
0.0365
0.0364
0.0372
0.0392
0.0382
0.038
0.0367
0.0359
0.0361
0.0391
0.035
0.0374
0.0375
0.0351
0.0357
0.0357
0.0368
0.0375
0.038
0.0347
0.0353
0.0392
0.0359
0.0358
0.0337
0.0366
0.0367
0.0358
0.0371
0.0368
0.0341
0.0341
0.0359
0.0332
0.0343
0.035
0.0328
0.0333
0.0382
0.0348
0.0388
0.036
0.0357
0.0365
0.0362
0.0336
0.0386
0.0364
0.0373
0.0363
0.0363
0.0379
0.0389
0.0376
0.0374
0.0359
0.0382
0.0384
0.0365
0.0377
0.0332
0.035
0.0343
0.0384
0.035
0.0371
0.0348
0.0371
0.0345
0.034
0.0367
0.0327
0.0338
0.0346
0.0346
0.0347
0.0353
0.0367
0.0338
0.0357
0.0343
0.0347
0.0355
0.0363


Summary of computational transaction
Raw Inputview raw input (R code)
Raw Outputview raw output of R engine
Computing time1 seconds
R Server'Gertrude Mary Cox' @ cox.wessa.net

\begin{tabular}{lllllllll}
\hline
Summary of computational transaction \tabularnewline
Raw Input & view raw input (R code)  \tabularnewline
Raw Output & view raw output of R engine  \tabularnewline
Computing time & 1 seconds \tabularnewline
R Server & 'Gertrude Mary Cox' @ cox.wessa.net \tabularnewline
\hline
\end{tabular}
%Source: https://freestatistics.org/blog/index.php?pk=235610&T=0

[TABLE]
[ROW][C]Summary of computational transaction[/C][/ROW]
[ROW][C]Raw Input[/C][C]view raw input (R code) [/C][/ROW]
[ROW][C]Raw Output[/C][C]view raw output of R engine [/C][/ROW]
[ROW][C]Computing time[/C][C]1 seconds[/C][/ROW]
[ROW][C]R Server[/C][C]'Gertrude Mary Cox' @ cox.wessa.net[/C][/ROW]
[/TABLE]
Source: https://freestatistics.org/blog/index.php?pk=235610&T=0

Globally Unique Identifier (entire table): ba.freestatistics.org/blog/index.php?pk=235610&T=0

As an alternative you can also use a QR Code:  

The GUIDs for individual cells are displayed in the table below:

Summary of computational transaction
Raw Inputview raw input (R code)
Raw Outputview raw output of R engine
Computing time1 seconds
R Server'Gertrude Mary Cox' @ cox.wessa.net


Cross Correlation Function
ParameterValue
Box-Cox transformation parameter (lambda) of X series1
Degree of non-seasonal differencing (d) of X series0
Degree of seasonal differencing (D) of X series0
Seasonal Period (s)1
Box-Cox transformation parameter (lambda) of Y series1
Degree of non-seasonal differencing (d) of Y series0
Degree of seasonal differencing (D) of Y series0
krho(Y[t],X[t+k])
-21-0.263647129065004
-20-0.252588286304349
-19-0.201259208684187
-18-0.194304612703148
-17-0.0752768849781644
-16-0.0557114570119083
-15-0.0419657102348521
-140.0403365350541239
-130.0539508171174188
-120.152764133507995
-110.175014413963637
-100.234868779082198
-90.26932791150281
-80.31547609619454
-70.330209343115094
-60.407614164028277
-50.366536286426413
-40.424890508197208
-30.467375643692519
-20.484258270696404
-10.458406898169776
00.463945010166351
10.457212551622175
20.404010906936003
30.414482768639966
40.296355160320595
50.293711108859074
60.308534354783146
70.238074501482225
80.250264636336643
90.18650759889524
100.0782317572746538
110.0587242491641442
12-0.0416115626766807
13-0.0994165477264424
14-0.173689760360127
15-0.209335176350071
16-0.287723251222931
17-0.344193312414584
18-0.328144326808579
19-0.376268561405779
20-0.40046638508336
21-0.400260340710871

\begin{tabular}{lllllllll}
\hline
Cross Correlation Function \tabularnewline
Parameter & Value \tabularnewline
Box-Cox transformation parameter (lambda) of X series & 1 \tabularnewline
Degree of non-seasonal differencing (d) of X series & 0 \tabularnewline
Degree of seasonal differencing (D) of X series & 0 \tabularnewline
Seasonal Period (s) & 1 \tabularnewline
Box-Cox transformation parameter (lambda) of Y series & 1 \tabularnewline
Degree of non-seasonal differencing (d) of Y series & 0 \tabularnewline
Degree of seasonal differencing (D) of Y series & 0 \tabularnewline
k & rho(Y[t],X[t+k]) \tabularnewline
-21 & -0.263647129065004 \tabularnewline
-20 & -0.252588286304349 \tabularnewline
-19 & -0.201259208684187 \tabularnewline
-18 & -0.194304612703148 \tabularnewline
-17 & -0.0752768849781644 \tabularnewline
-16 & -0.0557114570119083 \tabularnewline
-15 & -0.0419657102348521 \tabularnewline
-14 & 0.0403365350541239 \tabularnewline
-13 & 0.0539508171174188 \tabularnewline
-12 & 0.152764133507995 \tabularnewline
-11 & 0.175014413963637 \tabularnewline
-10 & 0.234868779082198 \tabularnewline
-9 & 0.26932791150281 \tabularnewline
-8 & 0.31547609619454 \tabularnewline
-7 & 0.330209343115094 \tabularnewline
-6 & 0.407614164028277 \tabularnewline
-5 & 0.366536286426413 \tabularnewline
-4 & 0.424890508197208 \tabularnewline
-3 & 0.467375643692519 \tabularnewline
-2 & 0.484258270696404 \tabularnewline
-1 & 0.458406898169776 \tabularnewline
0 & 0.463945010166351 \tabularnewline
1 & 0.457212551622175 \tabularnewline
2 & 0.404010906936003 \tabularnewline
3 & 0.414482768639966 \tabularnewline
4 & 0.296355160320595 \tabularnewline
5 & 0.293711108859074 \tabularnewline
6 & 0.308534354783146 \tabularnewline
7 & 0.238074501482225 \tabularnewline
8 & 0.250264636336643 \tabularnewline
9 & 0.18650759889524 \tabularnewline
10 & 0.0782317572746538 \tabularnewline
11 & 0.0587242491641442 \tabularnewline
12 & -0.0416115626766807 \tabularnewline
13 & -0.0994165477264424 \tabularnewline
14 & -0.173689760360127 \tabularnewline
15 & -0.209335176350071 \tabularnewline
16 & -0.287723251222931 \tabularnewline
17 & -0.344193312414584 \tabularnewline
18 & -0.328144326808579 \tabularnewline
19 & -0.376268561405779 \tabularnewline
20 & -0.40046638508336 \tabularnewline
21 & -0.400260340710871 \tabularnewline
\hline
\end{tabular}
%Source: https://freestatistics.org/blog/index.php?pk=235610&T=1

[TABLE]
[ROW][C]Cross Correlation Function[/C][/ROW]
[ROW][C]Parameter[/C][C]Value[/C][/ROW]
[ROW][C]Box-Cox transformation parameter (lambda) of X series[/C][C]1[/C][/ROW]
[ROW][C]Degree of non-seasonal differencing (d) of X series[/C][C]0[/C][/ROW]
[ROW][C]Degree of seasonal differencing (D) of X series[/C][C]0[/C][/ROW]
[ROW][C]Seasonal Period (s)[/C][C]1[/C][/ROW]
[ROW][C]Box-Cox transformation parameter (lambda) of Y series[/C][C]1[/C][/ROW]
[ROW][C]Degree of non-seasonal differencing (d) of Y series[/C][C]0[/C][/ROW]
[ROW][C]Degree of seasonal differencing (D) of Y series[/C][C]0[/C][/ROW]
[ROW][C]k[/C][C]rho(Y[t],X[t+k])[/C][/ROW]
[ROW][C]-21[/C][C]-0.263647129065004[/C][/ROW]
[ROW][C]-20[/C][C]-0.252588286304349[/C][/ROW]
[ROW][C]-19[/C][C]-0.201259208684187[/C][/ROW]
[ROW][C]-18[/C][C]-0.194304612703148[/C][/ROW]
[ROW][C]-17[/C][C]-0.0752768849781644[/C][/ROW]
[ROW][C]-16[/C][C]-0.0557114570119083[/C][/ROW]
[ROW][C]-15[/C][C]-0.0419657102348521[/C][/ROW]
[ROW][C]-14[/C][C]0.0403365350541239[/C][/ROW]
[ROW][C]-13[/C][C]0.0539508171174188[/C][/ROW]
[ROW][C]-12[/C][C]0.152764133507995[/C][/ROW]
[ROW][C]-11[/C][C]0.175014413963637[/C][/ROW]
[ROW][C]-10[/C][C]0.234868779082198[/C][/ROW]
[ROW][C]-9[/C][C]0.26932791150281[/C][/ROW]
[ROW][C]-8[/C][C]0.31547609619454[/C][/ROW]
[ROW][C]-7[/C][C]0.330209343115094[/C][/ROW]
[ROW][C]-6[/C][C]0.407614164028277[/C][/ROW]
[ROW][C]-5[/C][C]0.366536286426413[/C][/ROW]
[ROW][C]-4[/C][C]0.424890508197208[/C][/ROW]
[ROW][C]-3[/C][C]0.467375643692519[/C][/ROW]
[ROW][C]-2[/C][C]0.484258270696404[/C][/ROW]
[ROW][C]-1[/C][C]0.458406898169776[/C][/ROW]
[ROW][C]0[/C][C]0.463945010166351[/C][/ROW]
[ROW][C]1[/C][C]0.457212551622175[/C][/ROW]
[ROW][C]2[/C][C]0.404010906936003[/C][/ROW]
[ROW][C]3[/C][C]0.414482768639966[/C][/ROW]
[ROW][C]4[/C][C]0.296355160320595[/C][/ROW]
[ROW][C]5[/C][C]0.293711108859074[/C][/ROW]
[ROW][C]6[/C][C]0.308534354783146[/C][/ROW]
[ROW][C]7[/C][C]0.238074501482225[/C][/ROW]
[ROW][C]8[/C][C]0.250264636336643[/C][/ROW]
[ROW][C]9[/C][C]0.18650759889524[/C][/ROW]
[ROW][C]10[/C][C]0.0782317572746538[/C][/ROW]
[ROW][C]11[/C][C]0.0587242491641442[/C][/ROW]
[ROW][C]12[/C][C]-0.0416115626766807[/C][/ROW]
[ROW][C]13[/C][C]-0.0994165477264424[/C][/ROW]
[ROW][C]14[/C][C]-0.173689760360127[/C][/ROW]
[ROW][C]15[/C][C]-0.209335176350071[/C][/ROW]
[ROW][C]16[/C][C]-0.287723251222931[/C][/ROW]
[ROW][C]17[/C][C]-0.344193312414584[/C][/ROW]
[ROW][C]18[/C][C]-0.328144326808579[/C][/ROW]
[ROW][C]19[/C][C]-0.376268561405779[/C][/ROW]
[ROW][C]20[/C][C]-0.40046638508336[/C][/ROW]
[ROW][C]21[/C][C]-0.400260340710871[/C][/ROW]
[/TABLE]
Source: https://freestatistics.org/blog/index.php?pk=235610&T=1

Globally Unique Identifier (entire table): ba.freestatistics.org/blog/index.php?pk=235610&T=1

As an alternative you can also use a QR Code:  

The GUIDs for individual cells are displayed in the table below:

Cross Correlation Function
ParameterValue
Box-Cox transformation parameter (lambda) of X series1
Degree of non-seasonal differencing (d) of X series0
Degree of seasonal differencing (D) of X series0
Seasonal Period (s)1
Box-Cox transformation parameter (lambda) of Y series1
Degree of non-seasonal differencing (d) of Y series0
Degree of seasonal differencing (D) of Y series0
krho(Y[t],X[t+k])
-21-0.263647129065004
-20-0.252588286304349
-19-0.201259208684187
-18-0.194304612703148
-17-0.0752768849781644
-16-0.0557114570119083
-15-0.0419657102348521
-140.0403365350541239
-130.0539508171174188
-120.152764133507995
-110.175014413963637
-100.234868779082198
-90.26932791150281
-80.31547609619454
-70.330209343115094
-60.407614164028277
-50.366536286426413
-40.424890508197208
-30.467375643692519
-20.484258270696404
-10.458406898169776
00.463945010166351
10.457212551622175
20.404010906936003
30.414482768639966
40.296355160320595
50.293711108859074
60.308534354783146
70.238074501482225
80.250264636336643
90.18650759889524
100.0782317572746538
110.0587242491641442
12-0.0416115626766807
13-0.0994165477264424
14-0.173689760360127
15-0.209335176350071
16-0.287723251222931
17-0.344193312414584
18-0.328144326808579
19-0.376268561405779
20-0.40046638508336
21-0.400260340710871


Parameters (Session):
par1 = 1 ; par2 = 0 ; par3 = 0 ; par4 = 1 ; par5 = 1 ; par6 = 0 ; par7 = 0 ; par8 = na.fail ;
Parameters (R input):
par1 = 1 ; par2 = 0 ; par3 = 0 ; par4 = 1 ; par5 = 1 ; par6 = 0 ; par7 = 0 ; par8 = na.fail ;
R code (references can be found in the software module):
par1 <- as.numeric(par1)
par2 <- as.numeric(par2)
par3 <- as.numeric(par3)
par4 <- as.numeric(par4)
par5 <- as.numeric(par5)
par6 <- as.numeric(par6)
par7 <- as.numeric(par7)
if (par8=='na.fail') par8 <- na.fail else par8 <- na.pass
ccf <- function (x, y, lag.max = NULL, type = c('correlation', 'covariance'), plot = TRUE, na.action = na.fail, ...) {
type <- match.arg(type)
if (is.matrix(x) || is.matrix(y))
stop('univariate time series only')
X <- na.action(ts.intersect(as.ts(x), as.ts(y)))
colnames(X) <- c(deparse(substitute(x))[1L], deparse(substitute(y))[1L])
acf.out <- acf(X, lag.max = lag.max, plot = FALSE, type = type, na.action=na.action)
lag <- c(rev(acf.out$lag[-1, 2, 1]), acf.out$lag[, 1, 2])
y <- c(rev(acf.out$acf[-1, 2, 1]), acf.out$acf[, 1, 2])
acf.out$acf <- array(y, dim = c(length(y), 1L, 1L))
acf.out$lag <- array(lag, dim = c(length(y), 1L, 1L))
acf.out$snames <- paste(acf.out$snames, collapse = ' & ')
if (plot) {
plot(acf.out, ...)
return(invisible(acf.out))
}
else return(acf.out)
}
if (par1 == 0) {
x <- log(x)
} else {
x <- (x ^ par1 - 1) / par1
}
if (par5 == 0) {
y <- log(y)
} else {
y <- (y ^ par5 - 1) / par5
}
if (par2 > 0) x <- diff(x,lag=1,difference=par2)
if (par6 > 0) y <- diff(y,lag=1,difference=par6)
if (par3 > 0) x <- diff(x,lag=par4,difference=par3)
if (par7 > 0) y <- diff(y,lag=par4,difference=par7)
x
y
bitmap(file='test1.png')
(r <- ccf(x,y,na.action=par8,main='Cross Correlation Function',ylab='CCF',xlab='Lag (k)'))
dev.off()
load(file='createtable')
a<-table.start()
a<-table.row.start(a)
a<-table.element(a,'Cross Correlation Function',2,TRUE)
a<-table.row.end(a)
a<-table.row.start(a)
a<-table.element(a,'Parameter',header=TRUE)
a<-table.element(a,'Value',header=TRUE)
a<-table.row.end(a)
a<-table.row.start(a)
a<-table.element(a,'Box-Cox transformation parameter (lambda) of X series',header=TRUE)
a<-table.element(a,par1)
a<-table.row.end(a)
a<-table.row.start(a)
a<-table.element(a,'Degree of non-seasonal differencing (d) of X series',header=TRUE)
a<-table.element(a,par2)
a<-table.row.end(a)
a<-table.row.start(a)
a<-table.element(a,'Degree of seasonal differencing (D) of X series',header=TRUE)
a<-table.element(a,par3)
a<-table.row.end(a)
a<-table.row.start(a)
a<-table.element(a,'Seasonal Period (s)',header=TRUE)
a<-table.element(a,par4)
a<-table.row.end(a)
a<-table.row.start(a)
a<-table.element(a,'Box-Cox transformation parameter (lambda) of Y series',header=TRUE)
a<-table.element(a,par5)
a<-table.row.end(a)
a<-table.row.start(a)
a<-table.element(a,'Degree of non-seasonal differencing (d) of Y series',header=TRUE)
a<-table.element(a,par6)
a<-table.row.end(a)
a<-table.row.start(a)
a<-table.element(a,'Degree of seasonal differencing (D) of Y series',header=TRUE)
a<-table.element(a,par7)
a<-table.row.end(a)
a<-table.row.start(a)
a<-table.element(a,'k',header=TRUE)
a<-table.element(a,'rho(Y[t],X[t+k])',header=TRUE)
a<-table.row.end(a)
mylength <- length(r$acf)
myhalf <- floor((mylength-1)/2)
for (i in 1:mylength) {
a<-table.row.start(a)
a<-table.element(a,i-myhalf-1,header=TRUE)
a<-table.element(a,r$acf[i])
a<-table.row.end(a)
}
a<-table.end(a)
table.save(a,file='mytable.tab')