Free Statistics

of Irreproducible Research!

Author's title

Author*Unverified author*
R Software Modulerwasp_smp.wasp
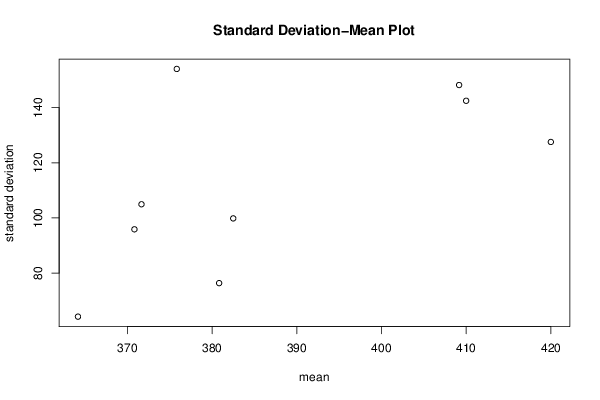
Title produced by softwareStandard Deviation-Mean Plot
Date of computationWed, 13 Aug 2014 17:03:38 +0100
Cite this page as followsStatistical Computations at FreeStatistics.org, Office for Research Development and Education, URL https://freestatistics.org/blog/index.php?v=date/2014/Aug/13/t14079458549hwo4j0z482ewbu.htm/, Retrieved Thu, 16 May 2024 01:47:44 +0000
Statistical Computations at FreeStatistics.org, Office for Research Development and Education, URL https://freestatistics.org/blog/index.php?pk=235544, Retrieved Thu, 16 May 2024 01:47:44 +0000
QR Codes:

Original text written by user:
IsPrivate?No (this computation is public)
User-defined keywordsBoeykens Brice
Estimated Impact89
Family? (F = Feedback message, R = changed R code, M = changed R Module, P = changed Parameters, D = changed Data)
-     [(Partial) Autocorrelation Function] [Tijdreeks B Stap 17] [2014-08-13 15:08:09] [2064a7ed2562130dd70fccaf2dd61d5a]
- RMP     [Standard Deviation-Mean Plot] [Tijdreeks B Stap 21] [2014-08-13 16:03:38] [7314f5de623f4497f735e8af2050bf2f] [Current]
Feedback Forum

Post a new message
Dataseries X:
330
310
310
380
330
250
370
380
430
360
440
480
260
340
270
400
330
340
360
480
490
420
430
450
300
320
260
330
260
330
350
500
570
450
420
360
280
360
260
370
200
320
390
480
570
450
460
320
310
410
230
450
230
310
430
540
450
430
480
320
310
380
210
450
120
210
410
660
510
510
450
290
320
380
260
530
180
260
460
620
540
610
460
290
330
440
350
450
240
280
540
540
600
590
410
270
370
350
340
420
210
180
580
560
610
560
410
330


Summary of computational transaction
Raw Inputview raw input (R code)
Raw Outputview raw output of R engine
Computing time1 seconds
R Server'Herman Ole Andreas Wold' @ wold.wessa.net

\begin{tabular}{lllllllll}
\hline
Summary of computational transaction \tabularnewline
Raw Input & view raw input (R code)  \tabularnewline
Raw Output & view raw output of R engine  \tabularnewline
Computing time & 1 seconds \tabularnewline
R Server & 'Herman Ole Andreas Wold' @ wold.wessa.net \tabularnewline
\hline
\end{tabular}
%Source: https://freestatistics.org/blog/index.php?pk=235544&T=0

[TABLE]
[ROW][C]Summary of computational transaction[/C][/ROW]
[ROW][C]Raw Input[/C][C]view raw input (R code) [/C][/ROW]
[ROW][C]Raw Output[/C][C]view raw output of R engine [/C][/ROW]
[ROW][C]Computing time[/C][C]1 seconds[/C][/ROW]
[ROW][C]R Server[/C][C]'Herman Ole Andreas Wold' @ wold.wessa.net[/C][/ROW]
[/TABLE]
Source: https://freestatistics.org/blog/index.php?pk=235544&T=0

Globally Unique Identifier (entire table): ba.freestatistics.org/blog/index.php?pk=235544&T=0

As an alternative you can also use a QR Code:  

The GUIDs for individual cells are displayed in the table below:

Summary of computational transaction
Raw Inputview raw input (R code)
Raw Outputview raw output of R engine
Computing time1 seconds
R Server'Herman Ole Andreas Wold' @ wold.wessa.net


Standard Deviation-Mean Plot
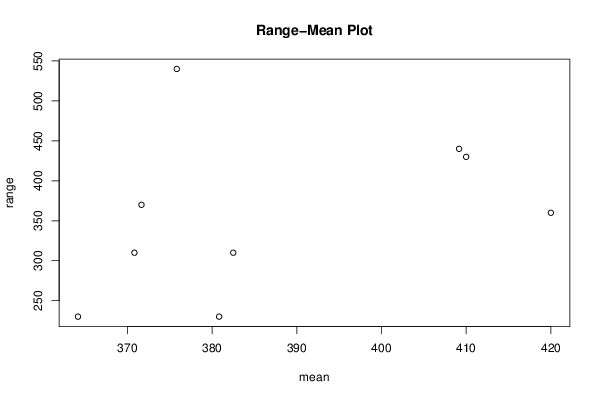
SectionMeanStandard DeviationRange
1364.16666666666764.1671585970911230
2380.83333333333376.3316130545867230
3370.83333333333395.8652779433279310
4371.666666666667104.953091975184370
5382.599.8293999326305310
6375.833333333333154.063642890223540
7409.166666666667148.229449492905440
8420127.564600390262360
9410142.509967753455430

\begin{tabular}{lllllllll}
\hline
Standard Deviation-Mean Plot \tabularnewline
Section & Mean & Standard Deviation & Range \tabularnewline
1 & 364.166666666667 & 64.1671585970911 & 230 \tabularnewline
2 & 380.833333333333 & 76.3316130545867 & 230 \tabularnewline
3 & 370.833333333333 & 95.8652779433279 & 310 \tabularnewline
4 & 371.666666666667 & 104.953091975184 & 370 \tabularnewline
5 & 382.5 & 99.8293999326305 & 310 \tabularnewline
6 & 375.833333333333 & 154.063642890223 & 540 \tabularnewline
7 & 409.166666666667 & 148.229449492905 & 440 \tabularnewline
8 & 420 & 127.564600390262 & 360 \tabularnewline
9 & 410 & 142.509967753455 & 430 \tabularnewline
\hline
\end{tabular}
%Source: https://freestatistics.org/blog/index.php?pk=235544&T=1

[TABLE]
[ROW][C]Standard Deviation-Mean Plot[/C][/ROW]
[ROW][C]Section[/C][C]Mean[/C][C]Standard Deviation[/C][C]Range[/C][/ROW]
[ROW][C]1[/C][C]364.166666666667[/C][C]64.1671585970911[/C][C]230[/C][/ROW]
[ROW][C]2[/C][C]380.833333333333[/C][C]76.3316130545867[/C][C]230[/C][/ROW]
[ROW][C]3[/C][C]370.833333333333[/C][C]95.8652779433279[/C][C]310[/C][/ROW]
[ROW][C]4[/C][C]371.666666666667[/C][C]104.953091975184[/C][C]370[/C][/ROW]
[ROW][C]5[/C][C]382.5[/C][C]99.8293999326305[/C][C]310[/C][/ROW]
[ROW][C]6[/C][C]375.833333333333[/C][C]154.063642890223[/C][C]540[/C][/ROW]
[ROW][C]7[/C][C]409.166666666667[/C][C]148.229449492905[/C][C]440[/C][/ROW]
[ROW][C]8[/C][C]420[/C][C]127.564600390262[/C][C]360[/C][/ROW]
[ROW][C]9[/C][C]410[/C][C]142.509967753455[/C][C]430[/C][/ROW]
[/TABLE]
Source: https://freestatistics.org/blog/index.php?pk=235544&T=1

Globally Unique Identifier (entire table): ba.freestatistics.org/blog/index.php?pk=235544&T=1

As an alternative you can also use a QR Code:  

The GUIDs for individual cells are displayed in the table below:

Standard Deviation-Mean Plot
SectionMeanStandard DeviationRange
1364.16666666666764.1671585970911230
2380.83333333333376.3316130545867230
3370.83333333333395.8652779433279310
4371.666666666667104.953091975184370
5382.599.8293999326305310
6375.833333333333154.063642890223540
7409.166666666667148.229449492905440
8420127.564600390262360
9410142.509967753455430


Regression: S.E.(k) = alpha + beta * Mean(k)
alpha-271.519936600771
beta0.992021128102325
S.D.0.465155716181251
T-STAT2.13266459723732
p-value0.0703926786919278

\begin{tabular}{lllllllll}
\hline
Regression: S.E.(k) = alpha + beta * Mean(k) \tabularnewline
alpha & -271.519936600771 \tabularnewline
beta & 0.992021128102325 \tabularnewline
S.D. & 0.465155716181251 \tabularnewline
T-STAT & 2.13266459723732 \tabularnewline
p-value & 0.0703926786919278 \tabularnewline
\hline
\end{tabular}
%Source: https://freestatistics.org/blog/index.php?pk=235544&T=2

[TABLE]
[ROW][C]Regression: S.E.(k) = alpha + beta * Mean(k)[/C][/ROW]
[ROW][C]alpha[/C][C]-271.519936600771[/C][/ROW]
[ROW][C]beta[/C][C]0.992021128102325[/C][/ROW]
[ROW][C]S.D.[/C][C]0.465155716181251[/C][/ROW]
[ROW][C]T-STAT[/C][C]2.13266459723732[/C][/ROW]
[ROW][C]p-value[/C][C]0.0703926786919278[/C][/ROW]
[/TABLE]
Source: https://freestatistics.org/blog/index.php?pk=235544&T=2

Globally Unique Identifier (entire table): ba.freestatistics.org/blog/index.php?pk=235544&T=2

As an alternative you can also use a QR Code:  

The GUIDs for individual cells are displayed in the table below:

Regression: S.E.(k) = alpha + beta * Mean(k)
alpha-271.519936600771
beta0.992021128102325
S.D.0.465155716181251
T-STAT2.13266459723732
p-value0.0703926786919278


Regression: ln S.E.(k) = alpha + beta * ln Mean(k)
alpha-17.8036753405781
beta3.77458483553649
S.D.1.70253457447356
T-STAT2.21703858008501
p-value0.0621482771416982
Lambda-2.77458483553649

\begin{tabular}{lllllllll}
\hline
Regression: ln S.E.(k) = alpha + beta * ln Mean(k) \tabularnewline
alpha & -17.8036753405781 \tabularnewline
beta & 3.77458483553649 \tabularnewline
S.D. & 1.70253457447356 \tabularnewline
T-STAT & 2.21703858008501 \tabularnewline
p-value & 0.0621482771416982 \tabularnewline
Lambda & -2.77458483553649 \tabularnewline
\hline
\end{tabular}
%Source: https://freestatistics.org/blog/index.php?pk=235544&T=3

[TABLE]
[ROW][C]Regression: ln S.E.(k) = alpha + beta * ln Mean(k)[/C][/ROW]
[ROW][C]alpha[/C][C]-17.8036753405781[/C][/ROW]
[ROW][C]beta[/C][C]3.77458483553649[/C][/ROW]
[ROW][C]S.D.[/C][C]1.70253457447356[/C][/ROW]
[ROW][C]T-STAT[/C][C]2.21703858008501[/C][/ROW]
[ROW][C]p-value[/C][C]0.0621482771416982[/C][/ROW]
[ROW][C]Lambda[/C][C]-2.77458483553649[/C][/ROW]
[/TABLE]
Source: https://freestatistics.org/blog/index.php?pk=235544&T=3

Globally Unique Identifier (entire table): ba.freestatistics.org/blog/index.php?pk=235544&T=3

As an alternative you can also use a QR Code:  

The GUIDs for individual cells are displayed in the table below:

Regression: ln S.E.(k) = alpha + beta * ln Mean(k)
alpha-17.8036753405781
beta3.77458483553649
S.D.1.70253457447356
T-STAT2.21703858008501
p-value0.0621482771416982
Lambda-2.77458483553649


Parameters (Session):
Parameters (R input):
par1 = 12 ;
R code (references can be found in the software module):
par1 <- as.numeric(par1)
(n <- length(x))
(np <- floor(n / par1))
arr <- array(NA,dim=c(par1,np))
j <- 0
k <- 1
for (i in 1:(np*par1))
{
j = j + 1
arr[j,k] <- x[i]
if (j == par1) {
j = 0
k=k+1
}
}
arr
arr.mean <- array(NA,dim=np)
arr.sd <- array(NA,dim=np)
arr.range <- array(NA,dim=np)
for (j in 1:np)
{
arr.mean[j] <- mean(arr[,j],na.rm=TRUE)
arr.sd[j] <- sd(arr[,j],na.rm=TRUE)
arr.range[j] <- max(arr[,j],na.rm=TRUE) - min(arr[,j],na.rm=TRUE)
}
arr.mean
arr.sd
arr.range
(lm1 <- lm(arr.sd~arr.mean))
(lnlm1 <- lm(log(arr.sd)~log(arr.mean)))
(lm2 <- lm(arr.range~arr.mean))
bitmap(file='test1.png')
plot(arr.mean,arr.sd,main='Standard Deviation-Mean Plot',xlab='mean',ylab='standard deviation')
dev.off()
bitmap(file='test2.png')
plot(arr.mean,arr.range,main='Range-Mean Plot',xlab='mean',ylab='range')
dev.off()
load(file='createtable')
a<-table.start()
a<-table.row.start(a)
a<-table.element(a,'Standard Deviation-Mean Plot',4,TRUE)
a<-table.row.end(a)
a<-table.row.start(a)
a<-table.element(a,'Section',header=TRUE)
a<-table.element(a,'Mean',header=TRUE)
a<-table.element(a,'Standard Deviation',header=TRUE)
a<-table.element(a,'Range',header=TRUE)
a<-table.row.end(a)
for (j in 1:np) {
a<-table.row.start(a)
a<-table.element(a,j,header=TRUE)
a<-table.element(a,arr.mean[j])
a<-table.element(a,arr.sd[j] )
a<-table.element(a,arr.range[j] )
a<-table.row.end(a)
}
a<-table.end(a)
table.save(a,file='mytable.tab')
a<-table.start()
a<-table.row.start(a)
a<-table.element(a,'Regression: S.E.(k) = alpha + beta * Mean(k)',2,TRUE)
a<-table.row.end(a)
a<-table.row.start(a)
a<-table.element(a,'alpha',header=TRUE)
a<-table.element(a,lm1$coefficients[[1]])
a<-table.row.end(a)
a<-table.row.start(a)
a<-table.element(a,'beta',header=TRUE)
a<-table.element(a,lm1$coefficients[[2]])
a<-table.row.end(a)
a<-table.row.start(a)
a<-table.element(a,'S.D.',header=TRUE)
a<-table.element(a,summary(lm1)$coefficients[2,2])
a<-table.row.end(a)
a<-table.row.start(a)
a<-table.element(a,'T-STAT',header=TRUE)
a<-table.element(a,summary(lm1)$coefficients[2,3])
a<-table.row.end(a)
a<-table.row.start(a)
a<-table.element(a,'p-value',header=TRUE)
a<-table.element(a,summary(lm1)$coefficients[2,4])
a<-table.row.end(a)
a<-table.end(a)
table.save(a,file='mytable1.tab')
a<-table.start()
a<-table.row.start(a)
a<-table.element(a,'Regression: ln S.E.(k) = alpha + beta * ln Mean(k)',2,TRUE)
a<-table.row.end(a)
a<-table.row.start(a)
a<-table.element(a,'alpha',header=TRUE)
a<-table.element(a,lnlm1$coefficients[[1]])
a<-table.row.end(a)
a<-table.row.start(a)
a<-table.element(a,'beta',header=TRUE)
a<-table.element(a,lnlm1$coefficients[[2]])
a<-table.row.end(a)
a<-table.row.start(a)
a<-table.element(a,'S.D.',header=TRUE)
a<-table.element(a,summary(lnlm1)$coefficients[2,2])
a<-table.row.end(a)
a<-table.row.start(a)
a<-table.element(a,'T-STAT',header=TRUE)
a<-table.element(a,summary(lnlm1)$coefficients[2,3])
a<-table.row.end(a)
a<-table.row.start(a)
a<-table.element(a,'p-value',header=TRUE)
a<-table.element(a,summary(lnlm1)$coefficients[2,4])
a<-table.row.end(a)
a<-table.row.start(a)
a<-table.element(a,'Lambda',header=TRUE)
a<-table.element(a,1-lnlm1$coefficients[[2]])
a<-table.row.end(a)
a<-table.end(a)
table.save(a,file='mytable2.tab')