Free Statistics

of Irreproducible Research!

Author's title

Author*Unverified author*
R Software Modulerwasp_smp.wasp
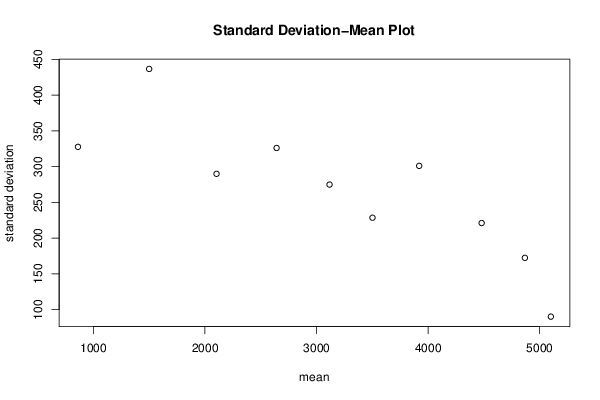
Title produced by softwareStandard Deviation-Mean Plot
Date of computationTue, 12 Aug 2014 17:52:12 +0100
Cite this page as followsStatistical Computations at FreeStatistics.org, Office for Research Development and Education, URL https://freestatistics.org/blog/index.php?v=date/2014/Aug/12/t14078623679afry88shonb82n.htm/, Retrieved Wed, 15 May 2024 19:14:09 +0000
Statistical Computations at FreeStatistics.org, Office for Research Development and Education, URL https://freestatistics.org/blog/index.php?pk=235489, Retrieved Wed, 15 May 2024 19:14:09 +0000
QR Codes:

Original text written by user:
IsPrivate?No (this computation is public)
User-defined keywordsBoeykens Brice
Estimated Impact154
Family? (F = Feedback message, R = changed R code, M = changed R Module, P = changed Parameters, D = changed Data)
-       [Standard Deviation-Mean Plot] [Tijdreeks A Stap 26] [2014-08-12 16:52:12] [7314f5de623f4497f735e8af2050bf2f] [Current]
Feedback Forum

Post a new message
Dataseries X:
5115
5105
5094
5074
5280
5270
5115
5012
5022
5022
5032
5053
5053
4960
4919
4960
5105
5084
4888
4722
4691
4629
4671
4722
4702
4660
4578
4660
4733
4712
4474
4371
4268
4185
4175
4237
4154
4123
4092
4268
4288
4185
3906
3782
3586
3503
3544
3606
3606
3555
3544
3710
3844
3782
3575
3472
3255
3121
3224
3327
3327
3193
3183
3358
3472
3431
3224
3090
2800
2687
2728
2904
2914
2656
2749
2976
3079
3017
2738
2542
2315
2139
2211
2366
2325
2098
2170
2397
2521
2449
2170
2046
1860
1664
1695
1850
1870
1684
1715
1974
2036
1932
1550
1354
1095
837
920
1033
1013
816
930
1209
1333
1271
1023
827
620
382
424
496


Summary of computational transaction
Raw Inputview raw input (R code)
Raw Outputview raw output of R engine
Computing time1 seconds
R Server'Gwilym Jenkins' @ jenkins.wessa.net

\begin{tabular}{lllllllll}
\hline
Summary of computational transaction \tabularnewline
Raw Input & view raw input (R code)  \tabularnewline
Raw Output & view raw output of R engine  \tabularnewline
Computing time & 1 seconds \tabularnewline
R Server & 'Gwilym Jenkins' @ jenkins.wessa.net \tabularnewline
\hline
\end{tabular}
%Source: https://freestatistics.org/blog/index.php?pk=235489&T=0

[TABLE]
[ROW][C]Summary of computational transaction[/C][/ROW]
[ROW][C]Raw Input[/C][C]view raw input (R code) [/C][/ROW]
[ROW][C]Raw Output[/C][C]view raw output of R engine [/C][/ROW]
[ROW][C]Computing time[/C][C]1 seconds[/C][/ROW]
[ROW][C]R Server[/C][C]'Gwilym Jenkins' @ jenkins.wessa.net[/C][/ROW]
[/TABLE]
Source: https://freestatistics.org/blog/index.php?pk=235489&T=0

Globally Unique Identifier (entire table): ba.freestatistics.org/blog/index.php?pk=235489&T=0

As an alternative you can also use a QR Code:  

The GUIDs for individual cells are displayed in the table below:

Summary of computational transaction
Raw Inputview raw input (R code)
Raw Outputview raw output of R engine
Computing time1 seconds
R Server'Gwilym Jenkins' @ jenkins.wessa.net


Standard Deviation-Mean Plot
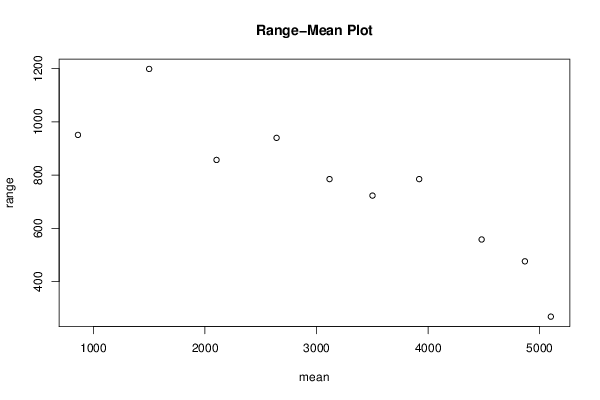
SectionMeanStandard DeviationRange
15099.590.0651279504297268
24867172.378547494645476
34479.58333333333221.046872171876558
43919.75301.052434273198785
53501.25228.496717700714723
63116.41666666667274.886243689452785
72641.83333333333326.116218362086940
82103.75289.929184143614857
91500436.6687948132271199
10862327.661410605521951

\begin{tabular}{lllllllll}
\hline
Standard Deviation-Mean Plot \tabularnewline
Section & Mean & Standard Deviation & Range \tabularnewline
1 & 5099.5 & 90.0651279504297 & 268 \tabularnewline
2 & 4867 & 172.378547494645 & 476 \tabularnewline
3 & 4479.58333333333 & 221.046872171876 & 558 \tabularnewline
4 & 3919.75 & 301.052434273198 & 785 \tabularnewline
5 & 3501.25 & 228.496717700714 & 723 \tabularnewline
6 & 3116.41666666667 & 274.886243689452 & 785 \tabularnewline
7 & 2641.83333333333 & 326.116218362086 & 940 \tabularnewline
8 & 2103.75 & 289.929184143614 & 857 \tabularnewline
9 & 1500 & 436.668794813227 & 1199 \tabularnewline
10 & 862 & 327.661410605521 & 951 \tabularnewline
\hline
\end{tabular}
%Source: https://freestatistics.org/blog/index.php?pk=235489&T=1

[TABLE]
[ROW][C]Standard Deviation-Mean Plot[/C][/ROW]
[ROW][C]Section[/C][C]Mean[/C][C]Standard Deviation[/C][C]Range[/C][/ROW]
[ROW][C]1[/C][C]5099.5[/C][C]90.0651279504297[/C][C]268[/C][/ROW]
[ROW][C]2[/C][C]4867[/C][C]172.378547494645[/C][C]476[/C][/ROW]
[ROW][C]3[/C][C]4479.58333333333[/C][C]221.046872171876[/C][C]558[/C][/ROW]
[ROW][C]4[/C][C]3919.75[/C][C]301.052434273198[/C][C]785[/C][/ROW]
[ROW][C]5[/C][C]3501.25[/C][C]228.496717700714[/C][C]723[/C][/ROW]
[ROW][C]6[/C][C]3116.41666666667[/C][C]274.886243689452[/C][C]785[/C][/ROW]
[ROW][C]7[/C][C]2641.83333333333[/C][C]326.116218362086[/C][C]940[/C][/ROW]
[ROW][C]8[/C][C]2103.75[/C][C]289.929184143614[/C][C]857[/C][/ROW]
[ROW][C]9[/C][C]1500[/C][C]436.668794813227[/C][C]1199[/C][/ROW]
[ROW][C]10[/C][C]862[/C][C]327.661410605521[/C][C]951[/C][/ROW]
[/TABLE]
Source: https://freestatistics.org/blog/index.php?pk=235489&T=1

Globally Unique Identifier (entire table): ba.freestatistics.org/blog/index.php?pk=235489&T=1

As an alternative you can also use a QR Code:  

The GUIDs for individual cells are displayed in the table below:

Standard Deviation-Mean Plot
SectionMeanStandard DeviationRange
15099.590.0651279504297268
24867172.378547494645476
34479.58333333333221.046872171876558
43919.75301.052434273198785
53501.25228.496717700714723
63116.41666666667274.886243689452785
72641.83333333333326.116218362086940
82103.75289.929184143614857
91500436.6687948132271199
10862327.661410605521951


Regression: S.E.(k) = alpha + beta * Mean(k)
alpha445.197875598008
beta-0.0555817074247097
S.D.0.0128323844798867
T-STAT-4.33136238333787
p-value0.00250737595623113

\begin{tabular}{lllllllll}
\hline
Regression: S.E.(k) = alpha + beta * Mean(k) \tabularnewline
alpha & 445.197875598008 \tabularnewline
beta & -0.0555817074247097 \tabularnewline
S.D. & 0.0128323844798867 \tabularnewline
T-STAT & -4.33136238333787 \tabularnewline
p-value & 0.00250737595623113 \tabularnewline
\hline
\end{tabular}
%Source: https://freestatistics.org/blog/index.php?pk=235489&T=2

[TABLE]
[ROW][C]Regression: S.E.(k) = alpha + beta * Mean(k)[/C][/ROW]
[ROW][C]alpha[/C][C]445.197875598008[/C][/ROW]
[ROW][C]beta[/C][C]-0.0555817074247097[/C][/ROW]
[ROW][C]S.D.[/C][C]0.0128323844798867[/C][/ROW]
[ROW][C]T-STAT[/C][C]-4.33136238333787[/C][/ROW]
[ROW][C]p-value[/C][C]0.00250737595623113[/C][/ROW]
[/TABLE]
Source: https://freestatistics.org/blog/index.php?pk=235489&T=2

Globally Unique Identifier (entire table): ba.freestatistics.org/blog/index.php?pk=235489&T=2

As an alternative you can also use a QR Code:  

The GUIDs for individual cells are displayed in the table below:

Regression: S.E.(k) = alpha + beta * Mean(k)
alpha445.197875598008
beta-0.0555817074247097
S.D.0.0128323844798867
T-STAT-4.33136238333787
p-value0.00250737595623113


Regression: ln S.E.(k) = alpha + beta * ln Mean(k)
alpha9.72248495234559
beta-0.529361024028661
S.D.0.196777018760839
T-STAT-2.69015674372037
p-value0.027489959373801
Lambda1.52936102402866

\begin{tabular}{lllllllll}
\hline
Regression: ln S.E.(k) = alpha + beta * ln Mean(k) \tabularnewline
alpha & 9.72248495234559 \tabularnewline
beta & -0.529361024028661 \tabularnewline
S.D. & 0.196777018760839 \tabularnewline
T-STAT & -2.69015674372037 \tabularnewline
p-value & 0.027489959373801 \tabularnewline
Lambda & 1.52936102402866 \tabularnewline
\hline
\end{tabular}
%Source: https://freestatistics.org/blog/index.php?pk=235489&T=3

[TABLE]
[ROW][C]Regression: ln S.E.(k) = alpha + beta * ln Mean(k)[/C][/ROW]
[ROW][C]alpha[/C][C]9.72248495234559[/C][/ROW]
[ROW][C]beta[/C][C]-0.529361024028661[/C][/ROW]
[ROW][C]S.D.[/C][C]0.196777018760839[/C][/ROW]
[ROW][C]T-STAT[/C][C]-2.69015674372037[/C][/ROW]
[ROW][C]p-value[/C][C]0.027489959373801[/C][/ROW]
[ROW][C]Lambda[/C][C]1.52936102402866[/C][/ROW]
[/TABLE]
Source: https://freestatistics.org/blog/index.php?pk=235489&T=3

Globally Unique Identifier (entire table): ba.freestatistics.org/blog/index.php?pk=235489&T=3

As an alternative you can also use a QR Code:  

The GUIDs for individual cells are displayed in the table below:

Regression: ln S.E.(k) = alpha + beta * ln Mean(k)
alpha9.72248495234559
beta-0.529361024028661
S.D.0.196777018760839
T-STAT-2.69015674372037
p-value0.027489959373801
Lambda1.52936102402866


Parameters (Session):
par1 = 12 ;
Parameters (R input):
par1 = 12 ;
R code (references can be found in the software module):
par1 <- as.numeric(par1)
(n <- length(x))
(np <- floor(n / par1))
arr <- array(NA,dim=c(par1,np))
j <- 0
k <- 1
for (i in 1:(np*par1))
{
j = j + 1
arr[j,k] <- x[i]
if (j == par1) {
j = 0
k=k+1
}
}
arr
arr.mean <- array(NA,dim=np)
arr.sd <- array(NA,dim=np)
arr.range <- array(NA,dim=np)
for (j in 1:np)
{
arr.mean[j] <- mean(arr[,j],na.rm=TRUE)
arr.sd[j] <- sd(arr[,j],na.rm=TRUE)
arr.range[j] <- max(arr[,j],na.rm=TRUE) - min(arr[,j],na.rm=TRUE)
}
arr.mean
arr.sd
arr.range
(lm1 <- lm(arr.sd~arr.mean))
(lnlm1 <- lm(log(arr.sd)~log(arr.mean)))
(lm2 <- lm(arr.range~arr.mean))
bitmap(file='test1.png')
plot(arr.mean,arr.sd,main='Standard Deviation-Mean Plot',xlab='mean',ylab='standard deviation')
dev.off()
bitmap(file='test2.png')
plot(arr.mean,arr.range,main='Range-Mean Plot',xlab='mean',ylab='range')
dev.off()
load(file='createtable')
a<-table.start()
a<-table.row.start(a)
a<-table.element(a,'Standard Deviation-Mean Plot',4,TRUE)
a<-table.row.end(a)
a<-table.row.start(a)
a<-table.element(a,'Section',header=TRUE)
a<-table.element(a,'Mean',header=TRUE)
a<-table.element(a,'Standard Deviation',header=TRUE)
a<-table.element(a,'Range',header=TRUE)
a<-table.row.end(a)
for (j in 1:np) {
a<-table.row.start(a)
a<-table.element(a,j,header=TRUE)
a<-table.element(a,arr.mean[j])
a<-table.element(a,arr.sd[j] )
a<-table.element(a,arr.range[j] )
a<-table.row.end(a)
}
a<-table.end(a)
table.save(a,file='mytable.tab')
a<-table.start()
a<-table.row.start(a)
a<-table.element(a,'Regression: S.E.(k) = alpha + beta * Mean(k)',2,TRUE)
a<-table.row.end(a)
a<-table.row.start(a)
a<-table.element(a,'alpha',header=TRUE)
a<-table.element(a,lm1$coefficients[[1]])
a<-table.row.end(a)
a<-table.row.start(a)
a<-table.element(a,'beta',header=TRUE)
a<-table.element(a,lm1$coefficients[[2]])
a<-table.row.end(a)
a<-table.row.start(a)
a<-table.element(a,'S.D.',header=TRUE)
a<-table.element(a,summary(lm1)$coefficients[2,2])
a<-table.row.end(a)
a<-table.row.start(a)
a<-table.element(a,'T-STAT',header=TRUE)
a<-table.element(a,summary(lm1)$coefficients[2,3])
a<-table.row.end(a)
a<-table.row.start(a)
a<-table.element(a,'p-value',header=TRUE)
a<-table.element(a,summary(lm1)$coefficients[2,4])
a<-table.row.end(a)
a<-table.end(a)
table.save(a,file='mytable1.tab')
a<-table.start()
a<-table.row.start(a)
a<-table.element(a,'Regression: ln S.E.(k) = alpha + beta * ln Mean(k)',2,TRUE)
a<-table.row.end(a)
a<-table.row.start(a)
a<-table.element(a,'alpha',header=TRUE)
a<-table.element(a,lnlm1$coefficients[[1]])
a<-table.row.end(a)
a<-table.row.start(a)
a<-table.element(a,'beta',header=TRUE)
a<-table.element(a,lnlm1$coefficients[[2]])
a<-table.row.end(a)
a<-table.row.start(a)
a<-table.element(a,'S.D.',header=TRUE)
a<-table.element(a,summary(lnlm1)$coefficients[2,2])
a<-table.row.end(a)
a<-table.row.start(a)
a<-table.element(a,'T-STAT',header=TRUE)
a<-table.element(a,summary(lnlm1)$coefficients[2,3])
a<-table.row.end(a)
a<-table.row.start(a)
a<-table.element(a,'p-value',header=TRUE)
a<-table.element(a,summary(lnlm1)$coefficients[2,4])
a<-table.row.end(a)
a<-table.row.start(a)
a<-table.element(a,'Lambda',header=TRUE)
a<-table.element(a,1-lnlm1$coefficients[[2]])
a<-table.row.end(a)
a<-table.end(a)
table.save(a,file='mytable2.tab')