Free Statistics

of Irreproducible Research!

Author's title

Author*Unverified author*
R Software Modulerwasp_correlation.wasp
Title produced by softwarePearson Correlation
Date of computationThu, 07 Aug 2014 15:40:55 +0100
Cite this page as followsStatistical Computations at FreeStatistics.org, Office for Research Development and Education, URL https://freestatistics.org/blog/index.php?v=date/2014/Aug/07/t1407422606jvvuc262lffd269.htm/, Retrieved Fri, 17 May 2024 05:19:07 +0000
Statistical Computations at FreeStatistics.org, Office for Research Development and Education, URL https://freestatistics.org/blog/index.php?pk=235420, Retrieved Fri, 17 May 2024 05:19:07 +0000
QR Codes:

Original text written by user:http://data.bls.gov/timeseries/CES0000000001
IsPrivate?No (this computation is public)
User-defined keywords
Estimated Impact171
Family? (F = Feedback message, R = changed R code, M = changed R Module, P = changed Parameters, D = changed Data)
-       [Pearson Correlation] [Republicans and e...] [2014-08-07 14:40:55] [d41d8cd98f00b204e9800998ecf8427e] [Current]
Feedback Forum

Post a new message
Dataseries X:
36
36
36
36
46
46
43
43
56
56
40
40
46
46
51
51
47
47
47
47
35
35
39
39
39
39
32
32
42
42
44
44
42
42
44
44
34
34
34
34
37
37
46
46
41
41
44
44
42
42
41
41
40
40
41
41
53
53
52
52
52
52
51
51
53
53
54
54
47
47
41
41
54
54
52
52
Dataseries Y:
30419
31942
37137
40471
42701
41905
40873
42153
43743
45160
43529
45454
48062
48144
50536
48835
50985
51954
53123
51037
53803
54304
54123
55746
56794
58413
60963
64301
65887
68125
70729
71053
71315
73708
76911
78635
76769
79547
82836
87205
90215
89837
91602
89522
90440
94792
97649
99473
102247
105546
108066
109833
108302
108790
111053
114624
117395
120029
123131
126204
129411
132251
132178
130579
130189
131785
134282
136486
137984
137421
130617
130395
131942
134111
136434
139004


Summary of computational transaction
Raw Inputview raw input (R code)
Raw Outputview raw output of R engine
Computing time1 seconds
R Server'Herman Ole Andreas Wold' @ wold.wessa.net

\begin{tabular}{lllllllll}
\hline
Summary of computational transaction \tabularnewline
Raw Input & view raw input (R code)  \tabularnewline
Raw Output & view raw output of R engine  \tabularnewline
Computing time & 1 seconds \tabularnewline
R Server & 'Herman Ole Andreas Wold' @ wold.wessa.net \tabularnewline
\hline
\end{tabular}
%Source: https://freestatistics.org/blog/index.php?pk=235420&T=0

[TABLE]
[ROW][C]Summary of computational transaction[/C][/ROW]
[ROW][C]Raw Input[/C][C]view raw input (R code) [/C][/ROW]
[ROW][C]Raw Output[/C][C]view raw output of R engine [/C][/ROW]
[ROW][C]Computing time[/C][C]1 seconds[/C][/ROW]
[ROW][C]R Server[/C][C]'Herman Ole Andreas Wold' @ wold.wessa.net[/C][/ROW]
[/TABLE]
Source: https://freestatistics.org/blog/index.php?pk=235420&T=0

Globally Unique Identifier (entire table): ba.freestatistics.org/blog/index.php?pk=235420&T=0

As an alternative you can also use a QR Code:  

The GUIDs for individual cells are displayed in the table below:

Summary of computational transaction
Raw Inputview raw input (R code)
Raw Outputview raw output of R engine
Computing time1 seconds
R Server'Herman Ole Andreas Wold' @ wold.wessa.net


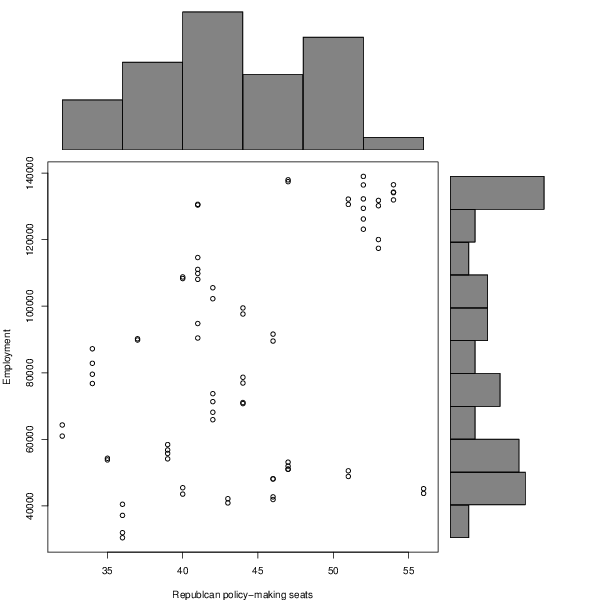
Pearson Product Moment Correlation - Ungrouped Data
StatisticVariable XVariable Y
Mean44.052631578947485304.5921052632
Biased Variance41.26038781163431181238663.3731
Biased Standard Deviation6.4234249284656834369.1527881194
Covariance98540.4084210526
Correlation0.440480360512136
Determination0.194022947996901
T-Test4.22066682782646
p-value (2 sided)6.83402796730626e-05
p-value (1 sided)3.41701398365313e-05
Degrees of Freedom74
Number of Observations76

\begin{tabular}{lllllllll}
\hline
Pearson Product Moment Correlation - Ungrouped Data \tabularnewline
Statistic & Variable X & Variable Y \tabularnewline
Mean & 44.0526315789474 & 85304.5921052632 \tabularnewline
Biased Variance & 41.2603878116343 & 1181238663.3731 \tabularnewline
Biased Standard Deviation & 6.42342492846568 & 34369.1527881194 \tabularnewline
Covariance & 98540.4084210526 \tabularnewline
Correlation & 0.440480360512136 \tabularnewline
Determination & 0.194022947996901 \tabularnewline
T-Test & 4.22066682782646 \tabularnewline
p-value (2 sided) & 6.83402796730626e-05 \tabularnewline
p-value (1 sided) & 3.41701398365313e-05 \tabularnewline
Degrees of Freedom & 74 \tabularnewline
Number of Observations & 76 \tabularnewline
\hline
\end{tabular}
%Source: https://freestatistics.org/blog/index.php?pk=235420&T=1

[TABLE]
[ROW][C]Pearson Product Moment Correlation - Ungrouped Data[/C][/ROW]
[ROW][C]Statistic[/C][C]Variable X[/C][C]Variable Y[/C][/ROW]
[ROW][C]Mean[/C][C]44.0526315789474[/C][C]85304.5921052632[/C][/ROW]
[ROW][C]Biased Variance[/C][C]41.2603878116343[/C][C]1181238663.3731[/C][/ROW]
[ROW][C]Biased Standard Deviation[/C][C]6.42342492846568[/C][C]34369.1527881194[/C][/ROW]
[ROW][C]Covariance[/C][C]98540.4084210526[/C][/ROW]
[ROW][C]Correlation[/C][C]0.440480360512136[/C][/ROW]
[ROW][C]Determination[/C][C]0.194022947996901[/C][/ROW]
[ROW][C]T-Test[/C][C]4.22066682782646[/C][/ROW]
[ROW][C]p-value (2 sided)[/C][C]6.83402796730626e-05[/C][/ROW]
[ROW][C]p-value (1 sided)[/C][C]3.41701398365313e-05[/C][/ROW]
[ROW][C]Degrees of Freedom[/C][C]74[/C][/ROW]
[ROW][C]Number of Observations[/C][C]76[/C][/ROW]
[/TABLE]
Source: https://freestatistics.org/blog/index.php?pk=235420&T=1

Globally Unique Identifier (entire table): ba.freestatistics.org/blog/index.php?pk=235420&T=1

As an alternative you can also use a QR Code:  

The GUIDs for individual cells are displayed in the table below:

Pearson Product Moment Correlation - Ungrouped Data
StatisticVariable XVariable Y
Mean44.052631578947485304.5921052632
Biased Variance41.26038781163431181238663.3731
Biased Standard Deviation6.4234249284656834369.1527881194
Covariance98540.4084210526
Correlation0.440480360512136
Determination0.194022947996901
T-Test4.22066682782646
p-value (2 sided)6.83402796730626e-05
p-value (1 sided)3.41701398365313e-05
Degrees of Freedom74
Number of Observations76


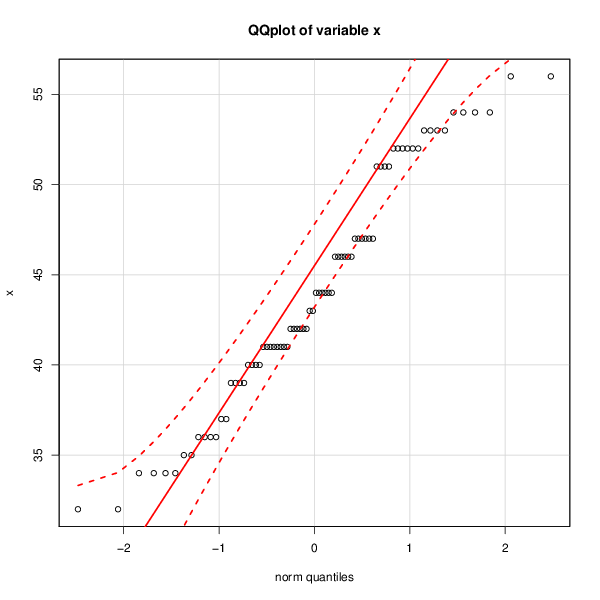
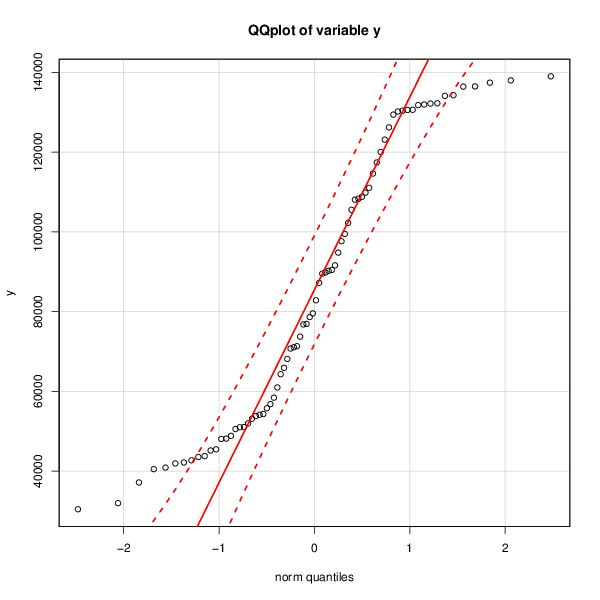
Normality Tests
> jarque.x
	Jarque-Bera Normality Test
data:  x
JB = 3.1145, p-value = 0.2107
alternative hypothesis: greater
> jarque.y
	Jarque-Bera Normality Test
data:  y
JB = 6.6193, p-value = 0.03653
alternative hypothesis: greater
> ad.x
	Anderson-Darling normality test
data:  x
A = 0.9879, p-value = 0.01246
> ad.y
	Anderson-Darling normality test
data:  y
A = 2.0736, p-value = 2.53e-05

\begin{tabular}{lllllllll}
\hline
Normality Tests \tabularnewline
> jarque.x
	Jarque-Bera Normality Test
data:  x
JB = 3.1145, p-value = 0.2107
alternative hypothesis: greater
\tabularnewline
> jarque.y
	Jarque-Bera Normality Test
data:  y
JB = 6.6193, p-value = 0.03653
alternative hypothesis: greater
\tabularnewline
> ad.x
	Anderson-Darling normality test
data:  x
A = 0.9879, p-value = 0.01246
\tabularnewline
> ad.y
	Anderson-Darling normality test
data:  y
A = 2.0736, p-value = 2.53e-05
\tabularnewline \hline \end{tabular} %Source: https://freestatistics.org/blog/index.php?pk=235420&T=2

[TABLE]
[ROW][C]Normality Tests[/C][/ROW]
[ROW][C]
> jarque.x
	Jarque-Bera Normality Test
data:  x
JB = 3.1145, p-value = 0.2107
alternative hypothesis: greater
[/C][/ROW] [ROW][C]
> jarque.y
	Jarque-Bera Normality Test
data:  y
JB = 6.6193, p-value = 0.03653
alternative hypothesis: greater
[/C][/ROW] [ROW][C]
> ad.x
	Anderson-Darling normality test
data:  x
A = 0.9879, p-value = 0.01246
[/C][/ROW] [ROW][C]
> ad.y
	Anderson-Darling normality test
data:  y
A = 2.0736, p-value = 2.53e-05
[/C][/ROW] [/TABLE] Source: https://freestatistics.org/blog/index.php?pk=235420&T=2

Globally Unique Identifier (entire table): ba.freestatistics.org/blog/index.php?pk=235420&T=2

As an alternative you can also use a QR Code:  

The GUIDs for individual cells are displayed in the table below:

Normality Tests
> jarque.x
	Jarque-Bera Normality Test
data:  x
JB = 3.1145, p-value = 0.2107
alternative hypothesis: greater
> jarque.y
	Jarque-Bera Normality Test
data:  y
JB = 6.6193, p-value = 0.03653
alternative hypothesis: greater
> ad.x
	Anderson-Darling normality test
data:  x
A = 0.9879, p-value = 0.01246
> ad.y
	Anderson-Darling normality test
data:  y
A = 2.0736, p-value = 2.53e-05


Parameters (Session):
Parameters (R input):
R code (references can be found in the software module):
x <- x[!is.na(y)]
y <- y[!is.na(y)]
y <- y[!is.na(x)]
x <- x[!is.na(x)]
bitmap(file='test1.png')
histx <- hist(x, plot=FALSE)
histy <- hist(y, plot=FALSE)
maxcounts <- max(c(histx$counts, histx$counts))
xrange <- c(min(x),max(x))
yrange <- c(min(y),max(y))
nf <- layout(matrix(c(2,0,1,3),2,2,byrow=TRUE), c(3,1), c(1,3), TRUE)
par(mar=c(4,4,1,1))
plot(x, y, xlim=xrange, ylim=yrange, xlab=xlab, ylab=ylab, sub=main)
par(mar=c(0,4,1,1))
barplot(histx$counts, axes=FALSE, ylim=c(0, maxcounts), space=0)
par(mar=c(4,0,1,1))
barplot(histy$counts, axes=FALSE, xlim=c(0, maxcounts), space=0, horiz=TRUE)
dev.off()
lx = length(x)
makebiased = (lx-1)/lx
varx = var(x)*makebiased
vary = var(y)*makebiased
corxy <- cor.test(x,y,method='pearson', na.rm = T)
cxy <- as.matrix(corxy$estimate)[1,1]
load(file='createtable')
a<-table.start()
a<-table.row.start(a)
a<-table.element(a,'Pearson Product Moment Correlation - Ungrouped Data',3,TRUE)
a<-table.row.end(a)
a<-table.row.start(a)
a<-table.element(a,'Statistic',1,TRUE)
a<-table.element(a,'Variable X',1,TRUE)
a<-table.element(a,'Variable Y',1,TRUE)
a<-table.row.end(a)
a<-table.row.start(a)
a<-table.element(a,hyperlink('arithmetic_mean.htm','Mean',''),header=TRUE)
a<-table.element(a,mean(x))
a<-table.element(a,mean(y))
a<-table.row.end(a)
a<-table.row.start(a)
a<-table.element(a,hyperlink('biased.htm','Biased Variance',''),header=TRUE)
a<-table.element(a,varx)
a<-table.element(a,vary)
a<-table.row.end(a)
a<-table.row.start(a)
a<-table.element(a,hyperlink('biased1.htm','Biased Standard Deviation',''),header=TRUE)
a<-table.element(a,sqrt(varx))
a<-table.element(a,sqrt(vary))
a<-table.row.end(a)
a<-table.row.start(a)
a<-table.element(a,hyperlink('covariance.htm','Covariance',''),header=TRUE)
a<-table.element(a,cov(x,y),2)
a<-table.row.end(a)
a<-table.row.start(a)
a<-table.element(a,hyperlink('pearson_correlation.htm','Correlation',''),header=TRUE)
a<-table.element(a,cxy,2)
a<-table.row.end(a)
a<-table.row.start(a)
a<-table.element(a,hyperlink('coeff_of_determination.htm','Determination',''),header=TRUE)
a<-table.element(a,cxy*cxy,2)
a<-table.row.end(a)
a<-table.row.start(a)
a<-table.element(a,hyperlink('ttest_statistic.htm','T-Test',''),header=TRUE)
a<-table.element(a,as.matrix(corxy$statistic)[1,1],2)
a<-table.row.end(a)
a<-table.row.start(a)
a<-table.element(a,'p-value (2 sided)',header=TRUE)
a<-table.element(a,(p2 <- as.matrix(corxy$p.value)[1,1]),2)
a<-table.row.end(a)
a<-table.row.start(a)
a<-table.element(a,'p-value (1 sided)',header=TRUE)
a<-table.element(a,p2/2,2)
a<-table.row.end(a)
a<-table.row.start(a)
a<-table.element(a,'Degrees of Freedom',header=TRUE)
a<-table.element(a,lx-2,2)
a<-table.row.end(a)
a<-table.row.start(a)
a<-table.element(a,'Number of Observations',header=TRUE)
a<-table.element(a,lx,2)
a<-table.row.end(a)
a<-table.end(a)
table.save(a,file='mytable.tab')
library(moments)
library(nortest)
jarque.x <- jarque.test(x)
jarque.y <- jarque.test(y)
if(lx>7) {
ad.x <- ad.test(x)
ad.y <- ad.test(y)
}
a<-table.start()
a<-table.row.start(a)
a<-table.element(a,'Normality Tests',1,TRUE)
a<-table.row.end(a)
a<-table.row.start(a)
a<-table.element(a,paste('
',RC.texteval('jarque.x'),'
',sep=''))
a<-table.row.end(a)
a<-table.row.start(a)
a<-table.element(a,paste('
',RC.texteval('jarque.y'),'
',sep=''))
a<-table.row.end(a)
if(lx>7) {
a<-table.row.start(a)
a<-table.element(a,paste('
',RC.texteval('ad.x'),'
',sep=''))
a<-table.row.end(a)
a<-table.row.start(a)
a<-table.element(a,paste('
',RC.texteval('ad.y'),'
',sep=''))
a<-table.row.end(a)
}
a<-table.end(a)
table.save(a,file='mytable1.tab')
library(car)
bitmap(file='test2.png')
qq.plot(x,main='QQplot of variable x')
dev.off()
bitmap(file='test3.png')
qq.plot(y,main='QQplot of variable y')
dev.off()