Free Statistics

of Irreproducible Research!

Author's title

Author*The author of this computation has been verified*
R Software Modulerwasp_notchedbox1.wasp
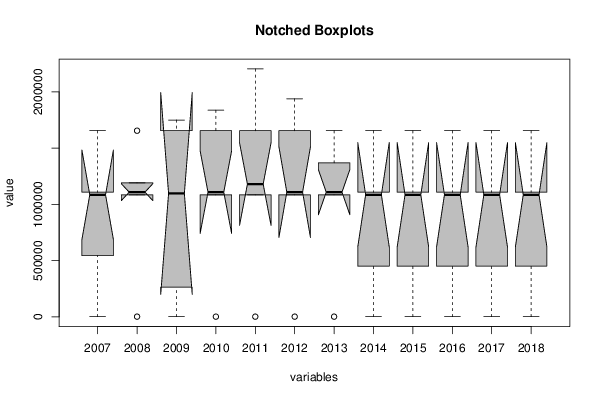
Title produced by softwareNotched Boxplots
Date of computationWed, 23 Apr 2014 15:29:20 -0400
Cite this page as followsStatistical Computations at FreeStatistics.org, Office for Research Development and Education, URL https://freestatistics.org/blog/index.php?v=date/2014/Apr/23/t1398281421t69rroebb53owl8.htm/, Retrieved Fri, 17 May 2024 11:41:32 +0000
Statistical Computations at FreeStatistics.org, Office for Research Development and Education, URL https://freestatistics.org/blog/index.php?pk=234565, Retrieved Fri, 17 May 2024 11:41:32 +0000
QR Codes:

Original text written by user:
IsPrivate?No (this computation is public)
User-defined keywords
Estimated Impact151
Family? (F = Feedback message, R = changed R code, M = changed R Module, P = changed Parameters, D = changed Data)
-       [Notched Boxplots] [totaal_boxplot] [2014-04-23 19:29:20] [0886edc6b443bd4bec60935c27dcdd54] [Current]
Feedback Forum

Post a new message
Dataseries X:
2007	2008	2009	2010	2011	2012	2013	2014	2015	2016	2017	2018
NA	NA	263856,00	1109292,00	2204435,00	1938362,00	1370268,00	451065,00	451400,00	451735,00	452070,00	452405,00
1085493,43	1085493,43	1085493,43	1085493,43	1085493,43	1085493,43	1085493,43	1085493,43	1085493,43	1085493,43	1085493,43	1085493,43
1108957,00	1108957,00	1108957,00	1108957,00	1108957,00	1108957,00	1108957,00	1108957,00	1108957,00	1108957,00	1108957,00	1108957,00
545221,33	1192192,67	1750361,33	1837353,33	1252896,67	NA	NA	NA	NA	NA	NA	NA
1655254,25	1655254,25	1655254,25	1655254,25	1655254,25	1655254,25	1655254,25	1655254,25	1655254,25	1655254,25	1655254,25	1655254,25


Summary of computational transaction
Raw Inputview raw input (R code)
Raw Outputview raw output of R engine
Computing time1 seconds
R Server'Gertrude Mary Cox' @ cox.wessa.net

\begin{tabular}{lllllllll}
\hline
Summary of computational transaction \tabularnewline
Raw Input & view raw input (R code)  \tabularnewline
Raw Output & view raw output of R engine  \tabularnewline
Computing time & 1 seconds \tabularnewline
R Server & 'Gertrude Mary Cox' @ cox.wessa.net \tabularnewline
\hline
\end{tabular}
%Source: https://freestatistics.org/blog/index.php?pk=234565&T=0

[TABLE]
[ROW][C]Summary of computational transaction[/C][/ROW]
[ROW][C]Raw Input[/C][C]view raw input (R code) [/C][/ROW]
[ROW][C]Raw Output[/C][C]view raw output of R engine [/C][/ROW]
[ROW][C]Computing time[/C][C]1 seconds[/C][/ROW]
[ROW][C]R Server[/C][C]'Gertrude Mary Cox' @ cox.wessa.net[/C][/ROW]
[/TABLE]
Source: https://freestatistics.org/blog/index.php?pk=234565&T=0

Globally Unique Identifier (entire table): ba.freestatistics.org/blog/index.php?pk=234565&T=0

As an alternative you can also use a QR Code:  

The GUIDs for individual cells are displayed in the table below:

Summary of computational transaction
Raw Inputview raw input (R code)
Raw Outputview raw output of R engine
Computing time1 seconds
R Server'Gertrude Mary Cox' @ cox.wessa.net


Boxplot statistics
Variablelower whiskerlower hingemedianupper hingeupper whisker
20072007545221.331085493.4311089571655254.25
20081085493.431085493.4311089571192192.671192192.67
200920092638561097225.2151655254.251750361.33
20101085493.431085493.431109124.51655254.251837353.33
20111085493.431085493.431180926.8351655254.252204435
20121085493.431085493.4311089571655254.251938362
20131085493.431085493.43110895713702681655254.25
201420144510651085493.4311089571655254.25
201520154514001085493.4311089571655254.25
201620164517351085493.4311089571655254.25
201720174520701085493.4311089571655254.25
201820184524051085493.4311089571655254.25

\begin{tabular}{lllllllll}
\hline
Boxplot statistics \tabularnewline
Variable & lower whisker & lower hinge & median & upper hinge & upper whisker \tabularnewline
2007 & 2007 & 545221.33 & 1085493.43 & 1108957 & 1655254.25 \tabularnewline
2008 & 1085493.43 & 1085493.43 & 1108957 & 1192192.67 & 1192192.67 \tabularnewline
2009 & 2009 & 263856 & 1097225.215 & 1655254.25 & 1750361.33 \tabularnewline
2010 & 1085493.43 & 1085493.43 & 1109124.5 & 1655254.25 & 1837353.33 \tabularnewline
2011 & 1085493.43 & 1085493.43 & 1180926.835 & 1655254.25 & 2204435 \tabularnewline
2012 & 1085493.43 & 1085493.43 & 1108957 & 1655254.25 & 1938362 \tabularnewline
2013 & 1085493.43 & 1085493.43 & 1108957 & 1370268 & 1655254.25 \tabularnewline
2014 & 2014 & 451065 & 1085493.43 & 1108957 & 1655254.25 \tabularnewline
2015 & 2015 & 451400 & 1085493.43 & 1108957 & 1655254.25 \tabularnewline
2016 & 2016 & 451735 & 1085493.43 & 1108957 & 1655254.25 \tabularnewline
2017 & 2017 & 452070 & 1085493.43 & 1108957 & 1655254.25 \tabularnewline
2018 & 2018 & 452405 & 1085493.43 & 1108957 & 1655254.25 \tabularnewline
\hline
\end{tabular}
%Source: https://freestatistics.org/blog/index.php?pk=234565&T=1

[TABLE]
[ROW][C]Boxplot statistics[/C][/ROW]
[ROW][C]Variable[/C][C]lower whisker[/C][C]lower hinge[/C][C]median[/C][C]upper hinge[/C][C]upper whisker[/C][/ROW]
[ROW][C]2007[/C][C]2007[/C][C]545221.33[/C][C]1085493.43[/C][C]1108957[/C][C]1655254.25[/C][/ROW]
[ROW][C]2008[/C][C]1085493.43[/C][C]1085493.43[/C][C]1108957[/C][C]1192192.67[/C][C]1192192.67[/C][/ROW]
[ROW][C]2009[/C][C]2009[/C][C]263856[/C][C]1097225.215[/C][C]1655254.25[/C][C]1750361.33[/C][/ROW]
[ROW][C]2010[/C][C]1085493.43[/C][C]1085493.43[/C][C]1109124.5[/C][C]1655254.25[/C][C]1837353.33[/C][/ROW]
[ROW][C]2011[/C][C]1085493.43[/C][C]1085493.43[/C][C]1180926.835[/C][C]1655254.25[/C][C]2204435[/C][/ROW]
[ROW][C]2012[/C][C]1085493.43[/C][C]1085493.43[/C][C]1108957[/C][C]1655254.25[/C][C]1938362[/C][/ROW]
[ROW][C]2013[/C][C]1085493.43[/C][C]1085493.43[/C][C]1108957[/C][C]1370268[/C][C]1655254.25[/C][/ROW]
[ROW][C]2014[/C][C]2014[/C][C]451065[/C][C]1085493.43[/C][C]1108957[/C][C]1655254.25[/C][/ROW]
[ROW][C]2015[/C][C]2015[/C][C]451400[/C][C]1085493.43[/C][C]1108957[/C][C]1655254.25[/C][/ROW]
[ROW][C]2016[/C][C]2016[/C][C]451735[/C][C]1085493.43[/C][C]1108957[/C][C]1655254.25[/C][/ROW]
[ROW][C]2017[/C][C]2017[/C][C]452070[/C][C]1085493.43[/C][C]1108957[/C][C]1655254.25[/C][/ROW]
[ROW][C]2018[/C][C]2018[/C][C]452405[/C][C]1085493.43[/C][C]1108957[/C][C]1655254.25[/C][/ROW]
[/TABLE]
Source: https://freestatistics.org/blog/index.php?pk=234565&T=1

Globally Unique Identifier (entire table): ba.freestatistics.org/blog/index.php?pk=234565&T=1

As an alternative you can also use a QR Code:  

The GUIDs for individual cells are displayed in the table below:

Boxplot statistics
Variablelower whiskerlower hingemedianupper hingeupper whisker
20072007545221.331085493.4311089571655254.25
20081085493.431085493.4311089571192192.671192192.67
200920092638561097225.2151655254.251750361.33
20101085493.431085493.431109124.51655254.251837353.33
20111085493.431085493.431180926.8351655254.252204435
20121085493.431085493.4311089571655254.251938362
20131085493.431085493.43110895713702681655254.25
201420144510651085493.4311089571655254.25
201520154514001085493.4311089571655254.25
201620164517351085493.4311089571655254.25
201720174520701085493.4311089571655254.25
201820184524051085493.4311089571655254.25


Boxplot Notches
Variablelower boundmedianupper bound
2007687159.2256902011085493.431483827.6343098
20081033563.5858031311089571184350.41419687
2009199728.4030712811097225.2151994722.02692872
2010741610.3684335041109124.51476638.6315665
2011813412.7034335041180926.8351548440.9665665
2012706365.43987821711089571511548.56012178
2013907736.00621648611089571310177.99378351
2014620628.600102361085493.431550358.25989764
2015620865.3102584581085493.431550121.54974154
2016621102.0204145561085493.431549884.83958544
2017621338.7305706541085493.431549648.12942935
2018621575.4407267521085493.431549411.41927325

\begin{tabular}{lllllllll}
\hline
Boxplot Notches \tabularnewline
Variable & lower bound & median & upper bound \tabularnewline
2007 & 687159.225690201 & 1085493.43 & 1483827.6343098 \tabularnewline
2008 & 1033563.58580313 & 1108957 & 1184350.41419687 \tabularnewline
2009 & 199728.403071281 & 1097225.215 & 1994722.02692872 \tabularnewline
2010 & 741610.368433504 & 1109124.5 & 1476638.6315665 \tabularnewline
2011 & 813412.703433504 & 1180926.835 & 1548440.9665665 \tabularnewline
2012 & 706365.439878217 & 1108957 & 1511548.56012178 \tabularnewline
2013 & 907736.006216486 & 1108957 & 1310177.99378351 \tabularnewline
2014 & 620628.60010236 & 1085493.43 & 1550358.25989764 \tabularnewline
2015 & 620865.310258458 & 1085493.43 & 1550121.54974154 \tabularnewline
2016 & 621102.020414556 & 1085493.43 & 1549884.83958544 \tabularnewline
2017 & 621338.730570654 & 1085493.43 & 1549648.12942935 \tabularnewline
2018 & 621575.440726752 & 1085493.43 & 1549411.41927325 \tabularnewline
\hline
\end{tabular}
%Source: https://freestatistics.org/blog/index.php?pk=234565&T=2

[TABLE]
[ROW][C]Boxplot Notches[/C][/ROW]
[ROW][C]Variable[/C][C]lower bound[/C][C]median[/C][C]upper bound[/C][/ROW]
[ROW][C]2007[/C][C]687159.225690201[/C][C]1085493.43[/C][C]1483827.6343098[/C][/ROW]
[ROW][C]2008[/C][C]1033563.58580313[/C][C]1108957[/C][C]1184350.41419687[/C][/ROW]
[ROW][C]2009[/C][C]199728.403071281[/C][C]1097225.215[/C][C]1994722.02692872[/C][/ROW]
[ROW][C]2010[/C][C]741610.368433504[/C][C]1109124.5[/C][C]1476638.6315665[/C][/ROW]
[ROW][C]2011[/C][C]813412.703433504[/C][C]1180926.835[/C][C]1548440.9665665[/C][/ROW]
[ROW][C]2012[/C][C]706365.439878217[/C][C]1108957[/C][C]1511548.56012178[/C][/ROW]
[ROW][C]2013[/C][C]907736.006216486[/C][C]1108957[/C][C]1310177.99378351[/C][/ROW]
[ROW][C]2014[/C][C]620628.60010236[/C][C]1085493.43[/C][C]1550358.25989764[/C][/ROW]
[ROW][C]2015[/C][C]620865.310258458[/C][C]1085493.43[/C][C]1550121.54974154[/C][/ROW]
[ROW][C]2016[/C][C]621102.020414556[/C][C]1085493.43[/C][C]1549884.83958544[/C][/ROW]
[ROW][C]2017[/C][C]621338.730570654[/C][C]1085493.43[/C][C]1549648.12942935[/C][/ROW]
[ROW][C]2018[/C][C]621575.440726752[/C][C]1085493.43[/C][C]1549411.41927325[/C][/ROW]
[/TABLE]
Source: https://freestatistics.org/blog/index.php?pk=234565&T=2

Globally Unique Identifier (entire table): ba.freestatistics.org/blog/index.php?pk=234565&T=2

As an alternative you can also use a QR Code:  

The GUIDs for individual cells are displayed in the table below:

Boxplot Notches
Variablelower boundmedianupper bound
2007687159.2256902011085493.431483827.6343098
20081033563.5858031311089571184350.41419687
2009199728.4030712811097225.2151994722.02692872
2010741610.3684335041109124.51476638.6315665
2011813412.7034335041180926.8351548440.9665665
2012706365.43987821711089571511548.56012178
2013907736.00621648611089571310177.99378351
2014620628.600102361085493.431550358.25989764
2015620865.3102584581085493.431550121.54974154
2016621102.0204145561085493.431549884.83958544
2017621338.7305706541085493.431549648.12942935
2018621575.4407267521085493.431549411.41927325


Parameters (Session):
par1 = grey ;
Parameters (R input):
par1 = grey ;
R code (references can be found in the software module):
z <- as.data.frame(t(y))
bitmap(file='test1.png')
(r<-boxplot(z ,xlab=xlab,ylab=ylab,main=main,notch=TRUE,col=par1))
dev.off()
load(file='createtable')
a<-table.start()
a<-table.row.start(a)
a<-table.element(a,hyperlink('overview.htm','Boxplot statistics','Boxplot overview'),6,TRUE)
a<-table.row.end(a)
a<-table.row.start(a)
a<-table.element(a,'Variable',1,TRUE)
a<-table.element(a,hyperlink('lower_whisker.htm','lower whisker','definition of lower whisker'),1,TRUE)
a<-table.element(a,hyperlink('lower_hinge.htm','lower hinge','definition of lower hinge'),1,TRUE)
a<-table.element(a,hyperlink('central_tendency.htm','median','definitions about measures of central tendency'),1,TRUE)
a<-table.element(a,hyperlink('upper_hinge.htm','upper hinge','definition of upper hinge'),1,TRUE)
a<-table.element(a,hyperlink('upper_whisker.htm','upper whisker','definition of upper whisker'),1,TRUE)
a<-table.row.end(a)
for (i in 1:length(y[,1]))
{
a<-table.row.start(a)
a<-table.element(a,dimnames(t(x))[[2]][i],1,TRUE)
for (j in 1:5)
{
a<-table.element(a,r$stats[j,i])
}
a<-table.row.end(a)
}
a<-table.end(a)
table.save(a,file='mytable.tab')
a<-table.start()
a<-table.row.start(a)
a<-table.element(a,'Boxplot Notches',4,TRUE)
a<-table.row.end(a)
a<-table.row.start(a)
a<-table.element(a,'Variable',1,TRUE)
a<-table.element(a,'lower bound',1,TRUE)
a<-table.element(a,'median',1,TRUE)
a<-table.element(a,'upper bound',1,TRUE)
a<-table.row.end(a)
for (i in 1:length(y[,1]))
{
a<-table.row.start(a)
a<-table.element(a,dimnames(t(x))[[2]][i],1,TRUE)
a<-table.element(a,r$conf[1,i])
a<-table.element(a,r$stats[3,i])
a<-table.element(a,r$conf[2,i])
a<-table.row.end(a)
}
a<-table.end(a)
table.save(a,file='mytable1.tab')