Free Statistics

of Irreproducible Research!

Author's title

Author*The author of this computation has been verified*
R Software Modulerwasp_notchedbox1.wasp
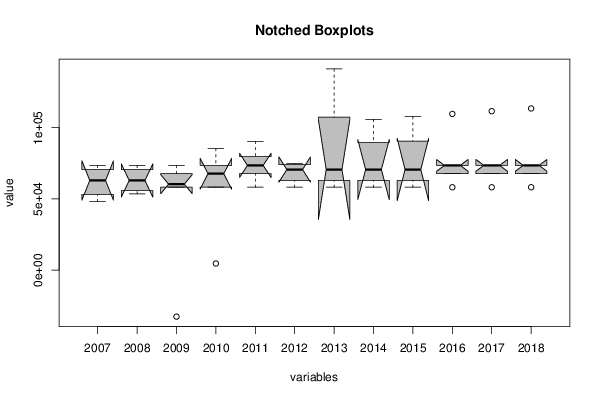
Title produced by softwareNotched Boxplots
Date of computationWed, 23 Apr 2014 15:05:32 -0400
Cite this page as followsStatistical Computations at FreeStatistics.org, Office for Research Development and Education, URL https://freestatistics.org/blog/index.php?v=date/2014/Apr/23/t1398280313qjc9ka0d67cetmz.htm/, Retrieved Fri, 17 May 2024 09:50:20 +0000
Statistical Computations at FreeStatistics.org, Office for Research Development and Education, URL https://freestatistics.org/blog/index.php?pk=234562, Retrieved Fri, 17 May 2024 09:50:20 +0000
QR Codes:

Original text written by user:
IsPrivate?No (this computation is public)
User-defined keywords
Estimated Impact178
Family? (F = Feedback message, R = changed R code, M = changed R Module, P = changed Parameters, D = changed Data)
-       [Notched Boxplots] [pressure_relief_b...] [2014-04-23 19:05:32] [0886edc6b443bd4bec60935c27dcdd54] [Current]
Feedback Forum

Post a new message
Dataseries X:
NA	NA	-32749,00	4580,94	90377,38	74773,57	141295,76	105859,47	107778,15	109696,83	111615,51	113534,19
67694,29	67694,29	67694,29	67694,29	67694,29	67694,29	67694,29	67694,29	67694,29	67694,29	67694,29	67694,29
73544,00	73544,00	73544,00	73544,00	73544,00	73544,00	73544,00	73544,00	73544,00	73544,00	73544,00	73544,00
48106,67	53535,00	60345,67	85332,00	79781,33	NA	NA	NA	NA	73544,00	73544,00	73544,00
58178,83	58178,83	58178,83	58178,83	58178,83	58178,83	58178,83	58178,83	58178,83	58178,83	58178,83	58178,83


Summary of computational transaction
Raw Inputview raw input (R code)
Raw Outputview raw output of R engine
Computing time1 seconds
R Server'Gertrude Mary Cox' @ cox.wessa.net

\begin{tabular}{lllllllll}
\hline
Summary of computational transaction \tabularnewline
Raw Input & view raw input (R code)  \tabularnewline
Raw Output & view raw output of R engine  \tabularnewline
Computing time & 1 seconds \tabularnewline
R Server & 'Gertrude Mary Cox' @ cox.wessa.net \tabularnewline
\hline
\end{tabular}
%Source: https://freestatistics.org/blog/index.php?pk=234562&T=0

[TABLE]
[ROW][C]Summary of computational transaction[/C][/ROW]
[ROW][C]Raw Input[/C][C]view raw input (R code) [/C][/ROW]
[ROW][C]Raw Output[/C][C]view raw output of R engine [/C][/ROW]
[ROW][C]Computing time[/C][C]1 seconds[/C][/ROW]
[ROW][C]R Server[/C][C]'Gertrude Mary Cox' @ cox.wessa.net[/C][/ROW]
[/TABLE]
Source: https://freestatistics.org/blog/index.php?pk=234562&T=0

Globally Unique Identifier (entire table): ba.freestatistics.org/blog/index.php?pk=234562&T=0

As an alternative you can also use a QR Code:  

The GUIDs for individual cells are displayed in the table below:

Summary of computational transaction
Raw Inputview raw input (R code)
Raw Outputview raw output of R engine
Computing time1 seconds
R Server'Gertrude Mary Cox' @ cox.wessa.net


Boxplot statistics
Variablelower whiskerlower hingemedianupper hingeupper whisker
200748106.6753142.7562936.5670619.14573544
20085353555856.91562936.5670619.14573544
200958178.8358178.8360345.6767694.2973544
201058178.8358178.8367694.297354485332
201158178.8367694.297354479781.3390377.38
201258178.8362936.5670619.14574158.78574773.57
201358178.8362936.5670619.145107419.88141295.76
201458178.8362936.5670619.14589701.735105859.47
201558178.8362936.5670619.14590661.075107778.15
201667694.2967694.29735447354473544
201767694.2967694.29735447354473544
201867694.2967694.29735447354473544

\begin{tabular}{lllllllll}
\hline
Boxplot statistics \tabularnewline
Variable & lower whisker & lower hinge & median & upper hinge & upper whisker \tabularnewline
2007 & 48106.67 & 53142.75 & 62936.56 & 70619.145 & 73544 \tabularnewline
2008 & 53535 & 55856.915 & 62936.56 & 70619.145 & 73544 \tabularnewline
2009 & 58178.83 & 58178.83 & 60345.67 & 67694.29 & 73544 \tabularnewline
2010 & 58178.83 & 58178.83 & 67694.29 & 73544 & 85332 \tabularnewline
2011 & 58178.83 & 67694.29 & 73544 & 79781.33 & 90377.38 \tabularnewline
2012 & 58178.83 & 62936.56 & 70619.145 & 74158.785 & 74773.57 \tabularnewline
2013 & 58178.83 & 62936.56 & 70619.145 & 107419.88 & 141295.76 \tabularnewline
2014 & 58178.83 & 62936.56 & 70619.145 & 89701.735 & 105859.47 \tabularnewline
2015 & 58178.83 & 62936.56 & 70619.145 & 90661.075 & 107778.15 \tabularnewline
2016 & 67694.29 & 67694.29 & 73544 & 73544 & 73544 \tabularnewline
2017 & 67694.29 & 67694.29 & 73544 & 73544 & 73544 \tabularnewline
2018 & 67694.29 & 67694.29 & 73544 & 73544 & 73544 \tabularnewline
\hline
\end{tabular}
%Source: https://freestatistics.org/blog/index.php?pk=234562&T=1

[TABLE]
[ROW][C]Boxplot statistics[/C][/ROW]
[ROW][C]Variable[/C][C]lower whisker[/C][C]lower hinge[/C][C]median[/C][C]upper hinge[/C][C]upper whisker[/C][/ROW]
[ROW][C]2007[/C][C]48106.67[/C][C]53142.75[/C][C]62936.56[/C][C]70619.145[/C][C]73544[/C][/ROW]
[ROW][C]2008[/C][C]53535[/C][C]55856.915[/C][C]62936.56[/C][C]70619.145[/C][C]73544[/C][/ROW]
[ROW][C]2009[/C][C]58178.83[/C][C]58178.83[/C][C]60345.67[/C][C]67694.29[/C][C]73544[/C][/ROW]
[ROW][C]2010[/C][C]58178.83[/C][C]58178.83[/C][C]67694.29[/C][C]73544[/C][C]85332[/C][/ROW]
[ROW][C]2011[/C][C]58178.83[/C][C]67694.29[/C][C]73544[/C][C]79781.33[/C][C]90377.38[/C][/ROW]
[ROW][C]2012[/C][C]58178.83[/C][C]62936.56[/C][C]70619.145[/C][C]74158.785[/C][C]74773.57[/C][/ROW]
[ROW][C]2013[/C][C]58178.83[/C][C]62936.56[/C][C]70619.145[/C][C]107419.88[/C][C]141295.76[/C][/ROW]
[ROW][C]2014[/C][C]58178.83[/C][C]62936.56[/C][C]70619.145[/C][C]89701.735[/C][C]105859.47[/C][/ROW]
[ROW][C]2015[/C][C]58178.83[/C][C]62936.56[/C][C]70619.145[/C][C]90661.075[/C][C]107778.15[/C][/ROW]
[ROW][C]2016[/C][C]67694.29[/C][C]67694.29[/C][C]73544[/C][C]73544[/C][C]73544[/C][/ROW]
[ROW][C]2017[/C][C]67694.29[/C][C]67694.29[/C][C]73544[/C][C]73544[/C][C]73544[/C][/ROW]
[ROW][C]2018[/C][C]67694.29[/C][C]67694.29[/C][C]73544[/C][C]73544[/C][C]73544[/C][/ROW]
[/TABLE]
Source: https://freestatistics.org/blog/index.php?pk=234562&T=1

Globally Unique Identifier (entire table): ba.freestatistics.org/blog/index.php?pk=234562&T=1

As an alternative you can also use a QR Code:  

The GUIDs for individual cells are displayed in the table below:

Boxplot statistics
Variablelower whiskerlower hingemedianupper hingeupper whisker
200748106.6753142.7562936.5670619.14573544
20085353555856.91562936.5670619.14573544
200958178.8358178.8360345.6767694.2973544
201058178.8358178.8367694.297354485332
201158178.8367694.297354479781.3390377.38
201258178.8362936.5670619.14574158.78574773.57
201358178.8362936.5670619.145107419.88141295.76
201458178.8362936.5670619.14589701.735105859.47
201558178.8362936.5670619.14590661.075107778.15
201667694.2967694.29735447354473544
201767694.2967694.29735447354473544
201867694.2967694.29735447354473544


Boxplot Notches
Variablelower boundmedianupper bound
200749130.2079562936.5676742.91205
200851274.398362936.5674598.7217
200953622.069934491160345.6767069.2700655089
201056837.299584554467694.2978551.2804154456
201165003.32798458417354482084.6720154159
201261753.5872570619.14579484.70275
201335477.322270619.145105760.9678
201449474.6567570619.14591763.63325
201548716.7781570619.14592521.51185
201669410.60965006337354477677.3903499367
201769410.60965006337354477677.3903499367
201869410.60965006337354477677.3903499367

\begin{tabular}{lllllllll}
\hline
Boxplot Notches \tabularnewline
Variable & lower bound & median & upper bound \tabularnewline
2007 & 49130.20795 & 62936.56 & 76742.91205 \tabularnewline
2008 & 51274.3983 & 62936.56 & 74598.7217 \tabularnewline
2009 & 53622.0699344911 & 60345.67 & 67069.2700655089 \tabularnewline
2010 & 56837.2995845544 & 67694.29 & 78551.2804154456 \tabularnewline
2011 & 65003.3279845841 & 73544 & 82084.6720154159 \tabularnewline
2012 & 61753.58725 & 70619.145 & 79484.70275 \tabularnewline
2013 & 35477.3222 & 70619.145 & 105760.9678 \tabularnewline
2014 & 49474.65675 & 70619.145 & 91763.63325 \tabularnewline
2015 & 48716.77815 & 70619.145 & 92521.51185 \tabularnewline
2016 & 69410.6096500633 & 73544 & 77677.3903499367 \tabularnewline
2017 & 69410.6096500633 & 73544 & 77677.3903499367 \tabularnewline
2018 & 69410.6096500633 & 73544 & 77677.3903499367 \tabularnewline
\hline
\end{tabular}
%Source: https://freestatistics.org/blog/index.php?pk=234562&T=2

[TABLE]
[ROW][C]Boxplot Notches[/C][/ROW]
[ROW][C]Variable[/C][C]lower bound[/C][C]median[/C][C]upper bound[/C][/ROW]
[ROW][C]2007[/C][C]49130.20795[/C][C]62936.56[/C][C]76742.91205[/C][/ROW]
[ROW][C]2008[/C][C]51274.3983[/C][C]62936.56[/C][C]74598.7217[/C][/ROW]
[ROW][C]2009[/C][C]53622.0699344911[/C][C]60345.67[/C][C]67069.2700655089[/C][/ROW]
[ROW][C]2010[/C][C]56837.2995845544[/C][C]67694.29[/C][C]78551.2804154456[/C][/ROW]
[ROW][C]2011[/C][C]65003.3279845841[/C][C]73544[/C][C]82084.6720154159[/C][/ROW]
[ROW][C]2012[/C][C]61753.58725[/C][C]70619.145[/C][C]79484.70275[/C][/ROW]
[ROW][C]2013[/C][C]35477.3222[/C][C]70619.145[/C][C]105760.9678[/C][/ROW]
[ROW][C]2014[/C][C]49474.65675[/C][C]70619.145[/C][C]91763.63325[/C][/ROW]
[ROW][C]2015[/C][C]48716.77815[/C][C]70619.145[/C][C]92521.51185[/C][/ROW]
[ROW][C]2016[/C][C]69410.6096500633[/C][C]73544[/C][C]77677.3903499367[/C][/ROW]
[ROW][C]2017[/C][C]69410.6096500633[/C][C]73544[/C][C]77677.3903499367[/C][/ROW]
[ROW][C]2018[/C][C]69410.6096500633[/C][C]73544[/C][C]77677.3903499367[/C][/ROW]
[/TABLE]
Source: https://freestatistics.org/blog/index.php?pk=234562&T=2

Globally Unique Identifier (entire table): ba.freestatistics.org/blog/index.php?pk=234562&T=2

As an alternative you can also use a QR Code:  

The GUIDs for individual cells are displayed in the table below:

Boxplot Notches
Variablelower boundmedianupper bound
200749130.2079562936.5676742.91205
200851274.398362936.5674598.7217
200953622.069934491160345.6767069.2700655089
201056837.299584554467694.2978551.2804154456
201165003.32798458417354482084.6720154159
201261753.5872570619.14579484.70275
201335477.322270619.145105760.9678
201449474.6567570619.14591763.63325
201548716.7781570619.14592521.51185
201669410.60965006337354477677.3903499367
201769410.60965006337354477677.3903499367
201869410.60965006337354477677.3903499367


Parameters (Session):
par1 = grey ;
Parameters (R input):
par1 = grey ;
R code (references can be found in the software module):
par1 <- 'grey'
z <- as.data.frame(t(y))
bitmap(file='test1.png')
(r<-boxplot(z ,xlab=xlab,ylab=ylab,main=main,notch=TRUE,col=par1))
dev.off()
load(file='createtable')
a<-table.start()
a<-table.row.start(a)
a<-table.element(a,hyperlink('overview.htm','Boxplot statistics','Boxplot overview'),6,TRUE)
a<-table.row.end(a)
a<-table.row.start(a)
a<-table.element(a,'Variable',1,TRUE)
a<-table.element(a,hyperlink('lower_whisker.htm','lower whisker','definition of lower whisker'),1,TRUE)
a<-table.element(a,hyperlink('lower_hinge.htm','lower hinge','definition of lower hinge'),1,TRUE)
a<-table.element(a,hyperlink('central_tendency.htm','median','definitions about measures of central tendency'),1,TRUE)
a<-table.element(a,hyperlink('upper_hinge.htm','upper hinge','definition of upper hinge'),1,TRUE)
a<-table.element(a,hyperlink('upper_whisker.htm','upper whisker','definition of upper whisker'),1,TRUE)
a<-table.row.end(a)
for (i in 1:length(y[,1]))
{
a<-table.row.start(a)
a<-table.element(a,dimnames(t(x))[[2]][i],1,TRUE)
for (j in 1:5)
{
a<-table.element(a,r$stats[j,i])
}
a<-table.row.end(a)
}
a<-table.end(a)
table.save(a,file='mytable.tab')
a<-table.start()
a<-table.row.start(a)
a<-table.element(a,'Boxplot Notches',4,TRUE)
a<-table.row.end(a)
a<-table.row.start(a)
a<-table.element(a,'Variable',1,TRUE)
a<-table.element(a,'lower bound',1,TRUE)
a<-table.element(a,'median',1,TRUE)
a<-table.element(a,'upper bound',1,TRUE)
a<-table.row.end(a)
for (i in 1:length(y[,1]))
{
a<-table.row.start(a)
a<-table.element(a,dimnames(t(x))[[2]][i],1,TRUE)
a<-table.element(a,r$conf[1,i])
a<-table.element(a,r$stats[3,i])
a<-table.element(a,r$conf[2,i])
a<-table.row.end(a)
}
a<-table.end(a)
table.save(a,file='mytable1.tab')