Free Statistics

of Irreproducible Research!

Author's title

Author*Unverified author*
R Software Modulerwasp_correlation.wasp
Title produced by softwarePearson Correlation
Date of computationTue, 08 Apr 2014 13:56:43 -0400
Cite this page as followsStatistical Computations at FreeStatistics.org, Office for Research Development and Education, URL https://freestatistics.org/blog/index.php?v=date/2014/Apr/08/t13969798760wh6h8n662dad2y.htm/, Retrieved Fri, 17 May 2024 02:32:12 +0000
Statistical Computations at FreeStatistics.org, Office for Research Development and Education, URL https://freestatistics.org/blog/index.php?pk=234425, Retrieved Fri, 17 May 2024 02:32:12 +0000
QR Codes:

Original text written by user:
IsPrivate?No (this computation is public)
User-defined keywords
Estimated Impact188
Family? (F = Feedback message, R = changed R code, M = changed R Module, P = changed Parameters, D = changed Data)
-       [Pearson Correlation] [Tor rate vs Emplo...] [2014-04-08 17:56:43] [d41d8cd98f00b204e9800998ecf8427e] [Current]
Feedback Forum

Post a new message
Dataseries X:
86.45
82.13
82.13
91
91
92
92
91
91
91
91
91
91
91
91
91
91
77
70
70
70
75.25
77
71.75
70
70
70
70
70
70
70
70
70
70
69.13
50
50
50
50
50
38.5
28
28
28
31
31
39.6
39.6
39.6
39.6
39.6
39.6
39.6
39.6
39.1
38.6
35
35
35
35
35
35
35
35
35
39.5
39.5
Dataseries Y:
57671
58043
57728
60401
59908
62010
60186
60964
63411
64404
62731
64267
64673
65850
66493
67351
68763
70439
72188
73439
75379
77367
78863
78588
81573
84452
86819
85187
87985
90808
94755
98480
99713
100571
99672
99179
103967
106989
108837
111408
114037
117022
119203
117652
118144
119542
121930
124955
125862
128891
130814
132947
136701
137783
136177
137434
138453
140654
143741
146320
146086
140707
138752
139655
142079
143393
145742


Summary of computational transaction
Raw Inputview raw input (R code)
Raw Outputview raw output of R engine
Computing time1 seconds
R Server'Gwilym Jenkins' @ jenkins.wessa.net

\begin{tabular}{lllllllll}
\hline
Summary of computational transaction \tabularnewline
Raw Input & view raw input (R code)  \tabularnewline
Raw Output & view raw output of R engine  \tabularnewline
Computing time & 1 seconds \tabularnewline
R Server & 'Gwilym Jenkins' @ jenkins.wessa.net \tabularnewline
\hline
\end{tabular}
%Source: https://freestatistics.org/blog/index.php?pk=234425&T=0

[TABLE]
[ROW][C]Summary of computational transaction[/C][/ROW]
[ROW][C]Raw Input[/C][C]view raw input (R code) [/C][/ROW]
[ROW][C]Raw Output[/C][C]view raw output of R engine [/C][/ROW]
[ROW][C]Computing time[/C][C]1 seconds[/C][/ROW]
[ROW][C]R Server[/C][C]'Gwilym Jenkins' @ jenkins.wessa.net[/C][/ROW]
[/TABLE]
Source: https://freestatistics.org/blog/index.php?pk=234425&T=0

Globally Unique Identifier (entire table): ba.freestatistics.org/blog/index.php?pk=234425&T=0

As an alternative you can also use a QR Code:  

The GUIDs for individual cells are displayed in the table below:

Summary of computational transaction
Raw Inputview raw input (R code)
Raw Outputview raw output of R engine
Computing time1 seconds
R Server'Gwilym Jenkins' @ jenkins.wessa.net


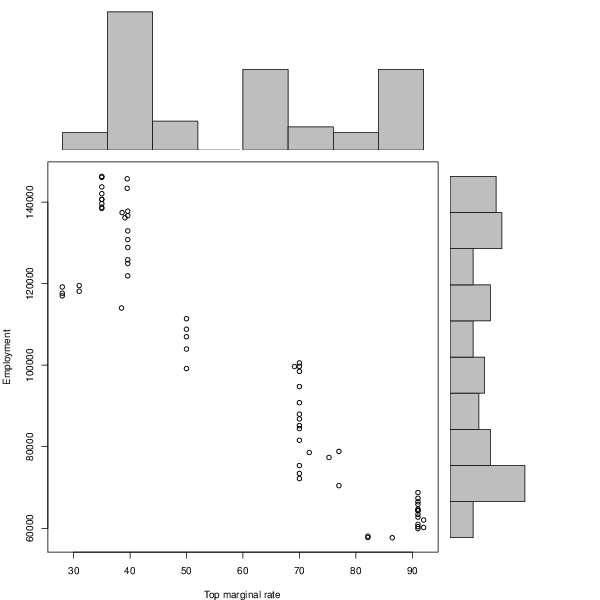
Pearson Product Moment Correlation - Ungrouped Data
StatisticVariable XVariable Y
Mean60.1468656716418100241.611940299
Biased Variance507.394224504344919300941.282245
Biased Standard Deviation22.525412859797830319.9759446185
Covariance-652877.428355947
Correlation-0.941670954329182
Determination0.886744186227232
T-Test-22.5592990176637
p-value (2 sided)1.88823571698704e-32
p-value (1 sided)9.44117858493519e-33
Degrees of Freedom65
Number of Observations67

\begin{tabular}{lllllllll}
\hline
Pearson Product Moment Correlation - Ungrouped Data \tabularnewline
Statistic & Variable X & Variable Y \tabularnewline
Mean & 60.1468656716418 & 100241.611940299 \tabularnewline
Biased Variance & 507.394224504344 & 919300941.282245 \tabularnewline
Biased Standard Deviation & 22.5254128597978 & 30319.9759446185 \tabularnewline
Covariance & -652877.428355947 \tabularnewline
Correlation & -0.941670954329182 \tabularnewline
Determination & 0.886744186227232 \tabularnewline
T-Test & -22.5592990176637 \tabularnewline
p-value (2 sided) & 1.88823571698704e-32 \tabularnewline
p-value (1 sided) & 9.44117858493519e-33 \tabularnewline
Degrees of Freedom & 65 \tabularnewline
Number of Observations & 67 \tabularnewline
\hline
\end{tabular}
%Source: https://freestatistics.org/blog/index.php?pk=234425&T=1

[TABLE]
[ROW][C]Pearson Product Moment Correlation - Ungrouped Data[/C][/ROW]
[ROW][C]Statistic[/C][C]Variable X[/C][C]Variable Y[/C][/ROW]
[ROW][C]Mean[/C][C]60.1468656716418[/C][C]100241.611940299[/C][/ROW]
[ROW][C]Biased Variance[/C][C]507.394224504344[/C][C]919300941.282245[/C][/ROW]
[ROW][C]Biased Standard Deviation[/C][C]22.5254128597978[/C][C]30319.9759446185[/C][/ROW]
[ROW][C]Covariance[/C][C]-652877.428355947[/C][/ROW]
[ROW][C]Correlation[/C][C]-0.941670954329182[/C][/ROW]
[ROW][C]Determination[/C][C]0.886744186227232[/C][/ROW]
[ROW][C]T-Test[/C][C]-22.5592990176637[/C][/ROW]
[ROW][C]p-value (2 sided)[/C][C]1.88823571698704e-32[/C][/ROW]
[ROW][C]p-value (1 sided)[/C][C]9.44117858493519e-33[/C][/ROW]
[ROW][C]Degrees of Freedom[/C][C]65[/C][/ROW]
[ROW][C]Number of Observations[/C][C]67[/C][/ROW]
[/TABLE]
Source: https://freestatistics.org/blog/index.php?pk=234425&T=1

Globally Unique Identifier (entire table): ba.freestatistics.org/blog/index.php?pk=234425&T=1

As an alternative you can also use a QR Code:  

The GUIDs for individual cells are displayed in the table below:

Pearson Product Moment Correlation - Ungrouped Data
StatisticVariable XVariable Y
Mean60.1468656716418100241.611940299
Biased Variance507.394224504344919300941.282245
Biased Standard Deviation22.525412859797830319.9759446185
Covariance-652877.428355947
Correlation-0.941670954329182
Determination0.886744186227232
T-Test-22.5592990176637
p-value (2 sided)1.88823571698704e-32
p-value (1 sided)9.44117858493519e-33
Degrees of Freedom65
Number of Observations67


Parameters (Session):
Parameters (R input):
R code (references can be found in the software module):
x <- x[!is.na(y)]
y <- y[!is.na(y)]
y <- y[!is.na(x)]
x <- x[!is.na(x)]
bitmap(file='test1.png')
histx <- hist(x, plot=FALSE)
histy <- hist(y, plot=FALSE)
maxcounts <- max(c(histx$counts, histx$counts))
xrange <- c(min(x),max(x))
yrange <- c(min(y),max(y))
nf <- layout(matrix(c(2,0,1,3),2,2,byrow=TRUE), c(3,1), c(1,3), TRUE)
par(mar=c(4,4,1,1))
plot(x, y, xlim=xrange, ylim=yrange, xlab=xlab, ylab=ylab)
par(mar=c(0,4,1,1))
barplot(histx$counts, axes=FALSE, ylim=c(0, maxcounts), space=0)
par(mar=c(4,0,1,1))
barplot(histy$counts, axes=FALSE, xlim=c(0, maxcounts), space=0, horiz=TRUE)
dev.off()
lx = length(x)
makebiased = (lx-1)/lx
varx = var(x)*makebiased
vary = var(y)*makebiased
corxy <- cor.test(x,y,method='pearson', na.rm = T)
cxy <- as.matrix(corxy$estimate)[1,1]
load(file='createtable')
a<-table.start()
a<-table.row.start(a)
a<-table.element(a,'Pearson Product Moment Correlation - Ungrouped Data',3,TRUE)
a<-table.row.end(a)
a<-table.row.start(a)
a<-table.element(a,'Statistic',1,TRUE)
a<-table.element(a,'Variable X',1,TRUE)
a<-table.element(a,'Variable Y',1,TRUE)
a<-table.row.end(a)
a<-table.row.start(a)
a<-table.element(a,hyperlink('arithmetic_mean.htm','Mean',''),header=TRUE)
a<-table.element(a,mean(x))
a<-table.element(a,mean(y))
a<-table.row.end(a)
a<-table.row.start(a)
a<-table.element(a,hyperlink('biased.htm','Biased Variance',''),header=TRUE)
a<-table.element(a,varx)
a<-table.element(a,vary)
a<-table.row.end(a)
a<-table.row.start(a)
a<-table.element(a,hyperlink('biased1.htm','Biased Standard Deviation',''),header=TRUE)
a<-table.element(a,sqrt(varx))
a<-table.element(a,sqrt(vary))
a<-table.row.end(a)
a<-table.row.start(a)
a<-table.element(a,hyperlink('covariance.htm','Covariance',''),header=TRUE)
a<-table.element(a,cov(x,y),2)
a<-table.row.end(a)
a<-table.row.start(a)
a<-table.element(a,hyperlink('pearson_correlation.htm','Correlation',''),header=TRUE)
a<-table.element(a,cxy,2)
a<-table.row.end(a)
a<-table.row.start(a)
a<-table.element(a,hyperlink('coeff_of_determination.htm','Determination',''),header=TRUE)
a<-table.element(a,cxy*cxy,2)
a<-table.row.end(a)
a<-table.row.start(a)
a<-table.element(a,hyperlink('ttest_statistic.htm','T-Test',''),header=TRUE)
a<-table.element(a,as.matrix(corxy$statistic)[1,1],2)
a<-table.row.end(a)
a<-table.row.start(a)
a<-table.element(a,'p-value (2 sided)',header=TRUE)
a<-table.element(a,(p2 <- as.matrix(corxy$p.value)[1,1]),2)
a<-table.row.end(a)
a<-table.row.start(a)
a<-table.element(a,'p-value (1 sided)',header=TRUE)
a<-table.element(a,p2/2,2)
a<-table.row.end(a)
a<-table.row.start(a)
a<-table.element(a,'Degrees of Freedom',header=TRUE)
a<-table.element(a,lx-2,2)
a<-table.row.end(a)
a<-table.row.start(a)
a<-table.element(a,'Number of Observations',header=TRUE)
a<-table.element(a,lx,2)
a<-table.row.end(a)
a<-table.end(a)
table.save(a,file='mytable.tab')