Free Statistics

of Irreproducible Research!

Author's title

Author*Unverified author*
R Software Modulerwasp_correlation.wasp
Title produced by softwarePearson Correlation
Date of computationSat, 05 Apr 2014 21:33:05 -0400
Cite this page as followsStatistical Computations at FreeStatistics.org, Office for Research Development and Education, URL https://freestatistics.org/blog/index.php?v=date/2014/Apr/05/t1396748074upifk9rr9fpkdpa.htm/, Retrieved Fri, 17 May 2024 04:18:31 +0000
Statistical Computations at FreeStatistics.org, Office for Research Development and Education, URL https://freestatistics.org/blog/index.php?pk=234404, Retrieved Fri, 17 May 2024 04:18:31 +0000
QR Codes:

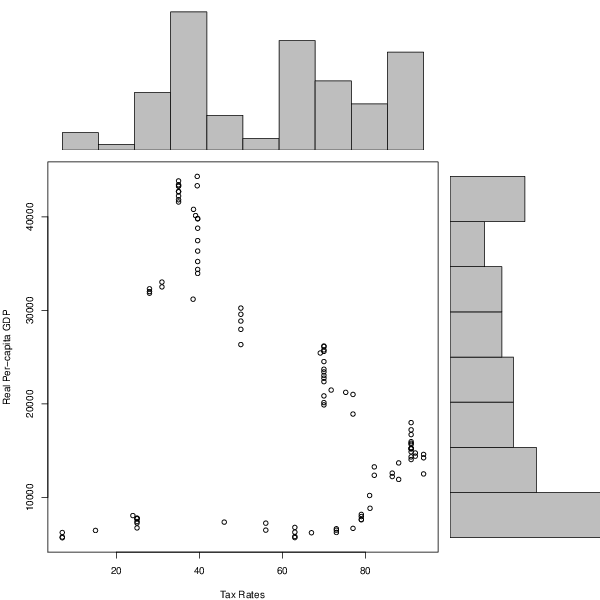
Original text written by user:1913-2014 Top marginal rates vs Real Per-Capita GDP
IsPrivate?No (this computation is public)
User-defined keywords
Estimated Impact185
Family? (F = Feedback message, R = changed R code, M = changed R Module, P = changed Parameters, D = changed Data)
-       [Pearson Correlation] [Rates vs Economy] [2014-04-06 01:33:05] [d41d8cd98f00b204e9800998ecf8427e] [Current]
Feedback Forum

Post a new message
Dataseries X:
7
7
7
15
67
77
73
73
73
56
56
46
25
25
25
25
24
25
25
63
63
63
63
79
79
79
79
81.1
81
88
88
94
94
94
86.45
86.45
82.13
82.13
91
91
92
92
91
91
91
91
91
91
91
91
91
91
77
70
70
70
75.25
77
71.75
70
70
70
70
70
70
70
70
70
70
69.13
50
50
50
50
50
38.5
28
28
28
31
31
39.6
39.6
39.6
39.6
39.6
39.6
39.6
39.6
39.1
38.6
35
35
35
35
35
35
35
35
35
39.5
39.5
Dataseries Y:
6236
5678
5753
6459
6213
6679
6640
6486
6243
6492
7237
7349
7409
7776
7734
7706
8050
7247
6729
5809
5694
6269
6779
7610
7944
7617
8174
8829
10197
11917
13681
14587
14230
12502
12223
12589
12356
13256
14041
14333
14741
14401
15178
15217
15263
14870
15669
15787
15953
16709
17221
17991
18907
19888
20136
20848
21228
21003
21474
22371
23413
23033
22737
23699
24521
25610
26126
25774
26183
25436
26338
27968
28855
29577
30240
31190
32005
32302
31831
32507
33023
33947
34373
35221
36339
37456
38781
39786
39819
40132
40800
41826
42715
43430
43841
43282
41588
42227
42682
43308
43325
44324


Summary of computational transaction
Raw Inputview raw input (R code)
Raw Outputview raw output of R engine
Computing time2 seconds
R Server'Herman Ole Andreas Wold' @ wold.wessa.net

\begin{tabular}{lllllllll}
\hline
Summary of computational transaction \tabularnewline
Raw Input & view raw input (R code)  \tabularnewline
Raw Output & view raw output of R engine  \tabularnewline
Computing time & 2 seconds \tabularnewline
R Server & 'Herman Ole Andreas Wold' @ wold.wessa.net \tabularnewline
\hline
\end{tabular}
%Source: https://freestatistics.org/blog/index.php?pk=234404&T=0

[TABLE]
[ROW][C]Summary of computational transaction[/C][/ROW]
[ROW][C]Raw Input[/C][C]view raw input (R code) [/C][/ROW]
[ROW][C]Raw Output[/C][C]view raw output of R engine [/C][/ROW]
[ROW][C]Computing time[/C][C]2 seconds[/C][/ROW]
[ROW][C]R Server[/C][C]'Herman Ole Andreas Wold' @ wold.wessa.net[/C][/ROW]
[/TABLE]
Source: https://freestatistics.org/blog/index.php?pk=234404&T=0

Globally Unique Identifier (entire table): ba.freestatistics.org/blog/index.php?pk=234404&T=0

As an alternative you can also use a QR Code:  

The GUIDs for individual cells are displayed in the table below:

Summary of computational transaction
Raw Inputview raw input (R code)
Raw Outputview raw output of R engine
Computing time2 seconds
R Server'Herman Ole Andreas Wold' @ wold.wessa.net


Pearson Product Moment Correlation - Ungrouped Data
StatisticVariable XVariable Y
Mean59.170490196078420952.7254901961
Biased Variance609.798881132257157061668.591311
Biased Standard Deviation24.694106202336212532.4246892336
Covariance-114681.870854203
Correlation-0.366933662777746
Determination0.134640312879493
T-Test-3.94447516712856
p-value (2 sided)0.000148608933310445
p-value (1 sided)7.43044666552225e-05
Degrees of Freedom100
Number of Observations102

\begin{tabular}{lllllllll}
\hline
Pearson Product Moment Correlation - Ungrouped Data \tabularnewline
Statistic & Variable X & Variable Y \tabularnewline
Mean & 59.1704901960784 & 20952.7254901961 \tabularnewline
Biased Variance & 609.798881132257 & 157061668.591311 \tabularnewline
Biased Standard Deviation & 24.6941062023362 & 12532.4246892336 \tabularnewline
Covariance & -114681.870854203 \tabularnewline
Correlation & -0.366933662777746 \tabularnewline
Determination & 0.134640312879493 \tabularnewline
T-Test & -3.94447516712856 \tabularnewline
p-value (2 sided) & 0.000148608933310445 \tabularnewline
p-value (1 sided) & 7.43044666552225e-05 \tabularnewline
Degrees of Freedom & 100 \tabularnewline
Number of Observations & 102 \tabularnewline
\hline
\end{tabular}
%Source: https://freestatistics.org/blog/index.php?pk=234404&T=1

[TABLE]
[ROW][C]Pearson Product Moment Correlation - Ungrouped Data[/C][/ROW]
[ROW][C]Statistic[/C][C]Variable X[/C][C]Variable Y[/C][/ROW]
[ROW][C]Mean[/C][C]59.1704901960784[/C][C]20952.7254901961[/C][/ROW]
[ROW][C]Biased Variance[/C][C]609.798881132257[/C][C]157061668.591311[/C][/ROW]
[ROW][C]Biased Standard Deviation[/C][C]24.6941062023362[/C][C]12532.4246892336[/C][/ROW]
[ROW][C]Covariance[/C][C]-114681.870854203[/C][/ROW]
[ROW][C]Correlation[/C][C]-0.366933662777746[/C][/ROW]
[ROW][C]Determination[/C][C]0.134640312879493[/C][/ROW]
[ROW][C]T-Test[/C][C]-3.94447516712856[/C][/ROW]
[ROW][C]p-value (2 sided)[/C][C]0.000148608933310445[/C][/ROW]
[ROW][C]p-value (1 sided)[/C][C]7.43044666552225e-05[/C][/ROW]
[ROW][C]Degrees of Freedom[/C][C]100[/C][/ROW]
[ROW][C]Number of Observations[/C][C]102[/C][/ROW]
[/TABLE]
Source: https://freestatistics.org/blog/index.php?pk=234404&T=1

Globally Unique Identifier (entire table): ba.freestatistics.org/blog/index.php?pk=234404&T=1

As an alternative you can also use a QR Code:  

The GUIDs for individual cells are displayed in the table below:

Pearson Product Moment Correlation - Ungrouped Data
StatisticVariable XVariable Y
Mean59.170490196078420952.7254901961
Biased Variance609.798881132257157061668.591311
Biased Standard Deviation24.694106202336212532.4246892336
Covariance-114681.870854203
Correlation-0.366933662777746
Determination0.134640312879493
T-Test-3.94447516712856
p-value (2 sided)0.000148608933310445
p-value (1 sided)7.43044666552225e-05
Degrees of Freedom100
Number of Observations102


Parameters (Session):
Parameters (R input):
R code (references can be found in the software module):
x <- x[!is.na(y)]
y <- y[!is.na(y)]
y <- y[!is.na(x)]
x <- x[!is.na(x)]
bitmap(file='test1.png')
histx <- hist(x, plot=FALSE)
histy <- hist(y, plot=FALSE)
maxcounts <- max(c(histx$counts, histx$counts))
xrange <- c(min(x),max(x))
yrange <- c(min(y),max(y))
nf <- layout(matrix(c(2,0,1,3),2,2,byrow=TRUE), c(3,1), c(1,3), TRUE)
par(mar=c(4,4,1,1))
plot(x, y, xlim=xrange, ylim=yrange, xlab=xlab, ylab=ylab)
par(mar=c(0,4,1,1))
barplot(histx$counts, axes=FALSE, ylim=c(0, maxcounts), space=0)
par(mar=c(4,0,1,1))
barplot(histy$counts, axes=FALSE, xlim=c(0, maxcounts), space=0, horiz=TRUE)
dev.off()
lx = length(x)
makebiased = (lx-1)/lx
varx = var(x)*makebiased
vary = var(y)*makebiased
corxy <- cor.test(x,y,method='pearson', na.rm = T)
cxy <- as.matrix(corxy$estimate)[1,1]
load(file='createtable')
a<-table.start()
a<-table.row.start(a)
a<-table.element(a,'Pearson Product Moment Correlation - Ungrouped Data',3,TRUE)
a<-table.row.end(a)
a<-table.row.start(a)
a<-table.element(a,'Statistic',1,TRUE)
a<-table.element(a,'Variable X',1,TRUE)
a<-table.element(a,'Variable Y',1,TRUE)
a<-table.row.end(a)
a<-table.row.start(a)
a<-table.element(a,hyperlink('arithmetic_mean.htm','Mean',''),header=TRUE)
a<-table.element(a,mean(x))
a<-table.element(a,mean(y))
a<-table.row.end(a)
a<-table.row.start(a)
a<-table.element(a,hyperlink('biased.htm','Biased Variance',''),header=TRUE)
a<-table.element(a,varx)
a<-table.element(a,vary)
a<-table.row.end(a)
a<-table.row.start(a)
a<-table.element(a,hyperlink('biased1.htm','Biased Standard Deviation',''),header=TRUE)
a<-table.element(a,sqrt(varx))
a<-table.element(a,sqrt(vary))
a<-table.row.end(a)
a<-table.row.start(a)
a<-table.element(a,hyperlink('covariance.htm','Covariance',''),header=TRUE)
a<-table.element(a,cov(x,y),2)
a<-table.row.end(a)
a<-table.row.start(a)
a<-table.element(a,hyperlink('pearson_correlation.htm','Correlation',''),header=TRUE)
a<-table.element(a,cxy,2)
a<-table.row.end(a)
a<-table.row.start(a)
a<-table.element(a,hyperlink('coeff_of_determination.htm','Determination',''),header=TRUE)
a<-table.element(a,cxy*cxy,2)
a<-table.row.end(a)
a<-table.row.start(a)
a<-table.element(a,hyperlink('ttest_statistic.htm','T-Test',''),header=TRUE)
a<-table.element(a,as.matrix(corxy$statistic)[1,1],2)
a<-table.row.end(a)
a<-table.row.start(a)
a<-table.element(a,'p-value (2 sided)',header=TRUE)
a<-table.element(a,(p2 <- as.matrix(corxy$p.value)[1,1]),2)
a<-table.row.end(a)
a<-table.row.start(a)
a<-table.element(a,'p-value (1 sided)',header=TRUE)
a<-table.element(a,p2/2,2)
a<-table.row.end(a)
a<-table.row.start(a)
a<-table.element(a,'Degrees of Freedom',header=TRUE)
a<-table.element(a,lx-2,2)
a<-table.row.end(a)
a<-table.row.start(a)
a<-table.element(a,'Number of Observations',header=TRUE)
a<-table.element(a,lx,2)
a<-table.row.end(a)
a<-table.end(a)
table.save(a,file='mytable.tab')