Free Statistics
of Irreproducible Research!
Description of Statistical Computation | |||||||||||||||||||||||||||||||||||||||||
|---|---|---|---|---|---|---|---|---|---|---|---|---|---|---|---|---|---|---|---|---|---|---|---|---|---|---|---|---|---|---|---|---|---|---|---|---|---|---|---|---|---|
| Author's title | |||||||||||||||||||||||||||||||||||||||||
| Author | *Unverified author* | ||||||||||||||||||||||||||||||||||||||||
| R Software Module | rwasp_univariatedataseries.wasp | ||||||||||||||||||||||||||||||||||||||||
| Title produced by software | Univariate Data Series | ||||||||||||||||||||||||||||||||||||||||
| Date of computation | Tue, 12 Feb 2013 08:22:58 -0500 | ||||||||||||||||||||||||||||||||||||||||
| Cite this page as follows | Statistical Computations at FreeStatistics.org, Office for Research Development and Education, URL https://freestatistics.org/blog/index.php?v=date/2013/Feb/12/t1360675682z14fk5emm9lv3ff.htm/, Retrieved Tue, 21 May 2024 17:05:52 +0000 | ||||||||||||||||||||||||||||||||||||||||
| Statistical Computations at FreeStatistics.org, Office for Research Development and Education, URL https://freestatistics.org/blog/index.php?pk=206352, Retrieved Tue, 21 May 2024 17:05:52 +0000 | |||||||||||||||||||||||||||||||||||||||||
| QR Codes: | |||||||||||||||||||||||||||||||||||||||||
|
| |||||||||||||||||||||||||||||||||||||||||
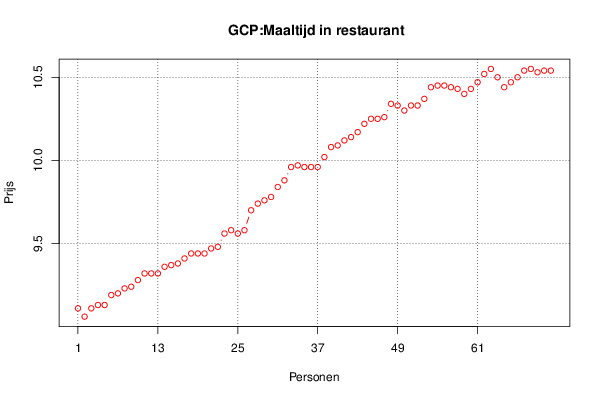
| Original text written by user: | De evolutie van de gemiddelde prijs van een maaltijd in een restaurant. De grafiek geeft weer dat de gemiddelde prijs €9,11 (2006-01) duurder wordt € 10,85 (2010-10) | ||||||||||||||||||||||||||||||||||||||||
| IsPrivate? | No (this computation is public) | ||||||||||||||||||||||||||||||||||||||||
| User-defined keywords | |||||||||||||||||||||||||||||||||||||||||
| Estimated Impact | 126 | ||||||||||||||||||||||||||||||||||||||||
Tree of Dependent Computations | |||||||||||||||||||||||||||||||||||||||||
| Family? (F = Feedback message, R = changed R code, M = changed R Module, P = changed Parameters, D = changed Data) | |||||||||||||||||||||||||||||||||||||||||
| - [Univariate Data Series] [Gemiddelde consum...] [2013-02-04 23:50:25] [812272bcf10cd97986bd11f9adf3f369] - R PD [Univariate Data Series] [] [2013-02-12 13:22:58] [1f4ca98ed28755372cdf3133ccb2c2d2] [Current] - RMPD [Histogram] [Maaltijd in resta...] [2013-02-12 19:06:12] [812272bcf10cd97986bd11f9adf3f369] - RMPD [Histogram] [Maaltijd in resta...] [2013-02-12 19:15:03] [812272bcf10cd97986bd11f9adf3f369] - RMPD [Histogram] [Maaltijd in resta...] [2013-02-12 19:25:51] [812272bcf10cd97986bd11f9adf3f369] - RMPD [Kernel Density Estimation] [Maaltijd in resta...] [2013-02-12 19:30:52] [812272bcf10cd97986bd11f9adf3f369] | |||||||||||||||||||||||||||||||||||||||||
| Feedback Forum | |||||||||||||||||||||||||||||||||||||||||
Post a new message | |||||||||||||||||||||||||||||||||||||||||
Dataset | |||||||||||||||||||||||||||||||||||||||||
| Dataseries X: | |||||||||||||||||||||||||||||||||||||||||
9,11 9,06 9,11 9,13 9,13 9,19 9,2 9,23 9,24 9,28 9,32 9,32 9,32 9,36 9,37 9,38 9,41 9,44 9,44 9,44 9,47 9,48 9,56 9,58 9,56 9,58 9,7 9,74 9,76 9,78 9,84 9,88 9,96 9,97 9,96 9,96 9,96 10,02 10,08 10,09 10,12 10,14 10,17 10,22 10,25 10,25 10,26 10,34 10,33 10,3 10,33 10,33 10,37 10,44 10,45 10,45 10,44 10,43 10,4 10,43 10,47 10,52 10,55 10,5 10,44 10,47 10,5 10,54 10,55 10,53 10,54 10,54 | |||||||||||||||||||||||||||||||||||||||||
Tables (Output of Computation) | |||||||||||||||||||||||||||||||||||||||||
| |||||||||||||||||||||||||||||||||||||||||
Figures (Output of Computation) | |||||||||||||||||||||||||||||||||||||||||
Input Parameters & R Code | |||||||||||||||||||||||||||||||||||||||||
| Parameters (Session): | |||||||||||||||||||||||||||||||||||||||||
| par1 = Gemiddelde consumptieprijzen per product: catering - restaurants en caf�s ; par2 = Belgostat (NBB) ; par3 = Gemiddelde consumptieprijzen per product: catering - restaurants en caf�s ; par4 = 12 ; | |||||||||||||||||||||||||||||||||||||||||
| Parameters (R input): | |||||||||||||||||||||||||||||||||||||||||
| par1 = Gemiddelde consumptieprijzen per product: catering - restaurants en caf�s ; par2 = Belgostat (NBB) ; par3 = Gemiddelde consumptieprijzen per product: catering - restaurants en caf�s ; par4 = 12 ; | |||||||||||||||||||||||||||||||||||||||||
| R code (references can be found in the software module): | |||||||||||||||||||||||||||||||||||||||||
par4 <- '12' | |||||||||||||||||||||||||||||||||||||||||