Free Statistics
of Irreproducible Research!
Description of Statistical Computation | |||||||||||||||||||||||||||||||||||||||||
|---|---|---|---|---|---|---|---|---|---|---|---|---|---|---|---|---|---|---|---|---|---|---|---|---|---|---|---|---|---|---|---|---|---|---|---|---|---|---|---|---|---|
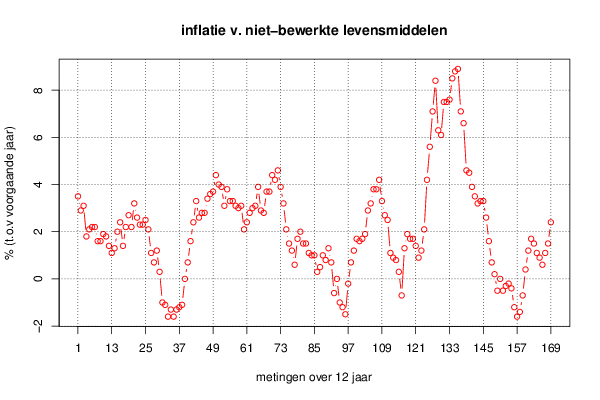
| Author's title | inflatie v. niet-bewerkte levensmiddelen (vlees, vis, groenten en fruit) v... | ||||||||||||||||||||||||||||||||||||||||
| Author | *Unverified author* | ||||||||||||||||||||||||||||||||||||||||
| R Software Module | rwasp_univariatedataseries.wasp | ||||||||||||||||||||||||||||||||||||||||
| Title produced by software | Univariate Data Series | ||||||||||||||||||||||||||||||||||||||||
| Date of computation | Sat, 22 Sep 2012 10:26:12 -0400 | ||||||||||||||||||||||||||||||||||||||||
| Cite this page as follows | Statistical Computations at FreeStatistics.org, Office for Research Development and Education, URL https://freestatistics.org/blog/index.php?v=date/2012/Sep/22/t13483243722dl76l45zzj0tgt.htm/, Retrieved Mon, 29 Apr 2024 09:17:00 +0000 | ||||||||||||||||||||||||||||||||||||||||
| Statistical Computations at FreeStatistics.org, Office for Research Development and Education, URL https://freestatistics.org/blog/index.php?pk=169727, Retrieved Mon, 29 Apr 2024 09:17:00 +0000 | |||||||||||||||||||||||||||||||||||||||||
| QR Codes: | |||||||||||||||||||||||||||||||||||||||||
|
| |||||||||||||||||||||||||||||||||||||||||
| Original text written by user: | |||||||||||||||||||||||||||||||||||||||||
| IsPrivate? | No (this computation is public) | ||||||||||||||||||||||||||||||||||||||||
| User-defined keywords | |||||||||||||||||||||||||||||||||||||||||
| Estimated Impact | 185 | ||||||||||||||||||||||||||||||||||||||||
Tree of Dependent Computations | |||||||||||||||||||||||||||||||||||||||||
| Family? (F = Feedback message, R = changed R code, M = changed R Module, P = changed Parameters, D = changed Data) | |||||||||||||||||||||||||||||||||||||||||
| - [Univariate Data Series] [inflatie v. niet-...] [2012-09-22 14:26:12] [19a5fa3cc9952272699ac0aa748608b8] [Current] | |||||||||||||||||||||||||||||||||||||||||
| Feedback Forum | |||||||||||||||||||||||||||||||||||||||||
Post a new message | |||||||||||||||||||||||||||||||||||||||||
Dataset | |||||||||||||||||||||||||||||||||||||||||
| Dataseries X: | |||||||||||||||||||||||||||||||||||||||||
3,5 2,9 3,1 1,8 2,1 2,2 2,2 1,6 1,6 1,9 1,8 1,4 1,1 1,3 2 2,4 1,4 2,2 2,7 2,2 3,2 2,6 2,3 2,3 2,5 2,1 1,1 0,7 1,2 0,3 -1 -1,1 -1,6 -1,3 -1,6 -1,3 -1,2 -1,1 0 0,7 1,6 2,4 3,3 2,6 2,8 2,8 3,4 3,6 3,7 4,4 4 3,9 3,1 3,8 3,3 3,3 3,1 3 3,1 2,1 2,4 2,8 3 3,1 3,9 2,9 2,8 3,7 3,7 4,4 4,2 4,6 3,9 3,2 2,1 1,5 1,2 0,6 1,7 2 1,5 1,5 1,1 1 1 0,3 0,5 1 0,8 1,3 0,7 -0,6 0 -1 -1,2 -1,5 -0,2 0,7 1,2 1,7 1,6 1,7 1,9 2,9 3,2 3,8 3,8 4,2 3,3 2,7 2,5 1,1 0,9 0,8 0,3 -0,7 1,3 1,9 1,7 1,7 1,4 0,9 1,2 2,1 4,2 5,6 7,1 8,4 6,3 6,1 7,5 7,5 7,6 8,5 8,8 8,9 7,1 6,6 4,6 4,5 3,9 3,5 3,2 3,3 3,3 2,6 1,6 0,7 0,2 -0,5 0 -0,5 -0,3 -0,2 -0,4 -1,2 -1,6 -1,4 -0,7 0,4 1,2 1,7 1,5 1,1 0,9 0,6 1,1 1,5 2,4 | |||||||||||||||||||||||||||||||||||||||||
Tables (Output of Computation) | |||||||||||||||||||||||||||||||||||||||||
| |||||||||||||||||||||||||||||||||||||||||
Figures (Output of Computation) | |||||||||||||||||||||||||||||||||||||||||
Input Parameters & R Code | |||||||||||||||||||||||||||||||||||||||||
| Parameters (Session): | |||||||||||||||||||||||||||||||||||||||||
| par1 = Geharmoniseerde consumptieprijsindex: Eurogebied, Niet-bewerkte levensmiddelen (fruit, groenten, vlees en vis) veranderingspercentagesperiode t.o.v. de overeenstemmende van het voorgaande jaar ; par2 = Belgostat ; par3 = inflatie van vlees, vis, groenten en fruit t.o.v voorgaande jaar ; par4 = 12 ; | |||||||||||||||||||||||||||||||||||||||||
| Parameters (R input): | |||||||||||||||||||||||||||||||||||||||||
| par1 = Geharmoniseerde consumptieprijsindex: Eurogebied, Niet-bewerkte levensmiddelen (fruit, groenten, vlees en vis) veranderingspercentagesperiode t.o.v. de overeenstemmende van het voorgaande jaar ; par2 = Belgostat ; par3 = inflatie van vlees, vis, groenten en fruit t.o.v voorgaande jaar ; par4 = 12 ; | |||||||||||||||||||||||||||||||||||||||||
| R code (references can be found in the software module): | |||||||||||||||||||||||||||||||||||||||||
if (par4 != 'No season') { | |||||||||||||||||||||||||||||||||||||||||