Free Statistics
of Irreproducible Research!
Description of Statistical Computation | |||||||||||||||||||||||||||||||||||||||||
|---|---|---|---|---|---|---|---|---|---|---|---|---|---|---|---|---|---|---|---|---|---|---|---|---|---|---|---|---|---|---|---|---|---|---|---|---|---|---|---|---|---|
| Author's title | |||||||||||||||||||||||||||||||||||||||||
| Author | *Unverified author* | ||||||||||||||||||||||||||||||||||||||||
| R Software Module | rwasp_univariatedataseries.wasp | ||||||||||||||||||||||||||||||||||||||||
| Title produced by software | Univariate Data Series | ||||||||||||||||||||||||||||||||||||||||
| Date of computation | Fri, 21 Sep 2012 06:40:58 -0400 | ||||||||||||||||||||||||||||||||||||||||
| Cite this page as follows | Statistical Computations at FreeStatistics.org, Office for Research Development and Education, URL https://freestatistics.org/blog/index.php?v=date/2012/Sep/21/t1348225589b3boxv1ncwuitn2.htm/, Retrieved Tue, 30 Apr 2024 13:07:02 +0000 | ||||||||||||||||||||||||||||||||||||||||
| Statistical Computations at FreeStatistics.org, Office for Research Development and Education, URL https://freestatistics.org/blog/index.php?pk=169695, Retrieved Tue, 30 Apr 2024 13:07:02 +0000 | |||||||||||||||||||||||||||||||||||||||||
| QR Codes: | |||||||||||||||||||||||||||||||||||||||||
|
| |||||||||||||||||||||||||||||||||||||||||
| Original text written by user: | |||||||||||||||||||||||||||||||||||||||||
| IsPrivate? | No (this computation is public) | ||||||||||||||||||||||||||||||||||||||||
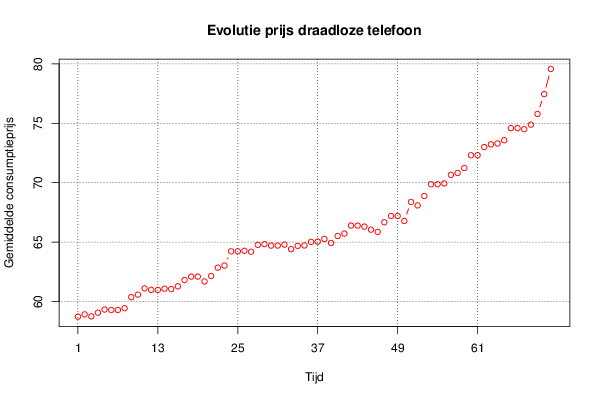
| User-defined keywords | Gemiddelde consumptieprijs van een draadloze telefoon. | ||||||||||||||||||||||||||||||||||||||||
| Estimated Impact | 140 | ||||||||||||||||||||||||||||||||||||||||
Tree of Dependent Computations | |||||||||||||||||||||||||||||||||||||||||
| Family? (F = Feedback message, R = changed R code, M = changed R Module, P = changed Parameters, D = changed Data) | |||||||||||||||||||||||||||||||||||||||||
| - [Univariate Data Series] [Evolutie prijs dr...] [2012-09-21 10:40:58] [094ed89fe81fbe7ca359945eca8d835d] [Current] | |||||||||||||||||||||||||||||||||||||||||
| Feedback Forum | |||||||||||||||||||||||||||||||||||||||||
Post a new message | |||||||||||||||||||||||||||||||||||||||||
Dataset | |||||||||||||||||||||||||||||||||||||||||
| Dataseries X: | |||||||||||||||||||||||||||||||||||||||||
58,73 58,92 58,75 59,06 59,33 59,29 59,29 59,44 60,37 60,58 61,11 60,98 60,98 61,08 61,05 61,28 61,81 62,1 62,1 61,69 62,15 62,85 63,03 64,23 64,23 64,27 64,19 64,77 64,83 64,71 64,71 64,79 64,41 64,68 64,72 65,02 65,04 65,27 64,93 65,52 65,72 66,39 66,39 66,31 66,05 65,86 66,67 67,2 67,2 66,78 68,38 68,09 68,88 69,87 69,87 69,94 70,66 70,82 71,24 72,31 72,31 73 73,23 73,3 73,57 74,59 74,59 74,5 74,88 75,79 77,45 79,57 | |||||||||||||||||||||||||||||||||||||||||
Tables (Output of Computation) | |||||||||||||||||||||||||||||||||||||||||
| |||||||||||||||||||||||||||||||||||||||||
Figures (Output of Computation) | |||||||||||||||||||||||||||||||||||||||||
Input Parameters & R Code | |||||||||||||||||||||||||||||||||||||||||
| Parameters (Session): | |||||||||||||||||||||||||||||||||||||||||
| par1 = Gemiddelde consumptieprijs draadloze telefoon ; par2 = Belgostat (http://www.nbb.be/belgostat/PresentationLinker?TableId=696000085&Lang=N) ; par3 = Deze grafiek geeft de gemiddelde consumptieprijs weer van een draadloze telefoon per maand(2006-2011). ; par4 = 12 ; | |||||||||||||||||||||||||||||||||||||||||
| Parameters (R input): | |||||||||||||||||||||||||||||||||||||||||
| par1 = Gemiddelde consumptieprijs draadloze telefoon ; par2 = Belgostat (http://www.nbb.be/belgostat/PresentationLinker?TableId=696000085&Lang=N) ; par3 = Deze grafiek geeft de gemiddelde consumptieprijs weer van een draadloze telefoon per maand(2006-2011). ; par4 = 12 ; | |||||||||||||||||||||||||||||||||||||||||
| R code (references can be found in the software module): | |||||||||||||||||||||||||||||||||||||||||
if (par4 != 'No season') { | |||||||||||||||||||||||||||||||||||||||||