Free Statistics
of Irreproducible Research!
Description of Statistical Computation | |||||||||||||||||||||||||||||||||||||||||||||||||||||||||||||||||||||||||||||||||||||||||||||||||||||||||||||||||||||||||||||||||||||||||||||||||||||||||||||||||||||||||||||||
|---|---|---|---|---|---|---|---|---|---|---|---|---|---|---|---|---|---|---|---|---|---|---|---|---|---|---|---|---|---|---|---|---|---|---|---|---|---|---|---|---|---|---|---|---|---|---|---|---|---|---|---|---|---|---|---|---|---|---|---|---|---|---|---|---|---|---|---|---|---|---|---|---|---|---|---|---|---|---|---|---|---|---|---|---|---|---|---|---|---|---|---|---|---|---|---|---|---|---|---|---|---|---|---|---|---|---|---|---|---|---|---|---|---|---|---|---|---|---|---|---|---|---|---|---|---|---|---|---|---|---|---|---|---|---|---|---|---|---|---|---|---|---|---|---|---|---|---|---|---|---|---|---|---|---|---|---|---|---|---|---|---|---|---|---|---|---|---|---|---|---|---|---|---|---|---|
| Author's title | |||||||||||||||||||||||||||||||||||||||||||||||||||||||||||||||||||||||||||||||||||||||||||||||||||||||||||||||||||||||||||||||||||||||||||||||||||||||||||||||||||||||||||||||
| Author | *The author of this computation has been verified* | ||||||||||||||||||||||||||||||||||||||||||||||||||||||||||||||||||||||||||||||||||||||||||||||||||||||||||||||||||||||||||||||||||||||||||||||||||||||||||||||||||||||||||||||
| R Software Module | rwasp_One Factor ANOVA.wasp | ||||||||||||||||||||||||||||||||||||||||||||||||||||||||||||||||||||||||||||||||||||||||||||||||||||||||||||||||||||||||||||||||||||||||||||||||||||||||||||||||||||||||||||||
| Title produced by software | One-Way-Between-Groups ANOVA- Free Statistics Software (Calculator) | ||||||||||||||||||||||||||||||||||||||||||||||||||||||||||||||||||||||||||||||||||||||||||||||||||||||||||||||||||||||||||||||||||||||||||||||||||||||||||||||||||||||||||||||
| Date of computation | Thu, 25 Oct 2012 09:27:22 -0400 | ||||||||||||||||||||||||||||||||||||||||||||||||||||||||||||||||||||||||||||||||||||||||||||||||||||||||||||||||||||||||||||||||||||||||||||||||||||||||||||||||||||||||||||||
| Cite this page as follows | Statistical Computations at FreeStatistics.org, Office for Research Development and Education, URL https://freestatistics.org/blog/index.php?v=date/2012/Oct/25/t1351171683ffy1vfircl3csk8.htm/, Retrieved Sun, 28 Apr 2024 21:42:28 +0000 | ||||||||||||||||||||||||||||||||||||||||||||||||||||||||||||||||||||||||||||||||||||||||||||||||||||||||||||||||||||||||||||||||||||||||||||||||||||||||||||||||||||||||||||||
| Statistical Computations at FreeStatistics.org, Office for Research Development and Education, URL https://freestatistics.org/blog/index.php?pk=183639, Retrieved Sun, 28 Apr 2024 21:42:28 +0000 | |||||||||||||||||||||||||||||||||||||||||||||||||||||||||||||||||||||||||||||||||||||||||||||||||||||||||||||||||||||||||||||||||||||||||||||||||||||||||||||||||||||||||||||||
| QR Codes: | |||||||||||||||||||||||||||||||||||||||||||||||||||||||||||||||||||||||||||||||||||||||||||||||||||||||||||||||||||||||||||||||||||||||||||||||||||||||||||||||||||||||||||||||
|
| |||||||||||||||||||||||||||||||||||||||||||||||||||||||||||||||||||||||||||||||||||||||||||||||||||||||||||||||||||||||||||||||||||||||||||||||||||||||||||||||||||||||||||||||
| Original text written by user: | |||||||||||||||||||||||||||||||||||||||||||||||||||||||||||||||||||||||||||||||||||||||||||||||||||||||||||||||||||||||||||||||||||||||||||||||||||||||||||||||||||||||||||||||
| IsPrivate? | No (this computation is public) | ||||||||||||||||||||||||||||||||||||||||||||||||||||||||||||||||||||||||||||||||||||||||||||||||||||||||||||||||||||||||||||||||||||||||||||||||||||||||||||||||||||||||||||||
| User-defined keywords | |||||||||||||||||||||||||||||||||||||||||||||||||||||||||||||||||||||||||||||||||||||||||||||||||||||||||||||||||||||||||||||||||||||||||||||||||||||||||||||||||||||||||||||||
| Estimated Impact | 54 | ||||||||||||||||||||||||||||||||||||||||||||||||||||||||||||||||||||||||||||||||||||||||||||||||||||||||||||||||||||||||||||||||||||||||||||||||||||||||||||||||||||||||||||||
Tree of Dependent Computations | |||||||||||||||||||||||||||||||||||||||||||||||||||||||||||||||||||||||||||||||||||||||||||||||||||||||||||||||||||||||||||||||||||||||||||||||||||||||||||||||||||||||||||||||
| Family? (F = Feedback message, R = changed R code, M = changed R Module, P = changed Parameters, D = changed Data) | |||||||||||||||||||||||||||||||||||||||||||||||||||||||||||||||||||||||||||||||||||||||||||||||||||||||||||||||||||||||||||||||||||||||||||||||||||||||||||||||||||||||||||||||
| - [One-Way-Between-Groups ANOVA- Free Statistics Software (Calculator)] [Question 7 lange ...] [2012-10-25 13:27:22] [ec11e18da977a3fdb62251c67aec28fe] [Current] | |||||||||||||||||||||||||||||||||||||||||||||||||||||||||||||||||||||||||||||||||||||||||||||||||||||||||||||||||||||||||||||||||||||||||||||||||||||||||||||||||||||||||||||||
| Feedback Forum | |||||||||||||||||||||||||||||||||||||||||||||||||||||||||||||||||||||||||||||||||||||||||||||||||||||||||||||||||||||||||||||||||||||||||||||||||||||||||||||||||||||||||||||||
Post a new message | |||||||||||||||||||||||||||||||||||||||||||||||||||||||||||||||||||||||||||||||||||||||||||||||||||||||||||||||||||||||||||||||||||||||||||||||||||||||||||||||||||||||||||||||
Dataset | |||||||||||||||||||||||||||||||||||||||||||||||||||||||||||||||||||||||||||||||||||||||||||||||||||||||||||||||||||||||||||||||||||||||||||||||||||||||||||||||||||||||||||||||
| Dataseries X: | |||||||||||||||||||||||||||||||||||||||||||||||||||||||||||||||||||||||||||||||||||||||||||||||||||||||||||||||||||||||||||||||||||||||||||||||||||||||||||||||||||||||||||||||
'WWE' 0 0 0 0 0 0 'WWE' 0 0 0 0 0 0 'WWE' 0 1 1 1 1 2 'WWE' 0 0 0 0 0 0 'WWE' 0 1 1 1 1 2 'WWE' 0 0 1 0 1 1 'WWE' 0 0 0 0 0 0 'WWE' 0 1 1 1 1 2 'WWE' 0 0 0 0 0 0 'WWE' 0 0 0 0 0 0 'WWE' 0 0 0 0 0 0 'WWE' 0 0 0 0 0 0 'WWE' 0 0 0 0 0 0 'WWE' 0 0 NA 0 NA NA 'WWE' 0 0 1 0 1 1 'WWE' 1 1 NA 0 NA NA 'WWE' 1 0 0 -1 -1 -1 'WWE' 0 0 0 0 0 0 'WWE' 0 0 1 0 1 1 'WWE' 0 1 0 1 0 1 'WWE' 0 0 0 0 0 0 'WWE' 1 1 0 0 -1 0 'WWE' 0 0 0 0 0 0 'WWE' 0 1 0 1 0 1 'WWE' 0 1 1 1 1 2 'WWE' 0 1 1 1 1 2 'WWE' 0 0 0 0 0 0 'WWE' 1 1 0 0 -1 0 'WWE' 0 1 0 1 0 1 'WWE' 0 1 0 1 0 1 'WWE' 0 0 1 0 1 1 'WWE' 0 1 0 1 0 1 'WWE' 0 1 0 1 0 1 'WWE' 0 0 0 0 0 0 'WWE' 0 0 0 0 0 0 'WWE' 1 1 0 0 -1 0 'WWE' 1 1 0 0 -1 0 'WWE' 0 0 0 0 0 0 'WWE' 0 0 NA 0 NA NA 'WWE' 0 0 1 0 1 1 'WWE' 0 0 0 0 0 0 'CSWE' 0.256097561 0.529268293 0.076923077 0.273170732 0.076923077 0 'CSWE' 0.261324042 0.535888502 0.043956044 0.27456446 0.043956044 NA 'CSWE' 0.266550523 0.542508711 0.010989011 0.275958188 0.010989011 0 'CSWE' 0.271777003 0.54912892 -0.021978022 0.277351916 -0.021978022 NA 'CSWE' 0.277003484 0.555749129 -0.054945055 0.278745645 -0.054945055 1 'CSWE' 0.282229965 0.562369338 -0.087912088 0.280139373 -0.087912088 0 'CSWE' 0.287456446 0.568989547 -0.120879121 0.281533101 -0.120879121 0 'CSWE' 0.292682927 0.575609756 -0.153846154 0.282926829 -0.153846154 1 'CSWE' 0.297909408 0.582229965 -0.186813187 0.284320557 -0.186813187 0 'CSWE' 0.303135889 0.588850174 -0.21978022 0.285714286 -0.21978022 0 'CSWE' 0.308362369 0.595470383 -0.252747253 0.287108014 -0.252747253 1 'CSWE' 0.31358885 0.602090592 -0.285714286 0.288501742 -0.285714286 1 'CSWE' 0.318815331 0.608710801 -0.318681319 0.28989547 -0.318681319 0 'CSWE' 0.324041812 0.61533101 NA 0.291289199 NA NA 'CSWE' 0.329268293 0.62195122 1 0.292682927 1 1 'CSWE' 0.334494774 0.628571429 NA 0.294076655 NA NA 'CSWE' 0.339721254 0.635191638 0.064935065 0.295470383 -0.194805195 0 'CSWE' 0.344947735 0.641811847 0.054771316 0.296864111 -0.207792208 1 'CSWE' 0.350174216 0.648432056 0.044607566 0.29825784 -0.220779221 NA 'CSWE' 0.355400697 0.655052265 0.034443817 0.299651568 -0.233766234 1 'CSWE' 0.360627178 0.661672474 0.024280068 0.301045296 -0.246753247 0 'CSWE' 0.365853659 0.668292683 0.014116318 0.302439024 -0.25974026 NA 'CSWE' 0.371080139 0.674912892 0.003952569 0.303832753 -0.272727273 0 'CSWE' 0.37630662 0.681533101 -0.00621118 0.305226481 -0.285714286 1 'CSWE' 0.381533101 0.68815331 -0.016374929 0.306620209 -0.298701299 0 'CSWE' 0.386759582 0.694773519 -0.026538679 0.308013937 -0.311688312 1 'CSWE' 0.391986063 0.701393728 -0.036702428 0.309407666 -0.324675325 1 'CSWE' 0.397212544 0.708013937 -0.046866177 0.310801394 -0.337662338 1 'CSWE' 0.402439024 0.714634146 -0.057029927 0.312195122 -0.350649351 0 'CSWE' 0.407665505 0.721254355 -0.067193676 0.31358885 -0.363636364 1 'CSWE' 0.412891986 0.727874564 -0.077357425 0.314982578 -0.376623377 2 'CSWE' 0.418118467 0.734494774 -0.087521174 0.316376307 -0.38961039 1 'CSWE' 0.423344948 0.741114983 -0.097684924 0.317770035 -0.402597403 NA 'CSWE' 0.428571429 0.747735192 -0.107848673 0.319163763 -0.415584416 0 'CSWE' 0.433797909 0.754355401 -0.118012422 0.320557491 -0.428571429 NA 'CSWE' 0.43902439 0.76097561 -0.128176172 0.32195122 -0.441558442 0 'CSWE' 0.444250871 0.767595819 -0.138339921 0.323344948 -0.454545455 0 'CSWE' 0.449477352 0.774216028 -0.14850367 0.324738676 -0.467532468 0 'CSWE' 0.454703833 0.780836237 NA 0.326132404 NA 1 'CSWE' 0.459930314 0.787456446 -1 0.327526132 -1 1 'C' 0.465156794 0.794076655 -2 0.328919861 -2 0 'C' 0.470383275 0.800696864 -0.351648352 0.330313589 -0.351648352 1 'C' 0.475609756 0.807317073 -0.384615385 0.331707317 -0.384615385 -1 'C' 0.480836237 0.813937282 -0.417582418 0.333101045 -0.417582418 1 'C' 0.486062718 0.820557491 -0.450549451 0.334494774 -0.450549451 NA 'C' 0.491289199 0.8271777 -0.483516484 0.335888502 -0.483516484 0 'C' 0.496515679 0.833797909 -0.516483516 0.33728223 -0.516483516 0 'C' 0.50174216 0.840418118 -0.549450549 0.338675958 -0.549450549 1 'C' 0.506968641 0.847038328 -0.582417582 0.340069686 -0.582417582 0 'C' 0.512195122 0.853658537 -0.615384615 0.341463415 -0.615384615 NA 'C' 0.517421603 0.860278746 -0.648351648 0.342857143 -0.648351648 0 'C' 0.522648084 0.866898955 -0.681318681 0.344250871 -0.681318681 1 'C' 0.527874564 0.873519164 -0.714285714 0.345644599 -0.714285714 1 'C' 0.533101045 0.880139373 -0.747252747 0.347038328 -0.747252747 0 'C' 0.538327526 0.886759582 NA 0.348432056 NA 0 'C' 0.543554007 0.893379791 1 0.349825784 1 0 'C' 0.548780488 0.9 NA 0.351219512 NA 0 'C' 0.554006969 0.906620209 -0.15866742 0.35261324 -0.480519481 NA 'C' 0.559233449 0.913240418 -0.168831169 0.354006969 -0.493506494 0 'C' 0.56445993 0.919860627 -0.178994918 0.355400697 -0.506493506 1 'C' 0.569686411 0.926480836 -0.189158667 0.356794425 -0.519480519 0 'C' 0.574912892 0.933101045 -0.199322417 0.358188153 -0.532467532 1 'C' 0.580139373 0.939721254 -0.209486166 0.359581882 -0.545454545 0 'C' 0.585365854 0.946341463 -0.219649915 0.36097561 -0.558441558 0 'C' 0.590592334 0.952961672 -0.229813665 0.362369338 -0.571428571 0 'C' 0.595818815 0.959581882 -0.239977414 0.363763066 -0.584415584 0 'C' 0.601045296 0.966202091 -0.250141163 0.365156794 -0.597402597 0 'C' 0.606271777 0.9728223 -0.260304912 0.366550523 -0.61038961 0 'C' 0.611498258 0.979442509 -0.270468662 0.367944251 -0.623376623 0 'C' 0.616724739 0.986062718 -0.280632411 0.369337979 -0.636363636 0 'C' 0.62195122 0.992682927 -0.29079616 0.370731707 -0.649350649 0 'C' 0.6271777 0.999303136 -0.30095991 0.372125436 -0.662337662 1 'C' 0.632404181 1.005923345 -0.311123659 0.373519164 -0.675324675 0 'C' 0.637630662 1.012543554 -0.321287408 0.374912892 -0.688311688 0 'C' 0.642857143 1.019163763 -0.331451158 0.37630662 -0.701298701 0 'C' 0.648083624 1.025783972 -0.341614907 0.377700348 -0.714285714 1 'C' 0.653310105 1.032404181 -0.351778656 0.379094077 -0.727272727 0 'C' 0.658536585 1.03902439 -0.361942405 0.380487805 -0.74025974 NA 'C' 0.663763066 1.045644599 -0.372106155 0.381881533 -0.753246753 0 | |||||||||||||||||||||||||||||||||||||||||||||||||||||||||||||||||||||||||||||||||||||||||||||||||||||||||||||||||||||||||||||||||||||||||||||||||||||||||||||||||||||||||||||||
Tables (Output of Computation) | |||||||||||||||||||||||||||||||||||||||||||||||||||||||||||||||||||||||||||||||||||||||||||||||||||||||||||||||||||||||||||||||||||||||||||||||||||||||||||||||||||||||||||||||
| |||||||||||||||||||||||||||||||||||||||||||||||||||||||||||||||||||||||||||||||||||||||||||||||||||||||||||||||||||||||||||||||||||||||||||||||||||||||||||||||||||||||||||||||
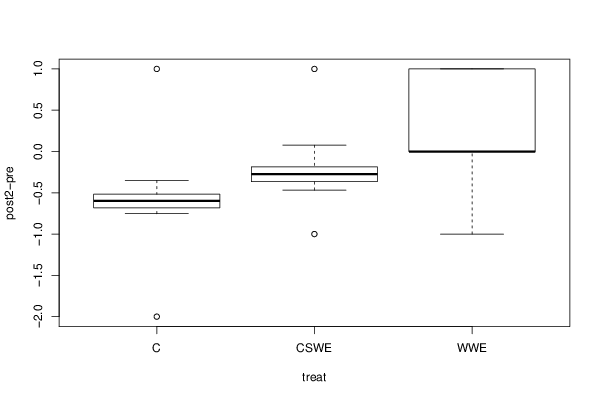
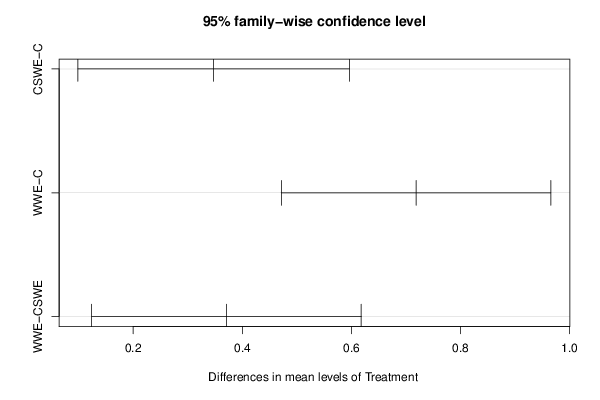
Figures (Output of Computation) | |||||||||||||||||||||||||||||||||||||||||||||||||||||||||||||||||||||||||||||||||||||||||||||||||||||||||||||||||||||||||||||||||||||||||||||||||||||||||||||||||||||||||||||||
Input Parameters & R Code | |||||||||||||||||||||||||||||||||||||||||||||||||||||||||||||||||||||||||||||||||||||||||||||||||||||||||||||||||||||||||||||||||||||||||||||||||||||||||||||||||||||||||||||||
| Parameters (Session): | |||||||||||||||||||||||||||||||||||||||||||||||||||||||||||||||||||||||||||||||||||||||||||||||||||||||||||||||||||||||||||||||||||||||||||||||||||||||||||||||||||||||||||||||
| par1 = 6 ; par2 = 1 ; par3 = TRUE ; | |||||||||||||||||||||||||||||||||||||||||||||||||||||||||||||||||||||||||||||||||||||||||||||||||||||||||||||||||||||||||||||||||||||||||||||||||||||||||||||||||||||||||||||||
| Parameters (R input): | |||||||||||||||||||||||||||||||||||||||||||||||||||||||||||||||||||||||||||||||||||||||||||||||||||||||||||||||||||||||||||||||||||||||||||||||||||||||||||||||||||||||||||||||
| par1 = 6 ; par2 = 1 ; par3 = TRUE ; | |||||||||||||||||||||||||||||||||||||||||||||||||||||||||||||||||||||||||||||||||||||||||||||||||||||||||||||||||||||||||||||||||||||||||||||||||||||||||||||||||||||||||||||||
| R code (references can be found in the software module): | |||||||||||||||||||||||||||||||||||||||||||||||||||||||||||||||||||||||||||||||||||||||||||||||||||||||||||||||||||||||||||||||||||||||||||||||||||||||||||||||||||||||||||||||
cat1 <- as.numeric(par1) # | |||||||||||||||||||||||||||||||||||||||||||||||||||||||||||||||||||||||||||||||||||||||||||||||||||||||||||||||||||||||||||||||||||||||||||||||||||||||||||||||||||||||||||||||