Free Statistics
of Irreproducible Research!
Description of Statistical Computation | |||||||||||||||||||||||||||||||||||||||||||||||||||||||||||||||||||||||||||||||||||||||||||||||||||||||||||||||||||||||||||||||||||||||||||||||||||||||||||||||||||||||||||||||||||||
|---|---|---|---|---|---|---|---|---|---|---|---|---|---|---|---|---|---|---|---|---|---|---|---|---|---|---|---|---|---|---|---|---|---|---|---|---|---|---|---|---|---|---|---|---|---|---|---|---|---|---|---|---|---|---|---|---|---|---|---|---|---|---|---|---|---|---|---|---|---|---|---|---|---|---|---|---|---|---|---|---|---|---|---|---|---|---|---|---|---|---|---|---|---|---|---|---|---|---|---|---|---|---|---|---|---|---|---|---|---|---|---|---|---|---|---|---|---|---|---|---|---|---|---|---|---|---|---|---|---|---|---|---|---|---|---|---|---|---|---|---|---|---|---|---|---|---|---|---|---|---|---|---|---|---|---|---|---|---|---|---|---|---|---|---|---|---|---|---|---|---|---|---|---|---|---|---|---|---|---|---|---|
| Author's title | |||||||||||||||||||||||||||||||||||||||||||||||||||||||||||||||||||||||||||||||||||||||||||||||||||||||||||||||||||||||||||||||||||||||||||||||||||||||||||||||||||||||||||||||||||||
| Author | *Unverified author* | ||||||||||||||||||||||||||||||||||||||||||||||||||||||||||||||||||||||||||||||||||||||||||||||||||||||||||||||||||||||||||||||||||||||||||||||||||||||||||||||||||||||||||||||||||||
| R Software Module | rwasp_samplenorm.wasp | ||||||||||||||||||||||||||||||||||||||||||||||||||||||||||||||||||||||||||||||||||||||||||||||||||||||||||||||||||||||||||||||||||||||||||||||||||||||||||||||||||||||||||||||||||||
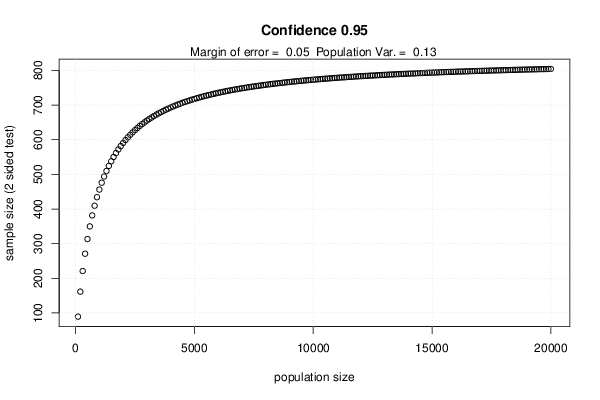
| Title produced by software | Minimum Sample Size - Testing Mean | ||||||||||||||||||||||||||||||||||||||||||||||||||||||||||||||||||||||||||||||||||||||||||||||||||||||||||||||||||||||||||||||||||||||||||||||||||||||||||||||||||||||||||||||||||||
| Date of computation | Tue, 23 Oct 2012 13:08:38 -0400 | ||||||||||||||||||||||||||||||||||||||||||||||||||||||||||||||||||||||||||||||||||||||||||||||||||||||||||||||||||||||||||||||||||||||||||||||||||||||||||||||||||||||||||||||||||||
| Cite this page as follows | Statistical Computations at FreeStatistics.org, Office for Research Development and Education, URL https://freestatistics.org/blog/index.php?v=date/2012/Oct/23/t1351012134gxdifuz6najxwt0.htm/, Retrieved Thu, 02 May 2024 05:18:32 +0000 | ||||||||||||||||||||||||||||||||||||||||||||||||||||||||||||||||||||||||||||||||||||||||||||||||||||||||||||||||||||||||||||||||||||||||||||||||||||||||||||||||||||||||||||||||||||
| Statistical Computations at FreeStatistics.org, Office for Research Development and Education, URL https://freestatistics.org/blog/index.php?pk=183126, Retrieved Thu, 02 May 2024 05:18:32 +0000 | |||||||||||||||||||||||||||||||||||||||||||||||||||||||||||||||||||||||||||||||||||||||||||||||||||||||||||||||||||||||||||||||||||||||||||||||||||||||||||||||||||||||||||||||||||||
| QR Codes: | |||||||||||||||||||||||||||||||||||||||||||||||||||||||||||||||||||||||||||||||||||||||||||||||||||||||||||||||||||||||||||||||||||||||||||||||||||||||||||||||||||||||||||||||||||||
|
| |||||||||||||||||||||||||||||||||||||||||||||||||||||||||||||||||||||||||||||||||||||||||||||||||||||||||||||||||||||||||||||||||||||||||||||||||||||||||||||||||||||||||||||||||||||
| Original text written by user: | |||||||||||||||||||||||||||||||||||||||||||||||||||||||||||||||||||||||||||||||||||||||||||||||||||||||||||||||||||||||||||||||||||||||||||||||||||||||||||||||||||||||||||||||||||||
| IsPrivate? | No (this computation is public) | ||||||||||||||||||||||||||||||||||||||||||||||||||||||||||||||||||||||||||||||||||||||||||||||||||||||||||||||||||||||||||||||||||||||||||||||||||||||||||||||||||||||||||||||||||||
| User-defined keywords | |||||||||||||||||||||||||||||||||||||||||||||||||||||||||||||||||||||||||||||||||||||||||||||||||||||||||||||||||||||||||||||||||||||||||||||||||||||||||||||||||||||||||||||||||||||
| Estimated Impact | 132 | ||||||||||||||||||||||||||||||||||||||||||||||||||||||||||||||||||||||||||||||||||||||||||||||||||||||||||||||||||||||||||||||||||||||||||||||||||||||||||||||||||||||||||||||||||||
Tree of Dependent Computations | |||||||||||||||||||||||||||||||||||||||||||||||||||||||||||||||||||||||||||||||||||||||||||||||||||||||||||||||||||||||||||||||||||||||||||||||||||||||||||||||||||||||||||||||||||||
| Family? (F = Feedback message, R = changed R code, M = changed R Module, P = changed Parameters, D = changed Data) | |||||||||||||||||||||||||||||||||||||||||||||||||||||||||||||||||||||||||||||||||||||||||||||||||||||||||||||||||||||||||||||||||||||||||||||||||||||||||||||||||||||||||||||||||||||
| - [Factor Analysis] [Sleep in Mammals ...] [2010-03-21 11:39:53] [b98453cac15ba1066b407e146608df68] - RMPD [Testing Mean with unknown Variance - Critical Value] [Hypothesis Test a...] [2010-10-19 11:45:26] [b98453cac15ba1066b407e146608df68] - PD [Testing Mean with unknown Variance - Critical Value] [Vraag 4: Male ] [2010-10-22 09:14:17] [74deae64b71f9d77c839af86f7c687b5] - RMPD [Testing Mean with known Variance - Sample Size] [Vraag 9: Minimum ...] [2010-10-22 12:33:36] [74deae64b71f9d77c839af86f7c687b5] F RMP [Minimum Sample Size - Testing Mean] [WS4 Q11] [2010-10-24 11:23:12] [afe9379cca749d06b3d6872e02cc47ed] - R P [Minimum Sample Size - Testing Mean] [Q11] [2012-10-23 17:08:38] [d41d8cd98f00b204e9800998ecf8427e] [Current] - RMPD [Paired and Unpaired Two Samples Tests about the Mean] [WS5 Q1] [2012-10-29 21:27:39] [77d02b0cf2cecd023ffa9a06f056f18d] - R D [Paired and Unpaired Two Samples Tests about the Mean] [WS5 Q2] [2012-10-29 21:32:29] [77d02b0cf2cecd023ffa9a06f056f18d] - D [Paired and Unpaired Two Samples Tests about the Mean] [WS5 Q3] [2012-10-29 21:36:10] [77d02b0cf2cecd023ffa9a06f056f18d] - RMPD [One-Way-Between-Groups ANOVA- Free Statistics Software (Calculator)] [WS5 Q6] [2012-10-29 21:53:23] [77d02b0cf2cecd023ffa9a06f056f18d] - R P [One-Way-Between-Groups ANOVA- Free Statistics Software (Calculator)] [WS5 Q6 - deel 2] [2012-10-29 22:00:33] [77d02b0cf2cecd023ffa9a06f056f18d] - D [One-Way-Between-Groups ANOVA- Free Statistics Software (Calculator)] [WS5 Q7 deel 1] [2012-10-29 22:07:14] [77d02b0cf2cecd023ffa9a06f056f18d] - [One-Way-Between-Groups ANOVA- Free Statistics Software (Calculator)] [WS5 Q7 deel 2] [2012-10-29 22:10:21] [77d02b0cf2cecd023ffa9a06f056f18d] - P [One-Way-Between-Groups ANOVA- Free Statistics Software (Calculator)] [W5 - Vraag 7b] [2012-10-31 02:13:22] [3ae574fa1d645ef9b19cadb6c0dbd022] - RM D [Paired and Unpaired Two Samples Tests about the Mean] [WS5 Q5 deel 1] [2012-10-29 22:16:21] [77d02b0cf2cecd023ffa9a06f056f18d] - R D [Paired and Unpaired Two Samples Tests about the Mean] [WS5 Q5 deel 2] [2012-10-29 22:18:34] [77d02b0cf2cecd023ffa9a06f056f18d] - D [Paired and Unpaired Two Samples Tests about the Mean] [WS5 Q5 deel 3] [2012-10-29 22:22:19] [77d02b0cf2cecd023ffa9a06f056f18d] - RM D [Two-Way ANOVA] [WS5 Q8] [2012-10-29 22:30:47] [77d02b0cf2cecd023ffa9a06f056f18d] - R P [Two-Way ANOVA] [W5 - Vraag 8] [2012-10-31 00:35:54] [3ae574fa1d645ef9b19cadb6c0dbd022] - R P [One-Way-Between-Groups ANOVA- Free Statistics Software (Calculator)] [W5 - Vraag 6d] [2012-10-31 00:26:50] [3ae574fa1d645ef9b19cadb6c0dbd022] - R P [One-Way-Between-Groups ANOVA- Free Statistics Software (Calculator)] [W5 - Vraag 6e] [2012-10-31 00:27:57] [3ae574fa1d645ef9b19cadb6c0dbd022] - R D [One-Way-Between-Groups ANOVA- Free Statistics Software (Calculator)] [W5 - Vraag 7] [2012-10-31 00:33:26] [3ae574fa1d645ef9b19cadb6c0dbd022] - P [One-Way-Between-Groups ANOVA- Free Statistics Software (Calculator)] [W5 - Vraag 6f] [2012-10-31 02:04:14] [3ae574fa1d645ef9b19cadb6c0dbd022] - P [One-Way-Between-Groups ANOVA- Free Statistics Software (Calculator)] [W5 - Vraag 6b] [2012-10-31 00:23:02] [3ae574fa1d645ef9b19cadb6c0dbd022] - P [One-Way-Between-Groups ANOVA- Free Statistics Software (Calculator)] [W5 - Vraag 6c] [2012-10-31 00:24:13] [3ae574fa1d645ef9b19cadb6c0dbd022] - [Paired and Unpaired Two Samples Tests about the Mean] [W5 - Vraag 1] [2012-10-30 23:48:02] [3ae574fa1d645ef9b19cadb6c0dbd022] - R D [Paired and Unpaired Two Samples Tests about the Mean] [W5 - Vraag 2] [2012-10-30 23:54:26] [3ae574fa1d645ef9b19cadb6c0dbd022] - D [Paired and Unpaired Two Samples Tests about the Mean] [W5 - Vraag 3] [2012-10-30 23:55:59] [3ae574fa1d645ef9b19cadb6c0dbd022] - D [Paired and Unpaired Two Samples Tests about the Mean] [W5 - Vraag 5a] [2012-10-31 00:01:30] [3ae574fa1d645ef9b19cadb6c0dbd022] - D [Paired and Unpaired Two Samples Tests about the Mean] [W5 - Vraag 5b] [2012-10-31 00:03:43] [3ae574fa1d645ef9b19cadb6c0dbd022] - D [Paired and Unpaired Two Samples Tests about the Mean] [W5 - Vraag 5c] [2012-10-31 00:06:31] [3ae574fa1d645ef9b19cadb6c0dbd022] - RM D [One-Way-Between-Groups ANOVA- Free Statistics Software (Calculator)] [W5 - Vraag 6a] [2012-10-31 00:09:29] [3ae574fa1d645ef9b19cadb6c0dbd022] - RM [One-Way-Between-Groups ANOVA- Free Statistics Software (Calculator)] [W5 - Vraag 6a] [2012-10-31 00:10:53] [3ae574fa1d645ef9b19cadb6c0dbd022] | |||||||||||||||||||||||||||||||||||||||||||||||||||||||||||||||||||||||||||||||||||||||||||||||||||||||||||||||||||||||||||||||||||||||||||||||||||||||||||||||||||||||||||||||||||||
| Feedback Forum | |||||||||||||||||||||||||||||||||||||||||||||||||||||||||||||||||||||||||||||||||||||||||||||||||||||||||||||||||||||||||||||||||||||||||||||||||||||||||||||||||||||||||||||||||||||
Post a new message | |||||||||||||||||||||||||||||||||||||||||||||||||||||||||||||||||||||||||||||||||||||||||||||||||||||||||||||||||||||||||||||||||||||||||||||||||||||||||||||||||||||||||||||||||||||
Dataset | |||||||||||||||||||||||||||||||||||||||||||||||||||||||||||||||||||||||||||||||||||||||||||||||||||||||||||||||||||||||||||||||||||||||||||||||||||||||||||||||||||||||||||||||||||||
Tables (Output of Computation) | |||||||||||||||||||||||||||||||||||||||||||||||||||||||||||||||||||||||||||||||||||||||||||||||||||||||||||||||||||||||||||||||||||||||||||||||||||||||||||||||||||||||||||||||||||||
| |||||||||||||||||||||||||||||||||||||||||||||||||||||||||||||||||||||||||||||||||||||||||||||||||||||||||||||||||||||||||||||||||||||||||||||||||||||||||||||||||||||||||||||||||||||
Figures (Output of Computation) | |||||||||||||||||||||||||||||||||||||||||||||||||||||||||||||||||||||||||||||||||||||||||||||||||||||||||||||||||||||||||||||||||||||||||||||||||||||||||||||||||||||||||||||||||||||
Input Parameters & R Code | |||||||||||||||||||||||||||||||||||||||||||||||||||||||||||||||||||||||||||||||||||||||||||||||||||||||||||||||||||||||||||||||||||||||||||||||||||||||||||||||||||||||||||||||||||||
| Parameters (Session): | |||||||||||||||||||||||||||||||||||||||||||||||||||||||||||||||||||||||||||||||||||||||||||||||||||||||||||||||||||||||||||||||||||||||||||||||||||||||||||||||||||||||||||||||||||||
| par1 = 105 ; par2 = 0.05 ; par3 = 0.95 ; par4 = 0.13 ; par5 = 0.98 ; | |||||||||||||||||||||||||||||||||||||||||||||||||||||||||||||||||||||||||||||||||||||||||||||||||||||||||||||||||||||||||||||||||||||||||||||||||||||||||||||||||||||||||||||||||||||
| Parameters (R input): | |||||||||||||||||||||||||||||||||||||||||||||||||||||||||||||||||||||||||||||||||||||||||||||||||||||||||||||||||||||||||||||||||||||||||||||||||||||||||||||||||||||||||||||||||||||
| par1 = 105 ; par2 = 0.05 ; par3 = 0.95 ; par4 = 0.13 ; par5 = 0.98 ; | |||||||||||||||||||||||||||||||||||||||||||||||||||||||||||||||||||||||||||||||||||||||||||||||||||||||||||||||||||||||||||||||||||||||||||||||||||||||||||||||||||||||||||||||||||||
| R code (references can be found in the software module): | |||||||||||||||||||||||||||||||||||||||||||||||||||||||||||||||||||||||||||||||||||||||||||||||||||||||||||||||||||||||||||||||||||||||||||||||||||||||||||||||||||||||||||||||||||||
par1 <- as.numeric(par1) | |||||||||||||||||||||||||||||||||||||||||||||||||||||||||||||||||||||||||||||||||||||||||||||||||||||||||||||||||||||||||||||||||||||||||||||||||||||||||||||||||||||||||||||||||||||