| Tabulation of Results | |||||||||||||
| A x B | |||||||||||||
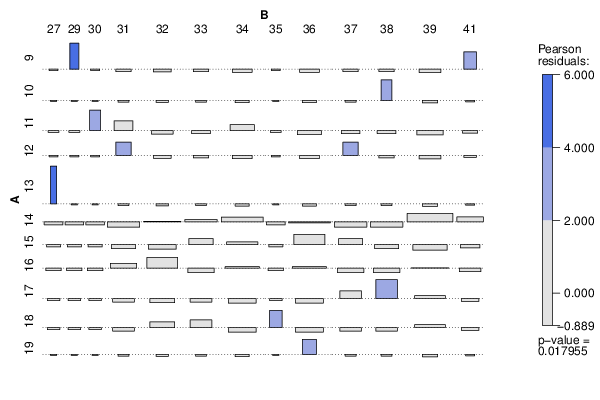
| 27 | 29 | 30 | 31 | 32 | 33 | 34 | 35 | 36 | 37 | 38 | 39 | 41 | 9 | 0 | 1 | 0 | 0 | 0 | 0 | 0 | 0 | 0 | 0 | 0 | 0 | 1 | 10 | 0 | 0 | 0 | 0 | 0 | 0 | 0 | 0 | 0 | 0 | 1 | 0 | 0 | 11 | 0 | 0 | 1 | 1 | 0 | 0 | 1 | 0 | 0 | 0 | 0 | 0 | 0 | 12 | 0 | 0 | 0 | 1 | 0 | 0 | 0 | 0 | 0 | 1 | 0 | 0 | 0 | 13 | 1 | 0 | 0 | 0 | 0 | 0 | 0 | 0 | 0 | 0 | 0 | 0 | 0 | 14 | 0 | 0 | 0 | 0 | 1 | 1 | 2 | 0 | 1 | 0 | 0 | 3 | 1 | 15 | 0 | 0 | 0 | 0 | 0 | 1 | 1 | 0 | 2 | 1 | 0 | 0 | 0 | 16 | 0 | 0 | 0 | 1 | 2 | 0 | 1 | 0 | 1 | 0 | 0 | 1 | 0 | 17 | 0 | 0 | 0 | 0 | 0 | 0 | 0 | 0 | 0 | 1 | 2 | 1 | 0 | 18 | 0 | 0 | 0 | 0 | 1 | 1 | 0 | 1 | 0 | 0 | 0 | 1 | 0 | 19 | 0 | 0 | 0 | 0 | 0 | 0 | 0 | 0 | 1 | 0 | 0 | 0 | 0 |
| Tabulation of Expected Results | |||||||||||||
| A x B | |||||||||||||
| 27 | 29 | 30 | 31 | 32 | 33 | 34 | 35 | 36 | 37 | 38 | 39 | 41 | 9 | 0.05 | 0.05 | 0.05 | 0.16 | 0.21 | 0.16 | 0.26 | 0.05 | 0.26 | 0.16 | 0.16 | 0.32 | 0.11 | 10 | 0.03 | 0.03 | 0.03 | 0.08 | 0.11 | 0.08 | 0.13 | 0.03 | 0.13 | 0.08 | 0.08 | 0.16 | 0.05 | 11 | 0.08 | 0.08 | 0.08 | 0.24 | 0.32 | 0.24 | 0.39 | 0.08 | 0.39 | 0.24 | 0.24 | 0.47 | 0.16 | 12 | 0.05 | 0.05 | 0.05 | 0.16 | 0.21 | 0.16 | 0.26 | 0.05 | 0.26 | 0.16 | 0.16 | 0.32 | 0.11 | 13 | 0.03 | 0.03 | 0.03 | 0.08 | 0.11 | 0.08 | 0.13 | 0.03 | 0.13 | 0.08 | 0.08 | 0.16 | 0.05 | 14 | 0.24 | 0.24 | 0.24 | 0.71 | 0.95 | 0.71 | 1.18 | 0.24 | 1.18 | 0.71 | 0.71 | 1.42 | 0.47 | 15 | 0.13 | 0.13 | 0.13 | 0.39 | 0.53 | 0.39 | 0.66 | 0.13 | 0.66 | 0.39 | 0.39 | 0.79 | 0.26 | 16 | 0.16 | 0.16 | 0.16 | 0.47 | 0.63 | 0.47 | 0.79 | 0.16 | 0.79 | 0.47 | 0.47 | 0.95 | 0.32 | 17 | 0.11 | 0.11 | 0.11 | 0.32 | 0.42 | 0.32 | 0.53 | 0.11 | 0.53 | 0.32 | 0.32 | 0.63 | 0.21 | 18 | 0.11 | 0.11 | 0.11 | 0.32 | 0.42 | 0.32 | 0.53 | 0.11 | 0.53 | 0.32 | 0.32 | 0.63 | 0.21 | 19 | 0.03 | 0.03 | 0.03 | 0.08 | 0.11 | 0.08 | 0.13 | 0.03 | 0.13 | 0.08 | 0.08 | 0.16 | 0.05 |
| Statistical Results | |
| Pearson's Chi-squared test | |
| Pearson Chi Square Statistic | 154.73 |
| Degrees of Freedom | 120 |
| P value | 0.02 |