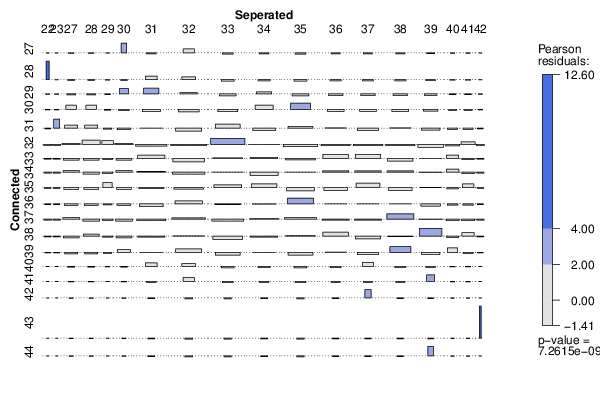
| Tabulation of Results | ||||||||||||||||||
| Connected x Seperated | ||||||||||||||||||
| 22 | 23 | 27 | 28 | 29 | 30 | 31 | 32 | 33 | 34 | 35 | 36 | 37 | 38 | 39 | 40 | 41 | 42 | 27 | 0 | 0 | 0 | 0 | 0 | 1 | 0 | 1 | 0 | 0 | 0 | 0 | 0 | 0 | 0 | 0 | 0 | 0 | 28 | 1 | 0 | 0 | 0 | 0 | 0 | 1 | 1 | 0 | 0 | 0 | 0 | 0 | 0 | 0 | 0 | 0 | 0 | 29 | 0 | 0 | 0 | 0 | 0 | 1 | 2 | 1 | 0 | 1 | 0 | 0 | 0 | 0 | 0 | 0 | 0 | 0 | 30 | 0 | 0 | 1 | 1 | 0 | 0 | 0 | 0 | 0 | 2 | 3 | 0 | 0 | 0 | 0 | 0 | 0 | 0 | 31 | 0 | 1 | 1 | 1 | 0 | 0 | 1 | 0 | 3 | 0 | 2 | 1 | 0 | 1 | 0 | 0 | 0 | 0 | 32 | 0 | 0 | 1 | 2 | 1 | 1 | 1 | 2 | 6 | 2 | 1 | 1 | 1 | 1 | 0 | 0 | 1 | 0 | 33 | 0 | 0 | 0 | 0 | 0 | 0 | 3 | 0 | 2 | 2 | 1 | 3 | 3 | 0 | 1 | 1 | 0 | 0 | 34 | 0 | 0 | 1 | 0 | 0 | 1 | 2 | 1 | 2 | 0 | 2 | 2 | 2 | 2 | 1 | 1 | 0 | 0 | 35 | 0 | 0 | 0 | 0 | 1 | 0 | 1 | 1 | 3 | 3 | 0 | 0 | 3 | 0 | 1 | 0 | 1 | 0 | 36 | 0 | 0 | 0 | 0 | 0 | 0 | 0 | 3 | 1 | 1 | 4 | 1 | 1 | 1 | 0 | 0 | 0 | 0 | 37 | 0 | 0 | 1 | 0 | 0 | 0 | 1 | 3 | 1 | 2 | 3 | 1 | 1 | 4 | 1 | 0 | 0 | 0 | 38 | 0 | 0 | 0 | 1 | 0 | 0 | 1 | 2 | 0 | 1 | 2 | 3 | 0 | 1 | 4 | 0 | 1 | 0 | 39 | 0 | 0 | 0 | 0 | 0 | 1 | 1 | 3 | 0 | 1 | 0 | 1 | 0 | 3 | 0 | 1 | 0 | 0 | 40 | 0 | 0 | 0 | 0 | 0 | 0 | 1 | 1 | 0 | 0 | 0 | 0 | 1 | 0 | 0 | 0 | 0 | 0 | 41 | 0 | 0 | 0 | 0 | 0 | 0 | 0 | 1 | 0 | 0 | 0 | 0 | 0 | 0 | 1 | 0 | 0 | 0 | 42 | 0 | 0 | 0 | 0 | 0 | 0 | 0 | 0 | 0 | 0 | 0 | 0 | 1 | 0 | 0 | 0 | 0 | 0 | 43 | 0 | 0 | 0 | 0 | 0 | 0 | 0 | 0 | 0 | 0 | 0 | 0 | 0 | 0 | 0 | 0 | 0 | 1 | 44 | 0 | 0 | 0 | 0 | 0 | 0 | 0 | 0 | 0 | 0 | 0 | 0 | 0 | 0 | 1 | 0 | 0 | 0 |
| Tabulation of Expected Results | ||||||||||||||||||
| Connected x Seperated | ||||||||||||||||||
| 22 | 23 | 27 | 28 | 29 | 30 | 31 | 32 | 33 | 34 | 35 | 36 | 37 | 38 | 39 | 40 | 41 | 42 | 27 | 0.01 | 0.01 | 0.06 | 0.06 | 0.02 | 0.06 | 0.19 | 0.25 | 0.22 | 0.19 | 0.22 | 0.16 | 0.16 | 0.16 | 0.12 | 0.04 | 0.04 | 0.01 | 28 | 0.02 | 0.02 | 0.09 | 0.09 | 0.04 | 0.09 | 0.28 | 0.37 | 0.34 | 0.28 | 0.34 | 0.24 | 0.24 | 0.24 | 0.19 | 0.06 | 0.06 | 0.02 | 29 | 0.03 | 0.03 | 0.16 | 0.16 | 0.06 | 0.16 | 0.47 | 0.62 | 0.56 | 0.47 | 0.56 | 0.4 | 0.4 | 0.4 | 0.31 | 0.09 | 0.09 | 0.03 | 30 | 0.04 | 0.04 | 0.22 | 0.22 | 0.09 | 0.22 | 0.65 | 0.87 | 0.78 | 0.65 | 0.78 | 0.57 | 0.57 | 0.57 | 0.43 | 0.13 | 0.13 | 0.04 | 31 | 0.07 | 0.07 | 0.34 | 0.34 | 0.14 | 0.34 | 1.02 | 1.37 | 1.23 | 1.02 | 1.23 | 0.89 | 0.89 | 0.89 | 0.68 | 0.2 | 0.2 | 0.07 | 32 | 0.13 | 0.13 | 0.65 | 0.65 | 0.26 | 0.65 | 1.96 | 2.61 | 2.35 | 1.96 | 2.35 | 1.7 | 1.7 | 1.7 | 1.3 | 0.39 | 0.39 | 0.13 | 33 | 0.1 | 0.1 | 0.5 | 0.5 | 0.2 | 0.5 | 1.49 | 1.99 | 1.79 | 1.49 | 1.79 | 1.29 | 1.29 | 1.29 | 0.99 | 0.3 | 0.3 | 0.1 | 34 | 0.11 | 0.11 | 0.53 | 0.53 | 0.21 | 0.53 | 1.58 | 2.11 | 1.9 | 1.58 | 1.9 | 1.37 | 1.37 | 1.37 | 1.06 | 0.32 | 0.32 | 0.11 | 35 | 0.09 | 0.09 | 0.43 | 0.43 | 0.17 | 0.43 | 1.3 | 1.74 | 1.57 | 1.3 | 1.57 | 1.13 | 1.13 | 1.13 | 0.87 | 0.26 | 0.26 | 0.09 | 36 | 0.07 | 0.07 | 0.37 | 0.37 | 0.15 | 0.37 | 1.12 | 1.49 | 1.34 | 1.12 | 1.34 | 0.97 | 0.97 | 0.97 | 0.75 | 0.22 | 0.22 | 0.07 | 37 | 0.11 | 0.11 | 0.56 | 0.56 | 0.22 | 0.56 | 1.68 | 2.24 | 2.01 | 1.68 | 2.01 | 1.45 | 1.45 | 1.45 | 1.12 | 0.34 | 0.34 | 0.11 | 38 | 0.1 | 0.1 | 0.5 | 0.5 | 0.2 | 0.5 | 1.49 | 1.99 | 1.79 | 1.49 | 1.79 | 1.29 | 1.29 | 1.29 | 0.99 | 0.3 | 0.3 | 0.1 | 39 | 0.07 | 0.07 | 0.34 | 0.34 | 0.14 | 0.34 | 1.02 | 1.37 | 1.23 | 1.02 | 1.23 | 0.89 | 0.89 | 0.89 | 0.68 | 0.2 | 0.2 | 0.07 | 40 | 0.02 | 0.02 | 0.09 | 0.09 | 0.04 | 0.09 | 0.28 | 0.37 | 0.34 | 0.28 | 0.34 | 0.24 | 0.24 | 0.24 | 0.19 | 0.06 | 0.06 | 0.02 | 41 | 0.01 | 0.01 | 0.06 | 0.06 | 0.02 | 0.06 | 0.19 | 0.25 | 0.22 | 0.19 | 0.22 | 0.16 | 0.16 | 0.16 | 0.12 | 0.04 | 0.04 | 0.01 | 42 | 0.01 | 0.01 | 0.03 | 0.03 | 0.01 | 0.03 | 0.09 | 0.12 | 0.11 | 0.09 | 0.11 | 0.08 | 0.08 | 0.08 | 0.06 | 0.02 | 0.02 | 0.01 | 43 | 0.01 | 0.01 | 0.03 | 0.03 | 0.01 | 0.03 | 0.09 | 0.12 | 0.11 | 0.09 | 0.11 | 0.08 | 0.08 | 0.08 | 0.06 | 0.02 | 0.02 | 0.01 | 44 | 0.01 | 0.01 | 0.03 | 0.03 | 0.01 | 0.03 | 0.09 | 0.12 | 0.11 | 0.09 | 0.11 | 0.08 | 0.08 | 0.08 | 0.06 | 0.02 | 0.02 | 0.01 |
| Statistical Results | |
| Pearson's Chi-squared test with simulated p-value (based on 2000 replicates) | |
| Exact Pearson Chi Square Statistic | 446.59 |
| P value | 0.01 |