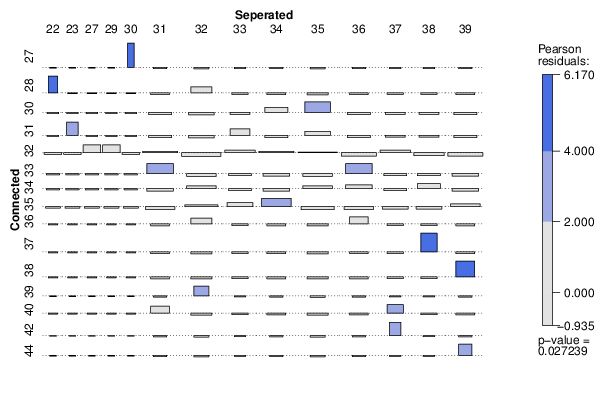
| Tabulation of Results | ||||||||||||||
| Connected x Seperated | ||||||||||||||
| 22 | 23 | 27 | 29 | 30 | 31 | 32 | 33 | 34 | 35 | 36 | 37 | 38 | 39 | 27 | 0 | 0 | 0 | 0 | 1 | 0 | 0 | 0 | 0 | 0 | 0 | 0 | 0 | 0 | 28 | 1 | 0 | 0 | 0 | 0 | 0 | 1 | 0 | 0 | 0 | 0 | 0 | 0 | 0 | 30 | 0 | 0 | 0 | 0 | 0 | 0 | 0 | 0 | 1 | 2 | 0 | 0 | 0 | 0 | 31 | 0 | 1 | 0 | 0 | 0 | 0 | 0 | 1 | 0 | 1 | 0 | 0 | 0 | 0 | 32 | 0 | 0 | 1 | 1 | 0 | 1 | 0 | 1 | 1 | 1 | 0 | 1 | 0 | 0 | 33 | 0 | 0 | 0 | 0 | 0 | 2 | 0 | 0 | 0 | 0 | 2 | 0 | 0 | 0 | 34 | 0 | 0 | 0 | 0 | 0 | 0 | 1 | 0 | 0 | 1 | 1 | 0 | 1 | 0 | 35 | 0 | 0 | 0 | 0 | 0 | 0 | 1 | 1 | 2 | 0 | 0 | 0 | 0 | 1 | 36 | 0 | 0 | 0 | 0 | 0 | 0 | 1 | 0 | 0 | 0 | 1 | 0 | 0 | 0 | 37 | 0 | 0 | 0 | 0 | 0 | 0 | 0 | 0 | 0 | 0 | 0 | 0 | 2 | 0 | 38 | 0 | 0 | 0 | 0 | 0 | 0 | 0 | 0 | 0 | 0 | 0 | 0 | 0 | 2 | 39 | 0 | 0 | 0 | 0 | 0 | 0 | 1 | 0 | 0 | 0 | 0 | 0 | 0 | 0 | 40 | 0 | 0 | 0 | 0 | 0 | 1 | 0 | 0 | 0 | 0 | 0 | 1 | 0 | 0 | 42 | 0 | 0 | 0 | 0 | 0 | 0 | 0 | 0 | 0 | 0 | 0 | 1 | 0 | 0 | 44 | 0 | 0 | 0 | 0 | 0 | 0 | 0 | 0 | 0 | 0 | 0 | 0 | 0 | 1 |
| Tabulation of Expected Results | ||||||||||||||
| Connected x Seperated | ||||||||||||||
| 22 | 23 | 27 | 29 | 30 | 31 | 32 | 33 | 34 | 35 | 36 | 37 | 38 | 39 | 27 | 0.02 | 0.02 | 0.02 | 0.02 | 0.02 | 0.1 | 0.12 | 0.08 | 0.1 | 0.12 | 0.1 | 0.08 | 0.08 | 0.1 | 28 | 0.05 | 0.05 | 0.05 | 0.05 | 0.05 | 0.2 | 0.25 | 0.15 | 0.2 | 0.25 | 0.2 | 0.15 | 0.15 | 0.2 | 30 | 0.08 | 0.08 | 0.08 | 0.08 | 0.08 | 0.3 | 0.38 | 0.22 | 0.3 | 0.38 | 0.3 | 0.22 | 0.22 | 0.3 | 31 | 0.08 | 0.08 | 0.08 | 0.08 | 0.08 | 0.3 | 0.38 | 0.22 | 0.3 | 0.38 | 0.3 | 0.22 | 0.22 | 0.3 | 32 | 0.18 | 0.18 | 0.18 | 0.18 | 0.18 | 0.7 | 0.88 | 0.52 | 0.7 | 0.88 | 0.7 | 0.52 | 0.52 | 0.7 | 33 | 0.1 | 0.1 | 0.1 | 0.1 | 0.1 | 0.4 | 0.5 | 0.3 | 0.4 | 0.5 | 0.4 | 0.3 | 0.3 | 0.4 | 34 | 0.1 | 0.1 | 0.1 | 0.1 | 0.1 | 0.4 | 0.5 | 0.3 | 0.4 | 0.5 | 0.4 | 0.3 | 0.3 | 0.4 | 35 | 0.12 | 0.12 | 0.12 | 0.12 | 0.12 | 0.5 | 0.62 | 0.38 | 0.5 | 0.62 | 0.5 | 0.38 | 0.38 | 0.5 | 36 | 0.05 | 0.05 | 0.05 | 0.05 | 0.05 | 0.2 | 0.25 | 0.15 | 0.2 | 0.25 | 0.2 | 0.15 | 0.15 | 0.2 | 37 | 0.05 | 0.05 | 0.05 | 0.05 | 0.05 | 0.2 | 0.25 | 0.15 | 0.2 | 0.25 | 0.2 | 0.15 | 0.15 | 0.2 | 38 | 0.05 | 0.05 | 0.05 | 0.05 | 0.05 | 0.2 | 0.25 | 0.15 | 0.2 | 0.25 | 0.2 | 0.15 | 0.15 | 0.2 | 39 | 0.02 | 0.02 | 0.02 | 0.02 | 0.02 | 0.1 | 0.12 | 0.08 | 0.1 | 0.12 | 0.1 | 0.08 | 0.08 | 0.1 | 40 | 0.05 | 0.05 | 0.05 | 0.05 | 0.05 | 0.2 | 0.25 | 0.15 | 0.2 | 0.25 | 0.2 | 0.15 | 0.15 | 0.2 | 42 | 0.02 | 0.02 | 0.02 | 0.02 | 0.02 | 0.1 | 0.12 | 0.08 | 0.1 | 0.12 | 0.1 | 0.08 | 0.08 | 0.1 | 44 | 0.02 | 0.02 | 0.02 | 0.02 | 0.02 | 0.1 | 0.12 | 0.08 | 0.1 | 0.12 | 0.1 | 0.08 | 0.08 | 0.1 |
| Statistical Results | |
| Pearson's Chi-squared test with simulated p-value (based on 2000 replicates) | |
| Exact Pearson Chi Square Statistic | 220.45 |
| P value | 0.04 |