| Tabulation of Results | ||||
| Connected x Separate | ||||
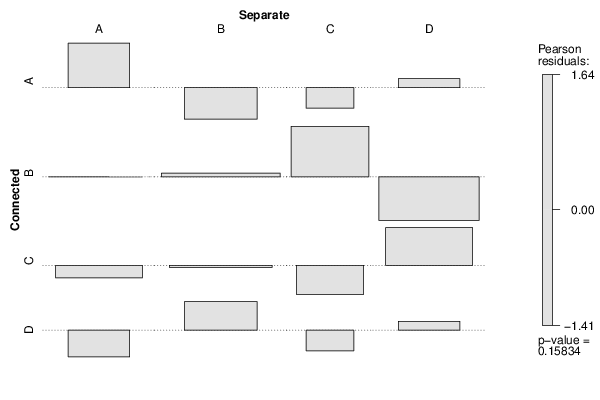
| A | B | C | D | A | 2 | 0 | 0 | 1 | B | 2 | 3 | 3 | 0 | C | 1 | 2 | 0 | 3 | D | 0 | 2 | 0 | 1 |
| Tabulation of Expected Results | ||||
| Connected x Separate | ||||
| A | B | C | D | A | 0.75 | 1.05 | 0.45 | 0.75 | B | 2 | 2.8 | 1.2 | 2 | C | 1.5 | 2.1 | 0.9 | 1.5 | D | 0.75 | 1.05 | 0.45 | 0.75 |
| Statistical Results | |
| Pearson's Chi-squared test with simulated p-value (based on 2000 replicates) | |
| Exact Pearson Chi Square Statistic | 13.1 |
| P value | 0.16 |