| Tabulation of Results | ||
| Score x Treatment | ||
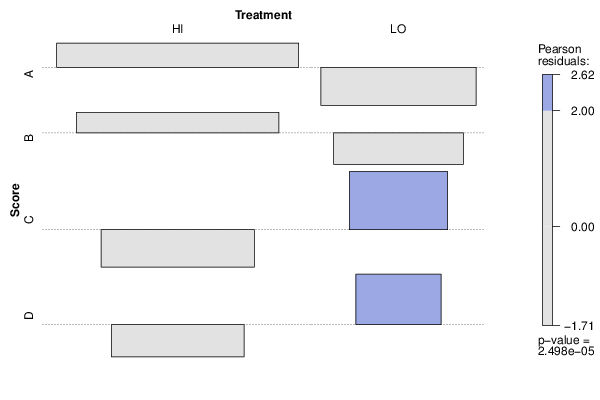
| HI | LO | A | 10 | 0 | B | 7 | 0 | C | 0 | 4 | D | 0 | 3 |
| Tabulation of Expected Results | ||
| Score x Treatment | ||
| HI | LO | A | 7.08 | 2.92 | B | 4.96 | 2.04 | C | 2.83 | 1.17 | D | 2.12 | 0.88 |
| Statistical Results | |
| Pearson's Chi-squared test with simulated p-value (based on 2000 replicates) | |
| Exact Pearson Chi Square Statistic | 24 |
| P value | 0 |