| Tabulation of Results | ||
| Score x Treatment | ||
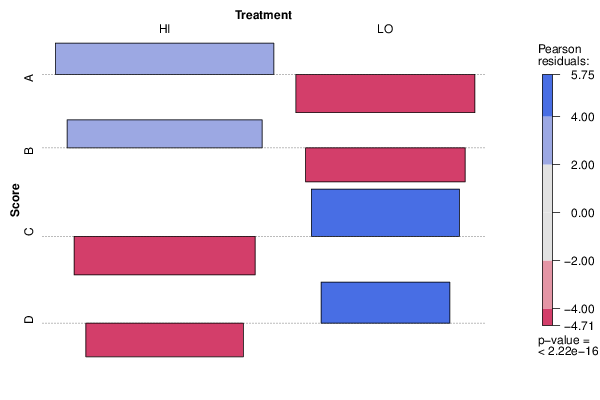
| HI | LO | A | 54 | 0 | B | 43 | 0 | C | 0 | 37 | D | 0 | 28 |
| Tabulation of Expected Results | ||
| Score x Treatment | ||
| HI | LO | A | 32.33 | 21.67 | B | 25.75 | 17.25 | C | 22.15 | 14.85 | D | 16.77 | 11.23 |
| Statistical Results | |
| Pearson's Chi-squared test | |
| Pearson Chi Square Statistic | 162 |
| Degrees of Freedom | 3 |
| P value | 0 |