Free Statistics

of Irreproducible Research!

Author's title

Author*Unverified author*
R Software Modulerwasp_centraltendency.wasp
Title produced by softwareCentral Tendency
Date of computationFri, 19 Oct 2012 08:54:20 -0400
Cite this page as followsStatistical Computations at FreeStatistics.org, Office for Research Development and Education, URL https://freestatistics.org/blog/index.php?v=date/2012/Oct/19/t1350651284c5112mlmw1mg436.htm/, Retrieved Mon, 29 Apr 2024 13:24:52 +0000
Statistical Computations at FreeStatistics.org, Office for Research Development and Education, URL https://freestatistics.org/blog/index.php?pk=180115, Retrieved Mon, 29 Apr 2024 13:24:52 +0000
QR Codes:

Original text written by user:
IsPrivate?No (this computation is public)
User-defined keywords
Estimated Impact51
Family? (F = Feedback message, R = changed R code, M = changed R Module, P = changed Parameters, D = changed Data)
-       [Central Tendency] [] [2012-10-19 12:54:20] [b0bdee2d089ff8fe949f8413e207e90b] [Current]
Feedback Forum

Post a new message
Dataseries X:
14544
14931
14886
16005
17064
15168
16050
15839
15137
14954
15648
15305
15579
16348
15928
16171
15937
15713
15594
15683
16438
17032
17696
17745
19394
20148
20108
18584
18441
18391
19178
18079
18483
19644
19195
19650
20830
23595
22937
21814
21928
21777
21383
21467
22052
22680
24320
24977
25204
25739
26434
27525
30695
32436
30160
30236
31293
31077
32226
33865
32810
32242
32700
32819
33947
34148
35261
39506
41591
39148
41216
40225


Summary of computational transaction
Raw Inputview raw input (R code)
Raw Outputview raw output of R engine
Computing time1 seconds
R Server'Gwilym Jenkins' @ jenkins.wessa.net

\begin{tabular}{lllllllll}
\hline
Summary of computational transaction \tabularnewline
Raw Input & view raw input (R code)  \tabularnewline
Raw Output & view raw output of R engine  \tabularnewline
Computing time & 1 seconds \tabularnewline
R Server & 'Gwilym Jenkins' @ jenkins.wessa.net \tabularnewline
\hline
\end{tabular}
%Source: https://freestatistics.org/blog/index.php?pk=180115&T=0

[TABLE]
[ROW][C]Summary of computational transaction[/C][/ROW]
[ROW][C]Raw Input[/C][C]view raw input (R code) [/C][/ROW]
[ROW][C]Raw Output[/C][C]view raw output of R engine [/C][/ROW]
[ROW][C]Computing time[/C][C]1 seconds[/C][/ROW]
[ROW][C]R Server[/C][C]'Gwilym Jenkins' @ jenkins.wessa.net[/C][/ROW]
[/TABLE]
Source: https://freestatistics.org/blog/index.php?pk=180115&T=0

Globally Unique Identifier (entire table): ba.freestatistics.org/blog/index.php?pk=180115&T=0

As an alternative you can also use a QR Code:  

The GUIDs for individual cells are displayed in the table below:

Summary of computational transaction
Raw Inputview raw input (R code)
Raw Outputview raw output of R engine
Computing time1 seconds
R Server'Gwilym Jenkins' @ jenkins.wessa.net


Central Tendency - Ungrouped Data
MeasureValueS.E.Value/S.E.
Arithmetic Mean23235.4583333333921.48076212567925.2153482615672
Geometric Mean22068.7603192786
Harmonic Mean21058.8547545439
Quadratic Mean24498.4596740852
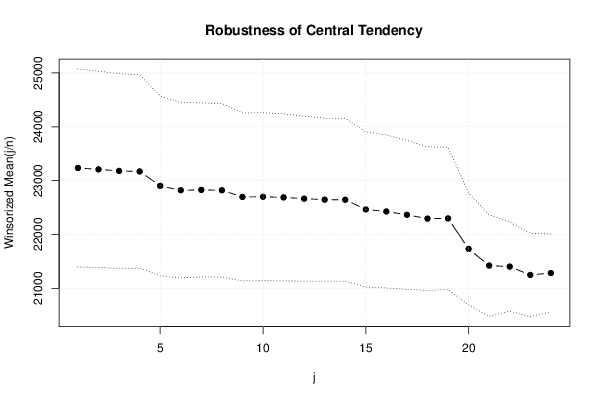
Winsorized Mean ( 1 / 24 )23235919.41352590218825.2715446808337
Winsorized Mean ( 2 / 24 )23208.7222222222911.84402820717225.4525132635394
Winsorized Mean ( 3 / 24 )23179.7222222222903.97341636197125.6420396912873
Winsorized Mean ( 4 / 24 )23170897.65838071415225.8116010475684
Winsorized Mean ( 5 / 24 )22902.2222222222835.21292610541927.4208186995079
Winsorized Mean ( 6 / 24 )22820.8888888889814.97648145150528.0018987152169
Winsorized Mean ( 7 / 24 )22827.9861111111807.75552953728928.2610087784701
Winsorized Mean ( 8 / 24 )22820.5416666667805.78226310282128.3209779013896
Winsorized Mean ( 9 / 24 )22696.5416666667780.35120096380829.085034582678
Winsorized Mean ( 10 / 24 )22700.1527777778779.50546340131929.1212234468854
Winsorized Mean ( 11 / 24 )22687.9305555556775.86255607420129.2422032458359
Winsorized Mean ( 12 / 24 )22664.9305555556765.25864103999629.6173467897777
Winsorized Mean ( 13 / 24 )22645.9722222222756.96806782134629.9166810132431
Winsorized Mean ( 14 / 24 )22644.6111111111756.19403492024829.9455034890606
Winsorized Mean ( 15 / 24 )22464.4027777778720.27884822056631.1884804520855
Winsorized Mean ( 16 / 24 )22426.4027777778710.7579328215431.5527998241965
Winsorized Mean ( 17 / 24 )22364.7777777778691.77111865368732.3297362013374
Winsorized Mean ( 18 / 24 )22294.2777777778666.84514577505133.4324661715366
Winsorized Mean ( 19 / 24 )22297.9722222222660.50666015657933.7588908141158
Winsorized Mean ( 20 / 24 )21731.0277777778520.52836215784541.748018662599
Winsorized Mean ( 21 / 24 )21422.1527777778470.45675440984445.5347969329304
Winsorized Mean ( 22 / 24 )21402.9027777778414.04577030322951.6921179078902
Winsorized Mean ( 23 / 24 )21247.6527777778387.14839627126954.8824507150738
Winsorized Mean ( 24 / 24 )21283.3194444444362.23472773313158.7556018652207
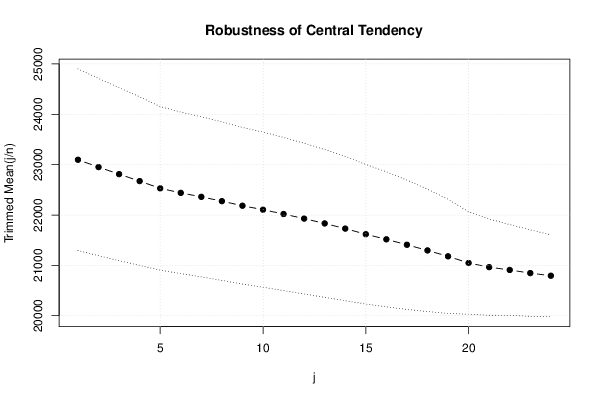
Trimmed Mean ( 1 / 24 )23097.4901.68172884018425.6159122018694
Trimmed Mean ( 2 / 24 )22951.7058823529880.20126426270726.0755202409056
Trimmed Mean ( 3 / 24 )22811.5151515152859.03736638729226.5547414397696
Trimmed Mean ( 4 / 24 )22673.4375836.91467607946927.0916954237364
Trimmed Mean ( 5 / 24 )22529.2741935484812.15981583464227.7399518595924
Trimmed Mean ( 6 / 24 )22439.7666666667802.16071074122927.9741532665336
Trimmed Mean ( 7 / 24 )22360.9137931034795.0060664329228.126720961305
Trimmed Mean ( 8 / 24 )22275.125787.24875318493428.2949003220172
Trimmed Mean ( 9 / 24 )22184.2222222222777.35548433989328.5380661346467
Trimmed Mean ( 10 / 24 )22105.4038461538770.22994463770528.6997460953711
Trimmed Mean ( 11 / 24 )22019.76760.53355575985928.9530420232409
Trimmed Mean ( 12 / 24 )21928.6458333333748.18528236399129.3091114597267
Trimmed Mean ( 13 / 24 )21832.6086956522733.91080127642529.7483136338649
Trimmed Mean ( 14 / 24 )21730.2272727273716.48987492542530.3287290347111
Trimmed Mean ( 15 / 24 )21618.2619047619693.01458828896931.1945264502104
Trimmed Mean ( 16 / 24 )21516.725670.58238177960332.0866243799883
Trimmed Mean ( 17 / 24 )21409642.15199961665233.3394585904593
Trimmed Mean ( 18 / 24 )21296.5555555556607.92086922982835.0317888947225
Trimmed Mean ( 19 / 24 )21179.1764705882567.05849744075437.3491916022316
Trimmed Mean ( 20 / 24 )21046.6875509.08028915035741.342570019999
Trimmed Mean ( 21 / 24 )20964.5666666667478.02379992529643.8567424256762
Trimmed Mean ( 22 / 24 )20908.5357142857450.72523711319846.3886509843571
Trimmed Mean ( 23 / 24 )20846.3076923077429.36338839023248.5516656892071
Trimmed Mean ( 24 / 24 )20793.9583333333406.37143660662851.1698324738855
Median20489
Midrange28067.5
Midmean - Weighted Average at Xnp21158.027027027
Midmean - Weighted Average at X(n+1)p21296.5555555556
Midmean - Empirical Distribution Function21158.027027027
Midmean - Empirical Distribution Function - Averaging21296.5555555556
Midmean - Empirical Distribution Function - Interpolation21296.5555555556
Midmean - Closest Observation21158.027027027
Midmean - True Basic - Statistics Graphics Toolkit21296.5555555556
Midmean - MS Excel (old versions)21409
Number of observations72

\begin{tabular}{lllllllll}
\hline
Central Tendency - Ungrouped Data \tabularnewline
Measure & Value & S.E. & Value/S.E. \tabularnewline
Arithmetic Mean & 23235.4583333333 & 921.480762125679 & 25.2153482615672 \tabularnewline
Geometric Mean & 22068.7603192786 &  &  \tabularnewline
Harmonic Mean & 21058.8547545439 &  &  \tabularnewline
Quadratic Mean & 24498.4596740852 &  &  \tabularnewline
Winsorized Mean ( 1 / 24 ) & 23235 & 919.413525902188 & 25.2715446808337 \tabularnewline
Winsorized Mean ( 2 / 24 ) & 23208.7222222222 & 911.844028207172 & 25.4525132635394 \tabularnewline
Winsorized Mean ( 3 / 24 ) & 23179.7222222222 & 903.973416361971 & 25.6420396912873 \tabularnewline
Winsorized Mean ( 4 / 24 ) & 23170 & 897.658380714152 & 25.8116010475684 \tabularnewline
Winsorized Mean ( 5 / 24 ) & 22902.2222222222 & 835.212926105419 & 27.4208186995079 \tabularnewline
Winsorized Mean ( 6 / 24 ) & 22820.8888888889 & 814.976481451505 & 28.0018987152169 \tabularnewline
Winsorized Mean ( 7 / 24 ) & 22827.9861111111 & 807.755529537289 & 28.2610087784701 \tabularnewline
Winsorized Mean ( 8 / 24 ) & 22820.5416666667 & 805.782263102821 & 28.3209779013896 \tabularnewline
Winsorized Mean ( 9 / 24 ) & 22696.5416666667 & 780.351200963808 & 29.085034582678 \tabularnewline
Winsorized Mean ( 10 / 24 ) & 22700.1527777778 & 779.505463401319 & 29.1212234468854 \tabularnewline
Winsorized Mean ( 11 / 24 ) & 22687.9305555556 & 775.862556074201 & 29.2422032458359 \tabularnewline
Winsorized Mean ( 12 / 24 ) & 22664.9305555556 & 765.258641039996 & 29.6173467897777 \tabularnewline
Winsorized Mean ( 13 / 24 ) & 22645.9722222222 & 756.968067821346 & 29.9166810132431 \tabularnewline
Winsorized Mean ( 14 / 24 ) & 22644.6111111111 & 756.194034920248 & 29.9455034890606 \tabularnewline
Winsorized Mean ( 15 / 24 ) & 22464.4027777778 & 720.278848220566 & 31.1884804520855 \tabularnewline
Winsorized Mean ( 16 / 24 ) & 22426.4027777778 & 710.75793282154 & 31.5527998241965 \tabularnewline
Winsorized Mean ( 17 / 24 ) & 22364.7777777778 & 691.771118653687 & 32.3297362013374 \tabularnewline
Winsorized Mean ( 18 / 24 ) & 22294.2777777778 & 666.845145775051 & 33.4324661715366 \tabularnewline
Winsorized Mean ( 19 / 24 ) & 22297.9722222222 & 660.506660156579 & 33.7588908141158 \tabularnewline
Winsorized Mean ( 20 / 24 ) & 21731.0277777778 & 520.528362157845 & 41.748018662599 \tabularnewline
Winsorized Mean ( 21 / 24 ) & 21422.1527777778 & 470.456754409844 & 45.5347969329304 \tabularnewline
Winsorized Mean ( 22 / 24 ) & 21402.9027777778 & 414.045770303229 & 51.6921179078902 \tabularnewline
Winsorized Mean ( 23 / 24 ) & 21247.6527777778 & 387.148396271269 & 54.8824507150738 \tabularnewline
Winsorized Mean ( 24 / 24 ) & 21283.3194444444 & 362.234727733131 & 58.7556018652207 \tabularnewline
Trimmed Mean ( 1 / 24 ) & 23097.4 & 901.681728840184 & 25.6159122018694 \tabularnewline
Trimmed Mean ( 2 / 24 ) & 22951.7058823529 & 880.201264262707 & 26.0755202409056 \tabularnewline
Trimmed Mean ( 3 / 24 ) & 22811.5151515152 & 859.037366387292 & 26.5547414397696 \tabularnewline
Trimmed Mean ( 4 / 24 ) & 22673.4375 & 836.914676079469 & 27.0916954237364 \tabularnewline
Trimmed Mean ( 5 / 24 ) & 22529.2741935484 & 812.159815834642 & 27.7399518595924 \tabularnewline
Trimmed Mean ( 6 / 24 ) & 22439.7666666667 & 802.160710741229 & 27.9741532665336 \tabularnewline
Trimmed Mean ( 7 / 24 ) & 22360.9137931034 & 795.00606643292 & 28.126720961305 \tabularnewline
Trimmed Mean ( 8 / 24 ) & 22275.125 & 787.248753184934 & 28.2949003220172 \tabularnewline
Trimmed Mean ( 9 / 24 ) & 22184.2222222222 & 777.355484339893 & 28.5380661346467 \tabularnewline
Trimmed Mean ( 10 / 24 ) & 22105.4038461538 & 770.229944637705 & 28.6997460953711 \tabularnewline
Trimmed Mean ( 11 / 24 ) & 22019.76 & 760.533555759859 & 28.9530420232409 \tabularnewline
Trimmed Mean ( 12 / 24 ) & 21928.6458333333 & 748.185282363991 & 29.3091114597267 \tabularnewline
Trimmed Mean ( 13 / 24 ) & 21832.6086956522 & 733.910801276425 & 29.7483136338649 \tabularnewline
Trimmed Mean ( 14 / 24 ) & 21730.2272727273 & 716.489874925425 & 30.3287290347111 \tabularnewline
Trimmed Mean ( 15 / 24 ) & 21618.2619047619 & 693.014588288969 & 31.1945264502104 \tabularnewline
Trimmed Mean ( 16 / 24 ) & 21516.725 & 670.582381779603 & 32.0866243799883 \tabularnewline
Trimmed Mean ( 17 / 24 ) & 21409 & 642.151999616652 & 33.3394585904593 \tabularnewline
Trimmed Mean ( 18 / 24 ) & 21296.5555555556 & 607.920869229828 & 35.0317888947225 \tabularnewline
Trimmed Mean ( 19 / 24 ) & 21179.1764705882 & 567.058497440754 & 37.3491916022316 \tabularnewline
Trimmed Mean ( 20 / 24 ) & 21046.6875 & 509.080289150357 & 41.342570019999 \tabularnewline
Trimmed Mean ( 21 / 24 ) & 20964.5666666667 & 478.023799925296 & 43.8567424256762 \tabularnewline
Trimmed Mean ( 22 / 24 ) & 20908.5357142857 & 450.725237113198 & 46.3886509843571 \tabularnewline
Trimmed Mean ( 23 / 24 ) & 20846.3076923077 & 429.363388390232 & 48.5516656892071 \tabularnewline
Trimmed Mean ( 24 / 24 ) & 20793.9583333333 & 406.371436606628 & 51.1698324738855 \tabularnewline
Median & 20489 &  &  \tabularnewline
Midrange & 28067.5 &  &  \tabularnewline
Midmean - Weighted Average at Xnp & 21158.027027027 &  &  \tabularnewline
Midmean - Weighted Average at X(n+1)p & 21296.5555555556 &  &  \tabularnewline
Midmean - Empirical Distribution Function & 21158.027027027 &  &  \tabularnewline
Midmean - Empirical Distribution Function - Averaging & 21296.5555555556 &  &  \tabularnewline
Midmean - Empirical Distribution Function - Interpolation & 21296.5555555556 &  &  \tabularnewline
Midmean - Closest Observation & 21158.027027027 &  &  \tabularnewline
Midmean - True Basic - Statistics Graphics Toolkit & 21296.5555555556 &  &  \tabularnewline
Midmean - MS Excel (old versions) & 21409 &  &  \tabularnewline
Number of observations & 72 &  &  \tabularnewline
\hline
\end{tabular}
%Source: https://freestatistics.org/blog/index.php?pk=180115&T=1

[TABLE]
[ROW][C]Central Tendency - Ungrouped Data[/C][/ROW]
[ROW][C]Measure[/C][C]Value[/C][C]S.E.[/C][C]Value/S.E.[/C][/ROW]
[ROW][C]Arithmetic Mean[/C][C]23235.4583333333[/C][C]921.480762125679[/C][C]25.2153482615672[/C][/ROW]
[ROW][C]Geometric Mean[/C][C]22068.7603192786[/C][C][/C][C][/C][/ROW]
[ROW][C]Harmonic Mean[/C][C]21058.8547545439[/C][C][/C][C][/C][/ROW]
[ROW][C]Quadratic Mean[/C][C]24498.4596740852[/C][C][/C][C][/C][/ROW]
[ROW][C]Winsorized Mean ( 1 / 24 )[/C][C]23235[/C][C]919.413525902188[/C][C]25.2715446808337[/C][/ROW]
[ROW][C]Winsorized Mean ( 2 / 24 )[/C][C]23208.7222222222[/C][C]911.844028207172[/C][C]25.4525132635394[/C][/ROW]
[ROW][C]Winsorized Mean ( 3 / 24 )[/C][C]23179.7222222222[/C][C]903.973416361971[/C][C]25.6420396912873[/C][/ROW]
[ROW][C]Winsorized Mean ( 4 / 24 )[/C][C]23170[/C][C]897.658380714152[/C][C]25.8116010475684[/C][/ROW]
[ROW][C]Winsorized Mean ( 5 / 24 )[/C][C]22902.2222222222[/C][C]835.212926105419[/C][C]27.4208186995079[/C][/ROW]
[ROW][C]Winsorized Mean ( 6 / 24 )[/C][C]22820.8888888889[/C][C]814.976481451505[/C][C]28.0018987152169[/C][/ROW]
[ROW][C]Winsorized Mean ( 7 / 24 )[/C][C]22827.9861111111[/C][C]807.755529537289[/C][C]28.2610087784701[/C][/ROW]
[ROW][C]Winsorized Mean ( 8 / 24 )[/C][C]22820.5416666667[/C][C]805.782263102821[/C][C]28.3209779013896[/C][/ROW]
[ROW][C]Winsorized Mean ( 9 / 24 )[/C][C]22696.5416666667[/C][C]780.351200963808[/C][C]29.085034582678[/C][/ROW]
[ROW][C]Winsorized Mean ( 10 / 24 )[/C][C]22700.1527777778[/C][C]779.505463401319[/C][C]29.1212234468854[/C][/ROW]
[ROW][C]Winsorized Mean ( 11 / 24 )[/C][C]22687.9305555556[/C][C]775.862556074201[/C][C]29.2422032458359[/C][/ROW]
[ROW][C]Winsorized Mean ( 12 / 24 )[/C][C]22664.9305555556[/C][C]765.258641039996[/C][C]29.6173467897777[/C][/ROW]
[ROW][C]Winsorized Mean ( 13 / 24 )[/C][C]22645.9722222222[/C][C]756.968067821346[/C][C]29.9166810132431[/C][/ROW]
[ROW][C]Winsorized Mean ( 14 / 24 )[/C][C]22644.6111111111[/C][C]756.194034920248[/C][C]29.9455034890606[/C][/ROW]
[ROW][C]Winsorized Mean ( 15 / 24 )[/C][C]22464.4027777778[/C][C]720.278848220566[/C][C]31.1884804520855[/C][/ROW]
[ROW][C]Winsorized Mean ( 16 / 24 )[/C][C]22426.4027777778[/C][C]710.75793282154[/C][C]31.5527998241965[/C][/ROW]
[ROW][C]Winsorized Mean ( 17 / 24 )[/C][C]22364.7777777778[/C][C]691.771118653687[/C][C]32.3297362013374[/C][/ROW]
[ROW][C]Winsorized Mean ( 18 / 24 )[/C][C]22294.2777777778[/C][C]666.845145775051[/C][C]33.4324661715366[/C][/ROW]
[ROW][C]Winsorized Mean ( 19 / 24 )[/C][C]22297.9722222222[/C][C]660.506660156579[/C][C]33.7588908141158[/C][/ROW]
[ROW][C]Winsorized Mean ( 20 / 24 )[/C][C]21731.0277777778[/C][C]520.528362157845[/C][C]41.748018662599[/C][/ROW]
[ROW][C]Winsorized Mean ( 21 / 24 )[/C][C]21422.1527777778[/C][C]470.456754409844[/C][C]45.5347969329304[/C][/ROW]
[ROW][C]Winsorized Mean ( 22 / 24 )[/C][C]21402.9027777778[/C][C]414.045770303229[/C][C]51.6921179078902[/C][/ROW]
[ROW][C]Winsorized Mean ( 23 / 24 )[/C][C]21247.6527777778[/C][C]387.148396271269[/C][C]54.8824507150738[/C][/ROW]
[ROW][C]Winsorized Mean ( 24 / 24 )[/C][C]21283.3194444444[/C][C]362.234727733131[/C][C]58.7556018652207[/C][/ROW]
[ROW][C]Trimmed Mean ( 1 / 24 )[/C][C]23097.4[/C][C]901.681728840184[/C][C]25.6159122018694[/C][/ROW]
[ROW][C]Trimmed Mean ( 2 / 24 )[/C][C]22951.7058823529[/C][C]880.201264262707[/C][C]26.0755202409056[/C][/ROW]
[ROW][C]Trimmed Mean ( 3 / 24 )[/C][C]22811.5151515152[/C][C]859.037366387292[/C][C]26.5547414397696[/C][/ROW]
[ROW][C]Trimmed Mean ( 4 / 24 )[/C][C]22673.4375[/C][C]836.914676079469[/C][C]27.0916954237364[/C][/ROW]
[ROW][C]Trimmed Mean ( 5 / 24 )[/C][C]22529.2741935484[/C][C]812.159815834642[/C][C]27.7399518595924[/C][/ROW]
[ROW][C]Trimmed Mean ( 6 / 24 )[/C][C]22439.7666666667[/C][C]802.160710741229[/C][C]27.9741532665336[/C][/ROW]
[ROW][C]Trimmed Mean ( 7 / 24 )[/C][C]22360.9137931034[/C][C]795.00606643292[/C][C]28.126720961305[/C][/ROW]
[ROW][C]Trimmed Mean ( 8 / 24 )[/C][C]22275.125[/C][C]787.248753184934[/C][C]28.2949003220172[/C][/ROW]
[ROW][C]Trimmed Mean ( 9 / 24 )[/C][C]22184.2222222222[/C][C]777.355484339893[/C][C]28.5380661346467[/C][/ROW]
[ROW][C]Trimmed Mean ( 10 / 24 )[/C][C]22105.4038461538[/C][C]770.229944637705[/C][C]28.6997460953711[/C][/ROW]
[ROW][C]Trimmed Mean ( 11 / 24 )[/C][C]22019.76[/C][C]760.533555759859[/C][C]28.9530420232409[/C][/ROW]
[ROW][C]Trimmed Mean ( 12 / 24 )[/C][C]21928.6458333333[/C][C]748.185282363991[/C][C]29.3091114597267[/C][/ROW]
[ROW][C]Trimmed Mean ( 13 / 24 )[/C][C]21832.6086956522[/C][C]733.910801276425[/C][C]29.7483136338649[/C][/ROW]
[ROW][C]Trimmed Mean ( 14 / 24 )[/C][C]21730.2272727273[/C][C]716.489874925425[/C][C]30.3287290347111[/C][/ROW]
[ROW][C]Trimmed Mean ( 15 / 24 )[/C][C]21618.2619047619[/C][C]693.014588288969[/C][C]31.1945264502104[/C][/ROW]
[ROW][C]Trimmed Mean ( 16 / 24 )[/C][C]21516.725[/C][C]670.582381779603[/C][C]32.0866243799883[/C][/ROW]
[ROW][C]Trimmed Mean ( 17 / 24 )[/C][C]21409[/C][C]642.151999616652[/C][C]33.3394585904593[/C][/ROW]
[ROW][C]Trimmed Mean ( 18 / 24 )[/C][C]21296.5555555556[/C][C]607.920869229828[/C][C]35.0317888947225[/C][/ROW]
[ROW][C]Trimmed Mean ( 19 / 24 )[/C][C]21179.1764705882[/C][C]567.058497440754[/C][C]37.3491916022316[/C][/ROW]
[ROW][C]Trimmed Mean ( 20 / 24 )[/C][C]21046.6875[/C][C]509.080289150357[/C][C]41.342570019999[/C][/ROW]
[ROW][C]Trimmed Mean ( 21 / 24 )[/C][C]20964.5666666667[/C][C]478.023799925296[/C][C]43.8567424256762[/C][/ROW]
[ROW][C]Trimmed Mean ( 22 / 24 )[/C][C]20908.5357142857[/C][C]450.725237113198[/C][C]46.3886509843571[/C][/ROW]
[ROW][C]Trimmed Mean ( 23 / 24 )[/C][C]20846.3076923077[/C][C]429.363388390232[/C][C]48.5516656892071[/C][/ROW]
[ROW][C]Trimmed Mean ( 24 / 24 )[/C][C]20793.9583333333[/C][C]406.371436606628[/C][C]51.1698324738855[/C][/ROW]
[ROW][C]Median[/C][C]20489[/C][C][/C][C][/C][/ROW]
[ROW][C]Midrange[/C][C]28067.5[/C][C][/C][C][/C][/ROW]
[ROW][C]Midmean - Weighted Average at Xnp[/C][C]21158.027027027[/C][C][/C][C][/C][/ROW]
[ROW][C]Midmean - Weighted Average at X(n+1)p[/C][C]21296.5555555556[/C][C][/C][C][/C][/ROW]
[ROW][C]Midmean - Empirical Distribution Function[/C][C]21158.027027027[/C][C][/C][C][/C][/ROW]
[ROW][C]Midmean - Empirical Distribution Function - Averaging[/C][C]21296.5555555556[/C][C][/C][C][/C][/ROW]
[ROW][C]Midmean - Empirical Distribution Function - Interpolation[/C][C]21296.5555555556[/C][C][/C][C][/C][/ROW]
[ROW][C]Midmean - Closest Observation[/C][C]21158.027027027[/C][C][/C][C][/C][/ROW]
[ROW][C]Midmean - True Basic - Statistics Graphics Toolkit[/C][C]21296.5555555556[/C][C][/C][C][/C][/ROW]
[ROW][C]Midmean - MS Excel (old versions)[/C][C]21409[/C][C][/C][C][/C][/ROW]
[ROW][C]Number of observations[/C][C]72[/C][C][/C][C][/C][/ROW]
[/TABLE]
Source: https://freestatistics.org/blog/index.php?pk=180115&T=1

Globally Unique Identifier (entire table): ba.freestatistics.org/blog/index.php?pk=180115&T=1

As an alternative you can also use a QR Code:  

The GUIDs for individual cells are displayed in the table below:

Central Tendency - Ungrouped Data
MeasureValueS.E.Value/S.E.
Arithmetic Mean23235.4583333333921.48076212567925.2153482615672
Geometric Mean22068.7603192786
Harmonic Mean21058.8547545439
Quadratic Mean24498.4596740852
Winsorized Mean ( 1 / 24 )23235919.41352590218825.2715446808337
Winsorized Mean ( 2 / 24 )23208.7222222222911.84402820717225.4525132635394
Winsorized Mean ( 3 / 24 )23179.7222222222903.97341636197125.6420396912873
Winsorized Mean ( 4 / 24 )23170897.65838071415225.8116010475684
Winsorized Mean ( 5 / 24 )22902.2222222222835.21292610541927.4208186995079
Winsorized Mean ( 6 / 24 )22820.8888888889814.97648145150528.0018987152169
Winsorized Mean ( 7 / 24 )22827.9861111111807.75552953728928.2610087784701
Winsorized Mean ( 8 / 24 )22820.5416666667805.78226310282128.3209779013896
Winsorized Mean ( 9 / 24 )22696.5416666667780.35120096380829.085034582678
Winsorized Mean ( 10 / 24 )22700.1527777778779.50546340131929.1212234468854
Winsorized Mean ( 11 / 24 )22687.9305555556775.86255607420129.2422032458359
Winsorized Mean ( 12 / 24 )22664.9305555556765.25864103999629.6173467897777
Winsorized Mean ( 13 / 24 )22645.9722222222756.96806782134629.9166810132431
Winsorized Mean ( 14 / 24 )22644.6111111111756.19403492024829.9455034890606
Winsorized Mean ( 15 / 24 )22464.4027777778720.27884822056631.1884804520855
Winsorized Mean ( 16 / 24 )22426.4027777778710.7579328215431.5527998241965
Winsorized Mean ( 17 / 24 )22364.7777777778691.77111865368732.3297362013374
Winsorized Mean ( 18 / 24 )22294.2777777778666.84514577505133.4324661715366
Winsorized Mean ( 19 / 24 )22297.9722222222660.50666015657933.7588908141158
Winsorized Mean ( 20 / 24 )21731.0277777778520.52836215784541.748018662599
Winsorized Mean ( 21 / 24 )21422.1527777778470.45675440984445.5347969329304
Winsorized Mean ( 22 / 24 )21402.9027777778414.04577030322951.6921179078902
Winsorized Mean ( 23 / 24 )21247.6527777778387.14839627126954.8824507150738
Winsorized Mean ( 24 / 24 )21283.3194444444362.23472773313158.7556018652207
Trimmed Mean ( 1 / 24 )23097.4901.68172884018425.6159122018694
Trimmed Mean ( 2 / 24 )22951.7058823529880.20126426270726.0755202409056
Trimmed Mean ( 3 / 24 )22811.5151515152859.03736638729226.5547414397696
Trimmed Mean ( 4 / 24 )22673.4375836.91467607946927.0916954237364
Trimmed Mean ( 5 / 24 )22529.2741935484812.15981583464227.7399518595924
Trimmed Mean ( 6 / 24 )22439.7666666667802.16071074122927.9741532665336
Trimmed Mean ( 7 / 24 )22360.9137931034795.0060664329228.126720961305
Trimmed Mean ( 8 / 24 )22275.125787.24875318493428.2949003220172
Trimmed Mean ( 9 / 24 )22184.2222222222777.35548433989328.5380661346467
Trimmed Mean ( 10 / 24 )22105.4038461538770.22994463770528.6997460953711
Trimmed Mean ( 11 / 24 )22019.76760.53355575985928.9530420232409
Trimmed Mean ( 12 / 24 )21928.6458333333748.18528236399129.3091114597267
Trimmed Mean ( 13 / 24 )21832.6086956522733.91080127642529.7483136338649
Trimmed Mean ( 14 / 24 )21730.2272727273716.48987492542530.3287290347111
Trimmed Mean ( 15 / 24 )21618.2619047619693.01458828896931.1945264502104
Trimmed Mean ( 16 / 24 )21516.725670.58238177960332.0866243799883
Trimmed Mean ( 17 / 24 )21409642.15199961665233.3394585904593
Trimmed Mean ( 18 / 24 )21296.5555555556607.92086922982835.0317888947225
Trimmed Mean ( 19 / 24 )21179.1764705882567.05849744075437.3491916022316
Trimmed Mean ( 20 / 24 )21046.6875509.08028915035741.342570019999
Trimmed Mean ( 21 / 24 )20964.5666666667478.02379992529643.8567424256762
Trimmed Mean ( 22 / 24 )20908.5357142857450.72523711319846.3886509843571
Trimmed Mean ( 23 / 24 )20846.3076923077429.36338839023248.5516656892071
Trimmed Mean ( 24 / 24 )20793.9583333333406.37143660662851.1698324738855
Median20489
Midrange28067.5
Midmean - Weighted Average at Xnp21158.027027027
Midmean - Weighted Average at X(n+1)p21296.5555555556
Midmean - Empirical Distribution Function21158.027027027
Midmean - Empirical Distribution Function - Averaging21296.5555555556
Midmean - Empirical Distribution Function - Interpolation21296.5555555556
Midmean - Closest Observation21158.027027027
Midmean - True Basic - Statistics Graphics Toolkit21296.5555555556
Midmean - MS Excel (old versions)21409
Number of observations72


Parameters (Session):
Parameters (R input):
R code (references can be found in the software module):
geomean <- function(x) {
return(exp(mean(log(x))))
}
harmean <- function(x) {
return(1/mean(1/x))
}
quamean <- function(x) {
return(sqrt(mean(x*x)))
}
winmean <- function(x) {
x <-sort(x[!is.na(x)])
n<-length(x)
denom <- 3
nodenom <- n/denom
if (nodenom>40) denom <- n/40
sqrtn = sqrt(n)
roundnodenom = floor(nodenom)
win <- array(NA,dim=c(roundnodenom,2))
for (j in 1:roundnodenom) {
win[j,1] <- (j*x[j+1]+sum(x[(j+1):(n-j)])+j*x[n-j])/n
win[j,2] <- sd(c(rep(x[j+1],j),x[(j+1):(n-j)],rep(x[n-j],j)))/sqrtn
}
return(win)
}
trimean <- function(x) {
x <-sort(x[!is.na(x)])
n<-length(x)
denom <- 3
nodenom <- n/denom
if (nodenom>40) denom <- n/40
sqrtn = sqrt(n)
roundnodenom = floor(nodenom)
tri <- array(NA,dim=c(roundnodenom,2))
for (j in 1:roundnodenom) {
tri[j,1] <- mean(x,trim=j/n)
tri[j,2] <- sd(x[(j+1):(n-j)]) / sqrt(n-j*2)
}
return(tri)
}
midrange <- function(x) {
return((max(x)+min(x))/2)
}
q1 <- function(data,n,p,i,f) {
np <- n*p;
i <<- floor(np)
f <<- np - i
qvalue <- (1-f)*data[i] + f*data[i+1]
}
q2 <- function(data,n,p,i,f) {
np <- (n+1)*p
i <<- floor(np)
f <<- np - i
qvalue <- (1-f)*data[i] + f*data[i+1]
}
q3 <- function(data,n,p,i,f) {
np <- n*p
i <<- floor(np)
f <<- np - i
if (f==0) {
qvalue <- data[i]
} else {
qvalue <- data[i+1]
}
}
q4 <- function(data,n,p,i,f) {
np <- n*p
i <<- floor(np)
f <<- np - i
if (f==0) {
qvalue <- (data[i]+data[i+1])/2
} else {
qvalue <- data[i+1]
}
}
q5 <- function(data,n,p,i,f) {
np <- (n-1)*p
i <<- floor(np)
f <<- np - i
if (f==0) {
qvalue <- data[i+1]
} else {
qvalue <- data[i+1] + f*(data[i+2]-data[i+1])
}
}
q6 <- function(data,n,p,i,f) {
np <- n*p+0.5
i <<- floor(np)
f <<- np - i
qvalue <- data[i]
}
q7 <- function(data,n,p,i,f) {
np <- (n+1)*p
i <<- floor(np)
f <<- np - i
if (f==0) {
qvalue <- data[i]
} else {
qvalue <- f*data[i] + (1-f)*data[i+1]
}
}
q8 <- function(data,n,p,i,f) {
np <- (n+1)*p
i <<- floor(np)
f <<- np - i
if (f==0) {
qvalue <- data[i]
} else {
if (f == 0.5) {
qvalue <- (data[i]+data[i+1])/2
} else {
if (f < 0.5) {
qvalue <- data[i]
} else {
qvalue <- data[i+1]
}
}
}
}
midmean <- function(x,def) {
x <-sort(x[!is.na(x)])
n<-length(x)
if (def==1) {
qvalue1 <- q1(x,n,0.25,i,f)
qvalue3 <- q1(x,n,0.75,i,f)
}
if (def==2) {
qvalue1 <- q2(x,n,0.25,i,f)
qvalue3 <- q2(x,n,0.75,i,f)
}
if (def==3) {
qvalue1 <- q3(x,n,0.25,i,f)
qvalue3 <- q3(x,n,0.75,i,f)
}
if (def==4) {
qvalue1 <- q4(x,n,0.25,i,f)
qvalue3 <- q4(x,n,0.75,i,f)
}
if (def==5) {
qvalue1 <- q5(x,n,0.25,i,f)
qvalue3 <- q5(x,n,0.75,i,f)
}
if (def==6) {
qvalue1 <- q6(x,n,0.25,i,f)
qvalue3 <- q6(x,n,0.75,i,f)
}
if (def==7) {
qvalue1 <- q7(x,n,0.25,i,f)
qvalue3 <- q7(x,n,0.75,i,f)
}
if (def==8) {
qvalue1 <- q8(x,n,0.25,i,f)
qvalue3 <- q8(x,n,0.75,i,f)
}
midm <- 0
myn <- 0
roundno4 <- round(n/4)
round3no4 <- round(3*n/4)
for (i in 1:n) {
if ((x[i]>=qvalue1) & (x[i]<=qvalue3)){
midm = midm + x[i]
myn = myn + 1
}
}
midm = midm / myn
return(midm)
}
(arm <- mean(x))
sqrtn <- sqrt(length(x))
(armse <- sd(x) / sqrtn)
(armose <- arm / armse)
(geo <- geomean(x))
(har <- harmean(x))
(qua <- quamean(x))
(win <- winmean(x))
(tri <- trimean(x))
(midr <- midrange(x))
midm <- array(NA,dim=8)
for (j in 1:8) midm[j] <- midmean(x,j)
midm
bitmap(file='test1.png')
lb <- win[,1] - 2*win[,2]
ub <- win[,1] + 2*win[,2]
if ((ylimmin == '') | (ylimmax == '')) plot(win[,1],type='b',main=main, xlab='j', pch=19, ylab='Winsorized Mean(j/n)', ylim=c(min(lb),max(ub))) else plot(win[,1],type='l',main=main, xlab='j', pch=19, ylab='Winsorized Mean(j/n)', ylim=c(ylimmin,ylimmax))
lines(ub,lty=3)
lines(lb,lty=3)
grid()
dev.off()
bitmap(file='test2.png')
lb <- tri[,1] - 2*tri[,2]
ub <- tri[,1] + 2*tri[,2]
if ((ylimmin == '') | (ylimmax == '')) plot(tri[,1],type='b',main=main, xlab='j', pch=19, ylab='Trimmed Mean(j/n)', ylim=c(min(lb),max(ub))) else plot(tri[,1],type='l',main=main, xlab='j', pch=19, ylab='Trimmed Mean(j/n)', ylim=c(ylimmin,ylimmax))
lines(ub,lty=3)
lines(lb,lty=3)
grid()
dev.off()
load(file='createtable')
a<-table.start()
a<-table.row.start(a)
a<-table.element(a,'Central Tendency - Ungrouped Data',4,TRUE)
a<-table.row.end(a)
a<-table.row.start(a)
a<-table.element(a,'Measure',header=TRUE)
a<-table.element(a,'Value',header=TRUE)
a<-table.element(a,'S.E.',header=TRUE)
a<-table.element(a,'Value/S.E.',header=TRUE)
a<-table.row.end(a)
a<-table.row.start(a)
a<-table.element(a,hyperlink('arithmetic_mean.htm', 'Arithmetic Mean', 'click to view the definition of the Arithmetic Mean'),header=TRUE)
a<-table.element(a,arm)
a<-table.element(a,hyperlink('arithmetic_mean_standard_error.htm', armse, 'click to view the definition of the Standard Error of the Arithmetic Mean'))
a<-table.element(a,armose)
a<-table.row.end(a)
a<-table.row.start(a)
a<-table.element(a,hyperlink('geometric_mean.htm', 'Geometric Mean', 'click to view the definition of the Geometric Mean'),header=TRUE)
a<-table.element(a,geo)
a<-table.element(a,'')
a<-table.row.end(a)
a<-table.row.start(a)
a<-table.element(a,hyperlink('harmonic_mean.htm', 'Harmonic Mean', 'click to view the definition of the Harmonic Mean'),header=TRUE)
a<-table.element(a,har)
a<-table.element(a,'')
a<-table.row.end(a)
a<-table.row.start(a)
a<-table.element(a,hyperlink('quadratic_mean.htm', 'Quadratic Mean', 'click to view the definition of the Quadratic Mean'),header=TRUE)
a<-table.element(a,qua)
a<-table.element(a,'')
a<-table.row.end(a)
for (j in 1:length(win[,1])) {
a<-table.row.start(a)
mylabel <- paste('Winsorized Mean (',j)
mylabel <- paste(mylabel,'/')
mylabel <- paste(mylabel,length(win[,1]))
mylabel <- paste(mylabel,')')
a<-table.element(a,hyperlink('winsorized_mean.htm', mylabel, 'click to view the definition of the Winsorized Mean'),header=TRUE)
a<-table.element(a,win[j,1])
a<-table.element(a,win[j,2])
a<-table.element(a,win[j,1]/win[j,2])
a<-table.row.end(a)
}
for (j in 1:length(tri[,1])) {
a<-table.row.start(a)
mylabel <- paste('Trimmed Mean (',j)
mylabel <- paste(mylabel,'/')
mylabel <- paste(mylabel,length(tri[,1]))
mylabel <- paste(mylabel,')')
a<-table.element(a,hyperlink('arithmetic_mean.htm', mylabel, 'click to view the definition of the Trimmed Mean'),header=TRUE)
a<-table.element(a,tri[j,1])
a<-table.element(a,tri[j,2])
a<-table.element(a,tri[j,1]/tri[j,2])
a<-table.row.end(a)
}
a<-table.row.start(a)
a<-table.element(a,hyperlink('median_1.htm', 'Median', 'click to view the definition of the Median'),header=TRUE)
a<-table.element(a,median(x))
a<-table.element(a,'')
a<-table.row.end(a)
a<-table.row.start(a)
a<-table.element(a,hyperlink('midrange.htm', 'Midrange', 'click to view the definition of the Midrange'),header=TRUE)
a<-table.element(a,midr)
a<-table.element(a,'')
a<-table.row.end(a)
a<-table.row.start(a)
mymid <- hyperlink('midmean.htm', 'Midmean', 'click to view the definition of the Midmean')
mylabel <- paste(mymid,hyperlink('method_1.htm','Weighted Average at Xnp',''),sep=' - ')
a<-table.element(a,mylabel,header=TRUE)
a<-table.element(a,midm[1])
a<-table.element(a,'')
a<-table.row.end(a)
a<-table.row.start(a)
mymid <- hyperlink('midmean.htm', 'Midmean', 'click to view the definition of the Midmean')
mylabel <- paste(mymid,hyperlink('method_2.htm','Weighted Average at X(n+1)p',''),sep=' - ')
a<-table.element(a,mylabel,header=TRUE)
a<-table.element(a,midm[2])
a<-table.element(a,'')
a<-table.row.end(a)
a<-table.row.start(a)
mymid <- hyperlink('midmean.htm', 'Midmean', 'click to view the definition of the Midmean')
mylabel <- paste(mymid,hyperlink('method_3.htm','Empirical Distribution Function',''),sep=' - ')
a<-table.element(a,mylabel,header=TRUE)
a<-table.element(a,midm[3])
a<-table.element(a,'')
a<-table.row.end(a)
a<-table.row.start(a)
mymid <- hyperlink('midmean.htm', 'Midmean', 'click to view the definition of the Midmean')
mylabel <- paste(mymid,hyperlink('method_4.htm','Empirical Distribution Function - Averaging',''),sep=' - ')
a<-table.element(a,mylabel,header=TRUE)
a<-table.element(a,midm[4])
a<-table.element(a,'')
a<-table.row.end(a)
a<-table.row.start(a)
mymid <- hyperlink('midmean.htm', 'Midmean', 'click to view the definition of the Midmean')
mylabel <- paste(mymid,hyperlink('method_5.htm','Empirical Distribution Function - Interpolation',''),sep=' - ')
a<-table.element(a,mylabel,header=TRUE)
a<-table.element(a,midm[5])
a<-table.element(a,'')
a<-table.row.end(a)
a<-table.row.start(a)
mymid <- hyperlink('midmean.htm', 'Midmean', 'click to view the definition of the Midmean')
mylabel <- paste(mymid,hyperlink('method_6.htm','Closest Observation',''),sep=' - ')
a<-table.element(a,mylabel,header=TRUE)
a<-table.element(a,midm[6])
a<-table.element(a,'')
a<-table.row.end(a)
a<-table.row.start(a)
mymid <- hyperlink('midmean.htm', 'Midmean', 'click to view the definition of the Midmean')
mylabel <- paste(mymid,hyperlink('method_7.htm','True Basic - Statistics Graphics Toolkit',''),sep=' - ')
a<-table.element(a,mylabel,header=TRUE)
a<-table.element(a,midm[7])
a<-table.element(a,'')
a<-table.row.end(a)
a<-table.row.start(a)
mymid <- hyperlink('midmean.htm', 'Midmean', 'click to view the definition of the Midmean')
mylabel <- paste(mymid,hyperlink('method_8.htm','MS Excel (old versions)',''),sep=' - ')
a<-table.element(a,mylabel,header=TRUE)
a<-table.element(a,midm[8])
a<-table.element(a,'')
a<-table.row.end(a)
a<-table.row.start(a)
a<-table.element(a,'Number of observations',header=TRUE)
a<-table.element(a,length(x))
a<-table.element(a,'')
a<-table.row.end(a)
a<-table.end(a)
table.save(a,file='mytable.tab')