Free Statistics

of Irreproducible Research!

Author's title

Author*Unverified author*
R Software Modulerwasp_centraltendency.wasp
Title produced by softwareCentral Tendency
Date of computationTue, 16 Oct 2012 17:01:03 -0400
Cite this page as followsStatistical Computations at FreeStatistics.org, Office for Research Development and Education, URL https://freestatistics.org/blog/index.php?v=date/2012/Oct/16/t1350421279yn1lrrmwxk34w72.htm/, Retrieved Tue, 30 Apr 2024 12:34:15 +0000
Statistical Computations at FreeStatistics.org, Office for Research Development and Education, URL https://freestatistics.org/blog/index.php?pk=179261, Retrieved Tue, 30 Apr 2024 12:34:15 +0000
QR Codes:

Original text written by user:
IsPrivate?No (this computation is public)
User-defined keywords
Estimated Impact40
Family? (F = Feedback message, R = changed R code, M = changed R Module, P = changed Parameters, D = changed Data)
-       [Central Tendency] [] [2012-10-16 21:01:03] [12b8557b172aaf3a26b1fb7475bc9c63] [Current]
Feedback Forum

Post a new message
Dataseries X:
1103
1125
1150
1187
1248
1172
1092
5255
5297
5461
5729
5795
5411
5503
5583
5763
5840
5907
5836
5756
5916
6056
6469
6603
6247
6342
6431


Summary of computational transaction
Raw Inputview raw input (R code)
Raw Outputview raw output of R engine
Computing time2 seconds
R Server'Herman Ole Andreas Wold' @ wold.wessa.net

\begin{tabular}{lllllllll}
\hline
Summary of computational transaction \tabularnewline
Raw Input & view raw input (R code)  \tabularnewline
Raw Output & view raw output of R engine  \tabularnewline
Computing time & 2 seconds \tabularnewline
R Server & 'Herman Ole Andreas Wold' @ wold.wessa.net \tabularnewline
\hline
\end{tabular}
%Source: https://freestatistics.org/blog/index.php?pk=179261&T=0

[TABLE]
[ROW][C]Summary of computational transaction[/C][/ROW]
[ROW][C]Raw Input[/C][C]view raw input (R code) [/C][/ROW]
[ROW][C]Raw Output[/C][C]view raw output of R engine [/C][/ROW]
[ROW][C]Computing time[/C][C]2 seconds[/C][/ROW]
[ROW][C]R Server[/C][C]'Herman Ole Andreas Wold' @ wold.wessa.net[/C][/ROW]
[/TABLE]
Source: https://freestatistics.org/blog/index.php?pk=179261&T=0

Globally Unique Identifier (entire table): ba.freestatistics.org/blog/index.php?pk=179261&T=0

As an alternative you can also use a QR Code:  

The GUIDs for individual cells are displayed in the table below:

Summary of computational transaction
Raw Inputview raw input (R code)
Raw Outputview raw output of R engine
Computing time2 seconds
R Server'Herman Ole Andreas Wold' @ wold.wessa.net


Central Tendency - Ungrouped Data
MeasureValueS.E.Value/S.E.
Arithmetic Mean4639.88888888889409.68210987190811.325583365941
Geometric Mean3838.25932696016
Harmonic Mean2840.5119826828
Quadratic Mean5088.4569479471
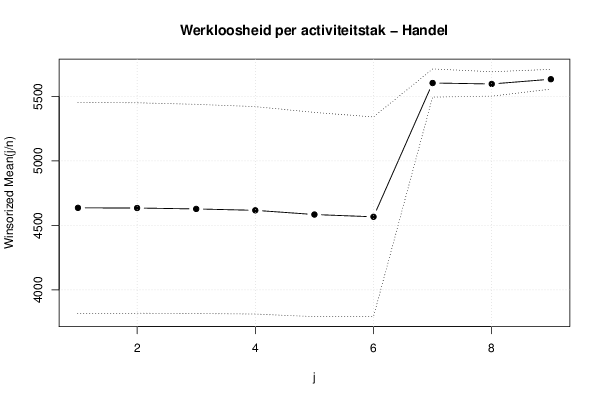
Winsorized Mean ( 1 / 9 )4635.33333333333408.66091865842311.3427370264582
Winsorized Mean ( 2 / 9 )4634.14814814815407.63875236807911.3682718368339
Winsorized Mean ( 3 / 9 )4627.03703703704405.07687526692511.422614618492
Winsorized Mean ( 4 / 9 )4616.22222222222401.75685171660111.4900895964769
Winsorized Mean ( 5 / 9 )4583.62962962963395.54543159574311.5881243050589
Winsorized Mean ( 6 / 9 )4566.07407407407386.75347878230711.8061616108803
Winsorized Mean ( 7 / 9 )5602.5925925925954.451768021109102.890921566048
Winsorized Mean ( 8 / 9 )5595.1851851851947.2922367949982118.310859548452
Winsorized Mean ( 9 / 9 )5631.8518518518538.1436669290091147.648412050513
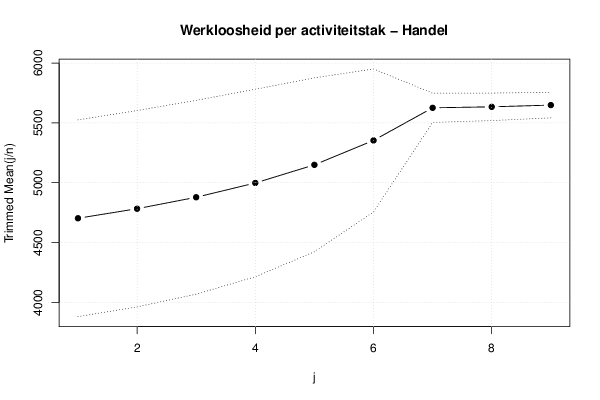
Trimmed Mean ( 1 / 9 )4703.28410.8558121774611.447519690846
Trimmed Mean ( 2 / 9 )4783.04347826087409.99225134035611.6661801841962
Trimmed Mean ( 3 / 9 )4878.7619047619404.6336962215512.0572308987599
Trimmed Mean ( 4 / 9 )4998391.61934017913312.7623931895545
Trimmed Mean ( 5 / 9 )5149.58823529412363.1062482130414.1820424755478
Trimmed Mean ( 6 / 9 )5353.33333333333298.53438290719217.9320495053247
Trimmed Mean ( 7 / 9 )5625.8461538461560.975283575401292.2643704787253
Trimmed Mean ( 8 / 9 )563457.421883696659898.1159035074937
Trimmed Mean ( 9 / 9 )5648.5555555555653.3317997464696105.913462182185
Median5729
Midrange3847.5
Midmean - Weighted Average at Xnp5313.14285714286
Midmean - Weighted Average at X(n+1)p5353.33333333333
Midmean - Empirical Distribution Function5353.33333333333
Midmean - Empirical Distribution Function - Averaging5353.33333333333
Midmean - Empirical Distribution Function - Interpolation5625.84615384615
Midmean - Closest Observation5313.14285714286
Midmean - True Basic - Statistics Graphics Toolkit5353.33333333333
Midmean - MS Excel (old versions)5353.33333333333
Number of observations27

\begin{tabular}{lllllllll}
\hline
Central Tendency - Ungrouped Data \tabularnewline
Measure & Value & S.E. & Value/S.E. \tabularnewline
Arithmetic Mean & 4639.88888888889 & 409.682109871908 & 11.325583365941 \tabularnewline
Geometric Mean & 3838.25932696016 &  &  \tabularnewline
Harmonic Mean & 2840.5119826828 &  &  \tabularnewline
Quadratic Mean & 5088.4569479471 &  &  \tabularnewline
Winsorized Mean ( 1 / 9 ) & 4635.33333333333 & 408.660918658423 & 11.3427370264582 \tabularnewline
Winsorized Mean ( 2 / 9 ) & 4634.14814814815 & 407.638752368079 & 11.3682718368339 \tabularnewline
Winsorized Mean ( 3 / 9 ) & 4627.03703703704 & 405.076875266925 & 11.422614618492 \tabularnewline
Winsorized Mean ( 4 / 9 ) & 4616.22222222222 & 401.756851716601 & 11.4900895964769 \tabularnewline
Winsorized Mean ( 5 / 9 ) & 4583.62962962963 & 395.545431595743 & 11.5881243050589 \tabularnewline
Winsorized Mean ( 6 / 9 ) & 4566.07407407407 & 386.753478782307 & 11.8061616108803 \tabularnewline
Winsorized Mean ( 7 / 9 ) & 5602.59259259259 & 54.451768021109 & 102.890921566048 \tabularnewline
Winsorized Mean ( 8 / 9 ) & 5595.18518518519 & 47.2922367949982 & 118.310859548452 \tabularnewline
Winsorized Mean ( 9 / 9 ) & 5631.85185185185 & 38.1436669290091 & 147.648412050513 \tabularnewline
Trimmed Mean ( 1 / 9 ) & 4703.28 & 410.85581217746 & 11.447519690846 \tabularnewline
Trimmed Mean ( 2 / 9 ) & 4783.04347826087 & 409.992251340356 & 11.6661801841962 \tabularnewline
Trimmed Mean ( 3 / 9 ) & 4878.7619047619 & 404.63369622155 & 12.0572308987599 \tabularnewline
Trimmed Mean ( 4 / 9 ) & 4998 & 391.619340179133 & 12.7623931895545 \tabularnewline
Trimmed Mean ( 5 / 9 ) & 5149.58823529412 & 363.10624821304 & 14.1820424755478 \tabularnewline
Trimmed Mean ( 6 / 9 ) & 5353.33333333333 & 298.534382907192 & 17.9320495053247 \tabularnewline
Trimmed Mean ( 7 / 9 ) & 5625.84615384615 & 60.9752835754012 & 92.2643704787253 \tabularnewline
Trimmed Mean ( 8 / 9 ) & 5634 & 57.4218836966598 & 98.1159035074937 \tabularnewline
Trimmed Mean ( 9 / 9 ) & 5648.55555555556 & 53.3317997464696 & 105.913462182185 \tabularnewline
Median & 5729 &  &  \tabularnewline
Midrange & 3847.5 &  &  \tabularnewline
Midmean - Weighted Average at Xnp & 5313.14285714286 &  &  \tabularnewline
Midmean - Weighted Average at X(n+1)p & 5353.33333333333 &  &  \tabularnewline
Midmean - Empirical Distribution Function & 5353.33333333333 &  &  \tabularnewline
Midmean - Empirical Distribution Function - Averaging & 5353.33333333333 &  &  \tabularnewline
Midmean - Empirical Distribution Function - Interpolation & 5625.84615384615 &  &  \tabularnewline
Midmean - Closest Observation & 5313.14285714286 &  &  \tabularnewline
Midmean - True Basic - Statistics Graphics Toolkit & 5353.33333333333 &  &  \tabularnewline
Midmean - MS Excel (old versions) & 5353.33333333333 &  &  \tabularnewline
Number of observations & 27 &  &  \tabularnewline
\hline
\end{tabular}
%Source: https://freestatistics.org/blog/index.php?pk=179261&T=1

[TABLE]
[ROW][C]Central Tendency - Ungrouped Data[/C][/ROW]
[ROW][C]Measure[/C][C]Value[/C][C]S.E.[/C][C]Value/S.E.[/C][/ROW]
[ROW][C]Arithmetic Mean[/C][C]4639.88888888889[/C][C]409.682109871908[/C][C]11.325583365941[/C][/ROW]
[ROW][C]Geometric Mean[/C][C]3838.25932696016[/C][C][/C][C][/C][/ROW]
[ROW][C]Harmonic Mean[/C][C]2840.5119826828[/C][C][/C][C][/C][/ROW]
[ROW][C]Quadratic Mean[/C][C]5088.4569479471[/C][C][/C][C][/C][/ROW]
[ROW][C]Winsorized Mean ( 1 / 9 )[/C][C]4635.33333333333[/C][C]408.660918658423[/C][C]11.3427370264582[/C][/ROW]
[ROW][C]Winsorized Mean ( 2 / 9 )[/C][C]4634.14814814815[/C][C]407.638752368079[/C][C]11.3682718368339[/C][/ROW]
[ROW][C]Winsorized Mean ( 3 / 9 )[/C][C]4627.03703703704[/C][C]405.076875266925[/C][C]11.422614618492[/C][/ROW]
[ROW][C]Winsorized Mean ( 4 / 9 )[/C][C]4616.22222222222[/C][C]401.756851716601[/C][C]11.4900895964769[/C][/ROW]
[ROW][C]Winsorized Mean ( 5 / 9 )[/C][C]4583.62962962963[/C][C]395.545431595743[/C][C]11.5881243050589[/C][/ROW]
[ROW][C]Winsorized Mean ( 6 / 9 )[/C][C]4566.07407407407[/C][C]386.753478782307[/C][C]11.8061616108803[/C][/ROW]
[ROW][C]Winsorized Mean ( 7 / 9 )[/C][C]5602.59259259259[/C][C]54.451768021109[/C][C]102.890921566048[/C][/ROW]
[ROW][C]Winsorized Mean ( 8 / 9 )[/C][C]5595.18518518519[/C][C]47.2922367949982[/C][C]118.310859548452[/C][/ROW]
[ROW][C]Winsorized Mean ( 9 / 9 )[/C][C]5631.85185185185[/C][C]38.1436669290091[/C][C]147.648412050513[/C][/ROW]
[ROW][C]Trimmed Mean ( 1 / 9 )[/C][C]4703.28[/C][C]410.85581217746[/C][C]11.447519690846[/C][/ROW]
[ROW][C]Trimmed Mean ( 2 / 9 )[/C][C]4783.04347826087[/C][C]409.992251340356[/C][C]11.6661801841962[/C][/ROW]
[ROW][C]Trimmed Mean ( 3 / 9 )[/C][C]4878.7619047619[/C][C]404.63369622155[/C][C]12.0572308987599[/C][/ROW]
[ROW][C]Trimmed Mean ( 4 / 9 )[/C][C]4998[/C][C]391.619340179133[/C][C]12.7623931895545[/C][/ROW]
[ROW][C]Trimmed Mean ( 5 / 9 )[/C][C]5149.58823529412[/C][C]363.10624821304[/C][C]14.1820424755478[/C][/ROW]
[ROW][C]Trimmed Mean ( 6 / 9 )[/C][C]5353.33333333333[/C][C]298.534382907192[/C][C]17.9320495053247[/C][/ROW]
[ROW][C]Trimmed Mean ( 7 / 9 )[/C][C]5625.84615384615[/C][C]60.9752835754012[/C][C]92.2643704787253[/C][/ROW]
[ROW][C]Trimmed Mean ( 8 / 9 )[/C][C]5634[/C][C]57.4218836966598[/C][C]98.1159035074937[/C][/ROW]
[ROW][C]Trimmed Mean ( 9 / 9 )[/C][C]5648.55555555556[/C][C]53.3317997464696[/C][C]105.913462182185[/C][/ROW]
[ROW][C]Median[/C][C]5729[/C][C][/C][C][/C][/ROW]
[ROW][C]Midrange[/C][C]3847.5[/C][C][/C][C][/C][/ROW]
[ROW][C]Midmean - Weighted Average at Xnp[/C][C]5313.14285714286[/C][C][/C][C][/C][/ROW]
[ROW][C]Midmean - Weighted Average at X(n+1)p[/C][C]5353.33333333333[/C][C][/C][C][/C][/ROW]
[ROW][C]Midmean - Empirical Distribution Function[/C][C]5353.33333333333[/C][C][/C][C][/C][/ROW]
[ROW][C]Midmean - Empirical Distribution Function - Averaging[/C][C]5353.33333333333[/C][C][/C][C][/C][/ROW]
[ROW][C]Midmean - Empirical Distribution Function - Interpolation[/C][C]5625.84615384615[/C][C][/C][C][/C][/ROW]
[ROW][C]Midmean - Closest Observation[/C][C]5313.14285714286[/C][C][/C][C][/C][/ROW]
[ROW][C]Midmean - True Basic - Statistics Graphics Toolkit[/C][C]5353.33333333333[/C][C][/C][C][/C][/ROW]
[ROW][C]Midmean - MS Excel (old versions)[/C][C]5353.33333333333[/C][C][/C][C][/C][/ROW]
[ROW][C]Number of observations[/C][C]27[/C][C][/C][C][/C][/ROW]
[/TABLE]
Source: https://freestatistics.org/blog/index.php?pk=179261&T=1

Globally Unique Identifier (entire table): ba.freestatistics.org/blog/index.php?pk=179261&T=1

As an alternative you can also use a QR Code:  

The GUIDs for individual cells are displayed in the table below:

Central Tendency - Ungrouped Data
MeasureValueS.E.Value/S.E.
Arithmetic Mean4639.88888888889409.68210987190811.325583365941
Geometric Mean3838.25932696016
Harmonic Mean2840.5119826828
Quadratic Mean5088.4569479471
Winsorized Mean ( 1 / 9 )4635.33333333333408.66091865842311.3427370264582
Winsorized Mean ( 2 / 9 )4634.14814814815407.63875236807911.3682718368339
Winsorized Mean ( 3 / 9 )4627.03703703704405.07687526692511.422614618492
Winsorized Mean ( 4 / 9 )4616.22222222222401.75685171660111.4900895964769
Winsorized Mean ( 5 / 9 )4583.62962962963395.54543159574311.5881243050589
Winsorized Mean ( 6 / 9 )4566.07407407407386.75347878230711.8061616108803
Winsorized Mean ( 7 / 9 )5602.5925925925954.451768021109102.890921566048
Winsorized Mean ( 8 / 9 )5595.1851851851947.2922367949982118.310859548452
Winsorized Mean ( 9 / 9 )5631.8518518518538.1436669290091147.648412050513
Trimmed Mean ( 1 / 9 )4703.28410.8558121774611.447519690846
Trimmed Mean ( 2 / 9 )4783.04347826087409.99225134035611.6661801841962
Trimmed Mean ( 3 / 9 )4878.7619047619404.6336962215512.0572308987599
Trimmed Mean ( 4 / 9 )4998391.61934017913312.7623931895545
Trimmed Mean ( 5 / 9 )5149.58823529412363.1062482130414.1820424755478
Trimmed Mean ( 6 / 9 )5353.33333333333298.53438290719217.9320495053247
Trimmed Mean ( 7 / 9 )5625.8461538461560.975283575401292.2643704787253
Trimmed Mean ( 8 / 9 )563457.421883696659898.1159035074937
Trimmed Mean ( 9 / 9 )5648.5555555555653.3317997464696105.913462182185
Median5729
Midrange3847.5
Midmean - Weighted Average at Xnp5313.14285714286
Midmean - Weighted Average at X(n+1)p5353.33333333333
Midmean - Empirical Distribution Function5353.33333333333
Midmean - Empirical Distribution Function - Averaging5353.33333333333
Midmean - Empirical Distribution Function - Interpolation5625.84615384615
Midmean - Closest Observation5313.14285714286
Midmean - True Basic - Statistics Graphics Toolkit5353.33333333333
Midmean - MS Excel (old versions)5353.33333333333
Number of observations27


Parameters (Session):
Parameters (R input):
R code (references can be found in the software module):
geomean <- function(x) {
return(exp(mean(log(x))))
}
harmean <- function(x) {
return(1/mean(1/x))
}
quamean <- function(x) {
return(sqrt(mean(x*x)))
}
winmean <- function(x) {
x <-sort(x[!is.na(x)])
n<-length(x)
denom <- 3
nodenom <- n/denom
if (nodenom>40) denom <- n/40
sqrtn = sqrt(n)
roundnodenom = floor(nodenom)
win <- array(NA,dim=c(roundnodenom,2))
for (j in 1:roundnodenom) {
win[j,1] <- (j*x[j+1]+sum(x[(j+1):(n-j)])+j*x[n-j])/n
win[j,2] <- sd(c(rep(x[j+1],j),x[(j+1):(n-j)],rep(x[n-j],j)))/sqrtn
}
return(win)
}
trimean <- function(x) {
x <-sort(x[!is.na(x)])
n<-length(x)
denom <- 3
nodenom <- n/denom
if (nodenom>40) denom <- n/40
sqrtn = sqrt(n)
roundnodenom = floor(nodenom)
tri <- array(NA,dim=c(roundnodenom,2))
for (j in 1:roundnodenom) {
tri[j,1] <- mean(x,trim=j/n)
tri[j,2] <- sd(x[(j+1):(n-j)]) / sqrt(n-j*2)
}
return(tri)
}
midrange <- function(x) {
return((max(x)+min(x))/2)
}
q1 <- function(data,n,p,i,f) {
np <- n*p;
i <<- floor(np)
f <<- np - i
qvalue <- (1-f)*data[i] + f*data[i+1]
}
q2 <- function(data,n,p,i,f) {
np <- (n+1)*p
i <<- floor(np)
f <<- np - i
qvalue <- (1-f)*data[i] + f*data[i+1]
}
q3 <- function(data,n,p,i,f) {
np <- n*p
i <<- floor(np)
f <<- np - i
if (f==0) {
qvalue <- data[i]
} else {
qvalue <- data[i+1]
}
}
q4 <- function(data,n,p,i,f) {
np <- n*p
i <<- floor(np)
f <<- np - i
if (f==0) {
qvalue <- (data[i]+data[i+1])/2
} else {
qvalue <- data[i+1]
}
}
q5 <- function(data,n,p,i,f) {
np <- (n-1)*p
i <<- floor(np)
f <<- np - i
if (f==0) {
qvalue <- data[i+1]
} else {
qvalue <- data[i+1] + f*(data[i+2]-data[i+1])
}
}
q6 <- function(data,n,p,i,f) {
np <- n*p+0.5
i <<- floor(np)
f <<- np - i
qvalue <- data[i]
}
q7 <- function(data,n,p,i,f) {
np <- (n+1)*p
i <<- floor(np)
f <<- np - i
if (f==0) {
qvalue <- data[i]
} else {
qvalue <- f*data[i] + (1-f)*data[i+1]
}
}
q8 <- function(data,n,p,i,f) {
np <- (n+1)*p
i <<- floor(np)
f <<- np - i
if (f==0) {
qvalue <- data[i]
} else {
if (f == 0.5) {
qvalue <- (data[i]+data[i+1])/2
} else {
if (f < 0.5) {
qvalue <- data[i]
} else {
qvalue <- data[i+1]
}
}
}
}
midmean <- function(x,def) {
x <-sort(x[!is.na(x)])
n<-length(x)
if (def==1) {
qvalue1 <- q1(x,n,0.25,i,f)
qvalue3 <- q1(x,n,0.75,i,f)
}
if (def==2) {
qvalue1 <- q2(x,n,0.25,i,f)
qvalue3 <- q2(x,n,0.75,i,f)
}
if (def==3) {
qvalue1 <- q3(x,n,0.25,i,f)
qvalue3 <- q3(x,n,0.75,i,f)
}
if (def==4) {
qvalue1 <- q4(x,n,0.25,i,f)
qvalue3 <- q4(x,n,0.75,i,f)
}
if (def==5) {
qvalue1 <- q5(x,n,0.25,i,f)
qvalue3 <- q5(x,n,0.75,i,f)
}
if (def==6) {
qvalue1 <- q6(x,n,0.25,i,f)
qvalue3 <- q6(x,n,0.75,i,f)
}
if (def==7) {
qvalue1 <- q7(x,n,0.25,i,f)
qvalue3 <- q7(x,n,0.75,i,f)
}
if (def==8) {
qvalue1 <- q8(x,n,0.25,i,f)
qvalue3 <- q8(x,n,0.75,i,f)
}
midm <- 0
myn <- 0
roundno4 <- round(n/4)
round3no4 <- round(3*n/4)
for (i in 1:n) {
if ((x[i]>=qvalue1) & (x[i]<=qvalue3)){
midm = midm + x[i]
myn = myn + 1
}
}
midm = midm / myn
return(midm)
}
(arm <- mean(x))
sqrtn <- sqrt(length(x))
(armse <- sd(x) / sqrtn)
(armose <- arm / armse)
(geo <- geomean(x))
(har <- harmean(x))
(qua <- quamean(x))
(win <- winmean(x))
(tri <- trimean(x))
(midr <- midrange(x))
midm <- array(NA,dim=8)
for (j in 1:8) midm[j] <- midmean(x,j)
midm
bitmap(file='test1.png')
lb <- win[,1] - 2*win[,2]
ub <- win[,1] + 2*win[,2]
if ((ylimmin == '') | (ylimmax == '')) plot(win[,1],type='b',main=main, xlab='j', pch=19, ylab='Winsorized Mean(j/n)', ylim=c(min(lb),max(ub))) else plot(win[,1],type='l',main=main, xlab='j', pch=19, ylab='Winsorized Mean(j/n)', ylim=c(ylimmin,ylimmax))
lines(ub,lty=3)
lines(lb,lty=3)
grid()
dev.off()
bitmap(file='test2.png')
lb <- tri[,1] - 2*tri[,2]
ub <- tri[,1] + 2*tri[,2]
if ((ylimmin == '') | (ylimmax == '')) plot(tri[,1],type='b',main=main, xlab='j', pch=19, ylab='Trimmed Mean(j/n)', ylim=c(min(lb),max(ub))) else plot(tri[,1],type='l',main=main, xlab='j', pch=19, ylab='Trimmed Mean(j/n)', ylim=c(ylimmin,ylimmax))
lines(ub,lty=3)
lines(lb,lty=3)
grid()
dev.off()
load(file='createtable')
a<-table.start()
a<-table.row.start(a)
a<-table.element(a,'Central Tendency - Ungrouped Data',4,TRUE)
a<-table.row.end(a)
a<-table.row.start(a)
a<-table.element(a,'Measure',header=TRUE)
a<-table.element(a,'Value',header=TRUE)
a<-table.element(a,'S.E.',header=TRUE)
a<-table.element(a,'Value/S.E.',header=TRUE)
a<-table.row.end(a)
a<-table.row.start(a)
a<-table.element(a,hyperlink('arithmetic_mean.htm', 'Arithmetic Mean', 'click to view the definition of the Arithmetic Mean'),header=TRUE)
a<-table.element(a,arm)
a<-table.element(a,hyperlink('arithmetic_mean_standard_error.htm', armse, 'click to view the definition of the Standard Error of the Arithmetic Mean'))
a<-table.element(a,armose)
a<-table.row.end(a)
a<-table.row.start(a)
a<-table.element(a,hyperlink('geometric_mean.htm', 'Geometric Mean', 'click to view the definition of the Geometric Mean'),header=TRUE)
a<-table.element(a,geo)
a<-table.element(a,'')
a<-table.row.end(a)
a<-table.row.start(a)
a<-table.element(a,hyperlink('harmonic_mean.htm', 'Harmonic Mean', 'click to view the definition of the Harmonic Mean'),header=TRUE)
a<-table.element(a,har)
a<-table.element(a,'')
a<-table.row.end(a)
a<-table.row.start(a)
a<-table.element(a,hyperlink('quadratic_mean.htm', 'Quadratic Mean', 'click to view the definition of the Quadratic Mean'),header=TRUE)
a<-table.element(a,qua)
a<-table.element(a,'')
a<-table.row.end(a)
for (j in 1:length(win[,1])) {
a<-table.row.start(a)
mylabel <- paste('Winsorized Mean (',j)
mylabel <- paste(mylabel,'/')
mylabel <- paste(mylabel,length(win[,1]))
mylabel <- paste(mylabel,')')
a<-table.element(a,hyperlink('winsorized_mean.htm', mylabel, 'click to view the definition of the Winsorized Mean'),header=TRUE)
a<-table.element(a,win[j,1])
a<-table.element(a,win[j,2])
a<-table.element(a,win[j,1]/win[j,2])
a<-table.row.end(a)
}
for (j in 1:length(tri[,1])) {
a<-table.row.start(a)
mylabel <- paste('Trimmed Mean (',j)
mylabel <- paste(mylabel,'/')
mylabel <- paste(mylabel,length(tri[,1]))
mylabel <- paste(mylabel,')')
a<-table.element(a,hyperlink('arithmetic_mean.htm', mylabel, 'click to view the definition of the Trimmed Mean'),header=TRUE)
a<-table.element(a,tri[j,1])
a<-table.element(a,tri[j,2])
a<-table.element(a,tri[j,1]/tri[j,2])
a<-table.row.end(a)
}
a<-table.row.start(a)
a<-table.element(a,hyperlink('median_1.htm', 'Median', 'click to view the definition of the Median'),header=TRUE)
a<-table.element(a,median(x))
a<-table.element(a,'')
a<-table.row.end(a)
a<-table.row.start(a)
a<-table.element(a,hyperlink('midrange.htm', 'Midrange', 'click to view the definition of the Midrange'),header=TRUE)
a<-table.element(a,midr)
a<-table.element(a,'')
a<-table.row.end(a)
a<-table.row.start(a)
mymid <- hyperlink('midmean.htm', 'Midmean', 'click to view the definition of the Midmean')
mylabel <- paste(mymid,hyperlink('method_1.htm','Weighted Average at Xnp',''),sep=' - ')
a<-table.element(a,mylabel,header=TRUE)
a<-table.element(a,midm[1])
a<-table.element(a,'')
a<-table.row.end(a)
a<-table.row.start(a)
mymid <- hyperlink('midmean.htm', 'Midmean', 'click to view the definition of the Midmean')
mylabel <- paste(mymid,hyperlink('method_2.htm','Weighted Average at X(n+1)p',''),sep=' - ')
a<-table.element(a,mylabel,header=TRUE)
a<-table.element(a,midm[2])
a<-table.element(a,'')
a<-table.row.end(a)
a<-table.row.start(a)
mymid <- hyperlink('midmean.htm', 'Midmean', 'click to view the definition of the Midmean')
mylabel <- paste(mymid,hyperlink('method_3.htm','Empirical Distribution Function',''),sep=' - ')
a<-table.element(a,mylabel,header=TRUE)
a<-table.element(a,midm[3])
a<-table.element(a,'')
a<-table.row.end(a)
a<-table.row.start(a)
mymid <- hyperlink('midmean.htm', 'Midmean', 'click to view the definition of the Midmean')
mylabel <- paste(mymid,hyperlink('method_4.htm','Empirical Distribution Function - Averaging',''),sep=' - ')
a<-table.element(a,mylabel,header=TRUE)
a<-table.element(a,midm[4])
a<-table.element(a,'')
a<-table.row.end(a)
a<-table.row.start(a)
mymid <- hyperlink('midmean.htm', 'Midmean', 'click to view the definition of the Midmean')
mylabel <- paste(mymid,hyperlink('method_5.htm','Empirical Distribution Function - Interpolation',''),sep=' - ')
a<-table.element(a,mylabel,header=TRUE)
a<-table.element(a,midm[5])
a<-table.element(a,'')
a<-table.row.end(a)
a<-table.row.start(a)
mymid <- hyperlink('midmean.htm', 'Midmean', 'click to view the definition of the Midmean')
mylabel <- paste(mymid,hyperlink('method_6.htm','Closest Observation',''),sep=' - ')
a<-table.element(a,mylabel,header=TRUE)
a<-table.element(a,midm[6])
a<-table.element(a,'')
a<-table.row.end(a)
a<-table.row.start(a)
mymid <- hyperlink('midmean.htm', 'Midmean', 'click to view the definition of the Midmean')
mylabel <- paste(mymid,hyperlink('method_7.htm','True Basic - Statistics Graphics Toolkit',''),sep=' - ')
a<-table.element(a,mylabel,header=TRUE)
a<-table.element(a,midm[7])
a<-table.element(a,'')
a<-table.row.end(a)
a<-table.row.start(a)
mymid <- hyperlink('midmean.htm', 'Midmean', 'click to view the definition of the Midmean')
mylabel <- paste(mymid,hyperlink('method_8.htm','MS Excel (old versions)',''),sep=' - ')
a<-table.element(a,mylabel,header=TRUE)
a<-table.element(a,midm[8])
a<-table.element(a,'')
a<-table.row.end(a)
a<-table.row.start(a)
a<-table.element(a,'Number of observations',header=TRUE)
a<-table.element(a,length(x))
a<-table.element(a,'')
a<-table.row.end(a)
a<-table.end(a)
table.save(a,file='mytable.tab')