\begin{tabular}{lllllllll}
\hline
Summary of computational transaction \tabularnewline
Raw Input & view raw input (R code)  \tabularnewline
Raw Output & view raw output of R engine  \tabularnewline
Computing time & 1 seconds \tabularnewline
R Server & 'Gwilym Jenkins' @ jenkins.wessa.net \tabularnewline
\hline
\end{tabular}
%Source: https://freestatistics.org/blog/index.php?pk=175169&T=0
[TABLE]
[ROW][C]Summary of computational transaction[/C][/ROW]
[ROW][C]Raw Input[/C][C]view raw input (R code) [/C][/ROW]
[ROW][C]Raw Output[/C][C]view raw output of R engine [/C][/ROW]
[ROW][C]Computing time[/C][C]1 seconds[/C][/ROW]
[ROW][C]R Server[/C][C]'Gwilym Jenkins' @ jenkins.wessa.net[/C][/ROW]
[/TABLE]
Source: https://freestatistics.org/blog/index.php?pk=175169&T=0
If you paste this QR Code into your document, anyone with a smartphone or tablet will be able to scan it and view this table in a browser.
If you paste this QR Code into your document, anyone with a smartphone or tablet will be able to scan it and view this table in a browser.
If you paste this QR Code into your document, anyone with a smartphone or tablet will be able to scan it and view this table in a browser.
If you paste this QR Code into your document, anyone with a smartphone or tablet will be able to scan it and view this table in a browser.
If you paste this QR Code into your document, anyone with a smartphone or tablet will be able to scan it and view this table in a browser.
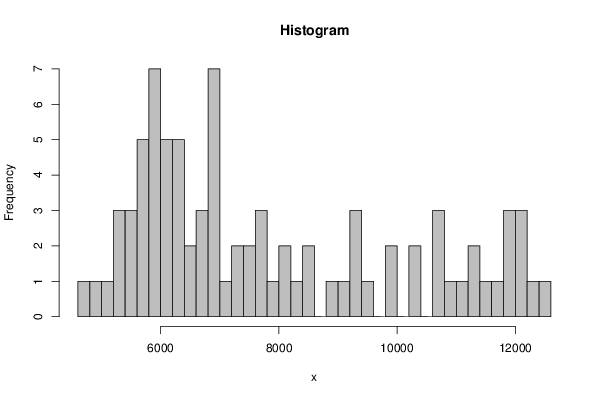
| Frequency Table (Histogram) | | Bins | Midpoint | Abs. Frequency | Rel. Frequency | Cumul. Rel. Freq. | Density | | [4600,4800[ | 4700 | 1 | 0.011905 | 0.011905 | 6e-05 | | [4800,5000[ | 4900 | 1 | 0.011905 | 0.02381 | 6e-05 | | [5000,5200[ | 5100 | 1 | 0.011905 | 0.035714 | 6e-05 | | [5200,5400[ | 5300 | 3 | 0.035714 | 0.071429 | 0.000179 | | [5400,5600[ | 5500 | 3 | 0.035714 | 0.107143 | 0.000179 | | [5600,5800[ | 5700 | 5 | 0.059524 | 0.166667 | 0.000298 | | [5800,6000[ | 5900 | 7 | 0.083333 | 0.25 | 0.000417 | | [6000,6200[ | 6100 | 5 | 0.059524 | 0.309524 | 0.000298 | | [6200,6400[ | 6300 | 5 | 0.059524 | 0.369048 | 0.000298 | | [6400,6600[ | 6500 | 2 | 0.02381 | 0.392857 | 0.000119 | | [6600,6800[ | 6700 | 3 | 0.035714 | 0.428571 | 0.000179 | | [6800,7000[ | 6900 | 7 | 0.083333 | 0.511905 | 0.000417 | | [7000,7200[ | 7100 | 1 | 0.011905 | 0.52381 | 6e-05 | | [7200,7400[ | 7300 | 2 | 0.02381 | 0.547619 | 0.000119 | | [7400,7600[ | 7500 | 2 | 0.02381 | 0.571429 | 0.000119 | | [7600,7800[ | 7700 | 3 | 0.035714 | 0.607143 | 0.000179 | | [7800,8000[ | 7900 | 1 | 0.011905 | 0.619048 | 6e-05 | | [8000,8200[ | 8100 | 2 | 0.02381 | 0.642857 | 0.000119 | | [8200,8400[ | 8300 | 1 | 0.011905 | 0.654762 | 6e-05 | | [8400,8600[ | 8500 | 2 | 0.02381 | 0.678571 | 0.000119 | | [8600,8800[ | 8700 | 0 | 0 | 0.678571 | 0 | | [8800,9000[ | 8900 | 1 | 0.011905 | 0.690476 | 6e-05 | | [9000,9200[ | 9100 | 1 | 0.011905 | 0.702381 | 6e-05 | | [9200,9400[ | 9300 | 3 | 0.035714 | 0.738095 | 0.000179 | | [9400,9600[ | 9500 | 1 | 0.011905 | 0.75 | 6e-05 | | [9600,9800[ | 9700 | 0 | 0 | 0.75 | 0 | | [9800,10000[ | 9900 | 2 | 0.02381 | 0.77381 | 0.000119 | | [10000,10200[ | 10100 | 0 | 0 | 0.77381 | 0 | | [10200,10400[ | 10300 | 2 | 0.02381 | 0.797619 | 0.000119 | | [10400,10600[ | 10500 | 0 | 0 | 0.797619 | 0 | | [10600,10800[ | 10700 | 3 | 0.035714 | 0.833333 | 0.000179 | | [10800,11000[ | 10900 | 1 | 0.011905 | 0.845238 | 6e-05 | | [11000,11200[ | 11100 | 1 | 0.011905 | 0.857143 | 6e-05 | | [11200,11400[ | 11300 | 2 | 0.02381 | 0.880952 | 0.000119 | | [11400,11600[ | 11500 | 1 | 0.011905 | 0.892857 | 6e-05 | | [11600,11800[ | 11700 | 1 | 0.011905 | 0.904762 | 6e-05 | | [11800,12000[ | 11900 | 3 | 0.035714 | 0.940476 | 0.000179 | | [12000,12200[ | 12100 | 3 | 0.035714 | 0.97619 | 0.000179 | | [12200,12400[ | 12300 | 1 | 0.011905 | 0.988095 | 6e-05 | | [12400,12600] | 12500 | 1 | 0.011905 | 1 | 6e-05 |
\begin{tabular}{lllllllll}
\hline
Frequency Table (Histogram) \tabularnewline
Bins & Midpoint & Abs. Frequency & Rel. Frequency & Cumul. Rel. Freq. & Density \tabularnewline
[4600,4800[ & 4700 & 1 & 0.011905 & 0.011905 & 6e-05 \tabularnewline
[4800,5000[ & 4900 & 1 & 0.011905 & 0.02381 & 6e-05 \tabularnewline
[5000,5200[ & 5100 & 1 & 0.011905 & 0.035714 & 6e-05 \tabularnewline
[5200,5400[ & 5300 & 3 & 0.035714 & 0.071429 & 0.000179 \tabularnewline
[5400,5600[ & 5500 & 3 & 0.035714 & 0.107143 & 0.000179 \tabularnewline
[5600,5800[ & 5700 & 5 & 0.059524 & 0.166667 & 0.000298 \tabularnewline
[5800,6000[ & 5900 & 7 & 0.083333 & 0.25 & 0.000417 \tabularnewline
[6000,6200[ & 6100 & 5 & 0.059524 & 0.309524 & 0.000298 \tabularnewline
[6200,6400[ & 6300 & 5 & 0.059524 & 0.369048 & 0.000298 \tabularnewline
[6400,6600[ & 6500 & 2 & 0.02381 & 0.392857 & 0.000119 \tabularnewline
[6600,6800[ & 6700 & 3 & 0.035714 & 0.428571 & 0.000179 \tabularnewline
[6800,7000[ & 6900 & 7 & 0.083333 & 0.511905 & 0.000417 \tabularnewline
[7000,7200[ & 7100 & 1 & 0.011905 & 0.52381 & 6e-05 \tabularnewline
[7200,7400[ & 7300 & 2 & 0.02381 & 0.547619 & 0.000119 \tabularnewline
[7400,7600[ & 7500 & 2 & 0.02381 & 0.571429 & 0.000119 \tabularnewline
[7600,7800[ & 7700 & 3 & 0.035714 & 0.607143 & 0.000179 \tabularnewline
[7800,8000[ & 7900 & 1 & 0.011905 & 0.619048 & 6e-05 \tabularnewline
[8000,8200[ & 8100 & 2 & 0.02381 & 0.642857 & 0.000119 \tabularnewline
[8200,8400[ & 8300 & 1 & 0.011905 & 0.654762 & 6e-05 \tabularnewline
[8400,8600[ & 8500 & 2 & 0.02381 & 0.678571 & 0.000119 \tabularnewline
[8600,8800[ & 8700 & 0 & 0 & 0.678571 & 0 \tabularnewline
[8800,9000[ & 8900 & 1 & 0.011905 & 0.690476 & 6e-05 \tabularnewline
[9000,9200[ & 9100 & 1 & 0.011905 & 0.702381 & 6e-05 \tabularnewline
[9200,9400[ & 9300 & 3 & 0.035714 & 0.738095 & 0.000179 \tabularnewline
[9400,9600[ & 9500 & 1 & 0.011905 & 0.75 & 6e-05 \tabularnewline
[9600,9800[ & 9700 & 0 & 0 & 0.75 & 0 \tabularnewline
[9800,10000[ & 9900 & 2 & 0.02381 & 0.77381 & 0.000119 \tabularnewline
[10000,10200[ & 10100 & 0 & 0 & 0.77381 & 0 \tabularnewline
[10200,10400[ & 10300 & 2 & 0.02381 & 0.797619 & 0.000119 \tabularnewline
[10400,10600[ & 10500 & 0 & 0 & 0.797619 & 0 \tabularnewline
[10600,10800[ & 10700 & 3 & 0.035714 & 0.833333 & 0.000179 \tabularnewline
[10800,11000[ & 10900 & 1 & 0.011905 & 0.845238 & 6e-05 \tabularnewline
[11000,11200[ & 11100 & 1 & 0.011905 & 0.857143 & 6e-05 \tabularnewline
[11200,11400[ & 11300 & 2 & 0.02381 & 0.880952 & 0.000119 \tabularnewline
[11400,11600[ & 11500 & 1 & 0.011905 & 0.892857 & 6e-05 \tabularnewline
[11600,11800[ & 11700 & 1 & 0.011905 & 0.904762 & 6e-05 \tabularnewline
[11800,12000[ & 11900 & 3 & 0.035714 & 0.940476 & 0.000179 \tabularnewline
[12000,12200[ & 12100 & 3 & 0.035714 & 0.97619 & 0.000179 \tabularnewline
[12200,12400[ & 12300 & 1 & 0.011905 & 0.988095 & 6e-05 \tabularnewline
[12400,12600] & 12500 & 1 & 0.011905 & 1 & 6e-05 \tabularnewline
\hline
\end{tabular}
%Source: https://freestatistics.org/blog/index.php?pk=175169&T=1
[TABLE]
[ROW][C]Frequency Table (Histogram)[/C][/ROW]
[ROW][C]Bins[/C][C]Midpoint[/C][C]Abs. Frequency[/C][C]Rel. Frequency[/C][C]Cumul. Rel. Freq.[/C][C]Density[/C][/ROW]
[ROW][C][4600,4800[[/C][C]4700[/C][C]1[/C][C]0.011905[/C][C]0.011905[/C][C]6e-05[/C][/ROW]
[ROW][C][4800,5000[[/C][C]4900[/C][C]1[/C][C]0.011905[/C][C]0.02381[/C][C]6e-05[/C][/ROW]
[ROW][C][5000,5200[[/C][C]5100[/C][C]1[/C][C]0.011905[/C][C]0.035714[/C][C]6e-05[/C][/ROW]
[ROW][C][5200,5400[[/C][C]5300[/C][C]3[/C][C]0.035714[/C][C]0.071429[/C][C]0.000179[/C][/ROW]
[ROW][C][5400,5600[[/C][C]5500[/C][C]3[/C][C]0.035714[/C][C]0.107143[/C][C]0.000179[/C][/ROW]
[ROW][C][5600,5800[[/C][C]5700[/C][C]5[/C][C]0.059524[/C][C]0.166667[/C][C]0.000298[/C][/ROW]
[ROW][C][5800,6000[[/C][C]5900[/C][C]7[/C][C]0.083333[/C][C]0.25[/C][C]0.000417[/C][/ROW]
[ROW][C][6000,6200[[/C][C]6100[/C][C]5[/C][C]0.059524[/C][C]0.309524[/C][C]0.000298[/C][/ROW]
[ROW][C][6200,6400[[/C][C]6300[/C][C]5[/C][C]0.059524[/C][C]0.369048[/C][C]0.000298[/C][/ROW]
[ROW][C][6400,6600[[/C][C]6500[/C][C]2[/C][C]0.02381[/C][C]0.392857[/C][C]0.000119[/C][/ROW]
[ROW][C][6600,6800[[/C][C]6700[/C][C]3[/C][C]0.035714[/C][C]0.428571[/C][C]0.000179[/C][/ROW]
[ROW][C][6800,7000[[/C][C]6900[/C][C]7[/C][C]0.083333[/C][C]0.511905[/C][C]0.000417[/C][/ROW]
[ROW][C][7000,7200[[/C][C]7100[/C][C]1[/C][C]0.011905[/C][C]0.52381[/C][C]6e-05[/C][/ROW]
[ROW][C][7200,7400[[/C][C]7300[/C][C]2[/C][C]0.02381[/C][C]0.547619[/C][C]0.000119[/C][/ROW]
[ROW][C][7400,7600[[/C][C]7500[/C][C]2[/C][C]0.02381[/C][C]0.571429[/C][C]0.000119[/C][/ROW]
[ROW][C][7600,7800[[/C][C]7700[/C][C]3[/C][C]0.035714[/C][C]0.607143[/C][C]0.000179[/C][/ROW]
[ROW][C][7800,8000[[/C][C]7900[/C][C]1[/C][C]0.011905[/C][C]0.619048[/C][C]6e-05[/C][/ROW]
[ROW][C][8000,8200[[/C][C]8100[/C][C]2[/C][C]0.02381[/C][C]0.642857[/C][C]0.000119[/C][/ROW]
[ROW][C][8200,8400[[/C][C]8300[/C][C]1[/C][C]0.011905[/C][C]0.654762[/C][C]6e-05[/C][/ROW]
[ROW][C][8400,8600[[/C][C]8500[/C][C]2[/C][C]0.02381[/C][C]0.678571[/C][C]0.000119[/C][/ROW]
[ROW][C][8600,8800[[/C][C]8700[/C][C]0[/C][C]0[/C][C]0.678571[/C][C]0[/C][/ROW]
[ROW][C][8800,9000[[/C][C]8900[/C][C]1[/C][C]0.011905[/C][C]0.690476[/C][C]6e-05[/C][/ROW]
[ROW][C][9000,9200[[/C][C]9100[/C][C]1[/C][C]0.011905[/C][C]0.702381[/C][C]6e-05[/C][/ROW]
[ROW][C][9200,9400[[/C][C]9300[/C][C]3[/C][C]0.035714[/C][C]0.738095[/C][C]0.000179[/C][/ROW]
[ROW][C][9400,9600[[/C][C]9500[/C][C]1[/C][C]0.011905[/C][C]0.75[/C][C]6e-05[/C][/ROW]
[ROW][C][9600,9800[[/C][C]9700[/C][C]0[/C][C]0[/C][C]0.75[/C][C]0[/C][/ROW]
[ROW][C][9800,10000[[/C][C]9900[/C][C]2[/C][C]0.02381[/C][C]0.77381[/C][C]0.000119[/C][/ROW]
[ROW][C][10000,10200[[/C][C]10100[/C][C]0[/C][C]0[/C][C]0.77381[/C][C]0[/C][/ROW]
[ROW][C][10200,10400[[/C][C]10300[/C][C]2[/C][C]0.02381[/C][C]0.797619[/C][C]0.000119[/C][/ROW]
[ROW][C][10400,10600[[/C][C]10500[/C][C]0[/C][C]0[/C][C]0.797619[/C][C]0[/C][/ROW]
[ROW][C][10600,10800[[/C][C]10700[/C][C]3[/C][C]0.035714[/C][C]0.833333[/C][C]0.000179[/C][/ROW]
[ROW][C][10800,11000[[/C][C]10900[/C][C]1[/C][C]0.011905[/C][C]0.845238[/C][C]6e-05[/C][/ROW]
[ROW][C][11000,11200[[/C][C]11100[/C][C]1[/C][C]0.011905[/C][C]0.857143[/C][C]6e-05[/C][/ROW]
[ROW][C][11200,11400[[/C][C]11300[/C][C]2[/C][C]0.02381[/C][C]0.880952[/C][C]0.000119[/C][/ROW]
[ROW][C][11400,11600[[/C][C]11500[/C][C]1[/C][C]0.011905[/C][C]0.892857[/C][C]6e-05[/C][/ROW]
[ROW][C][11600,11800[[/C][C]11700[/C][C]1[/C][C]0.011905[/C][C]0.904762[/C][C]6e-05[/C][/ROW]
[ROW][C][11800,12000[[/C][C]11900[/C][C]3[/C][C]0.035714[/C][C]0.940476[/C][C]0.000179[/C][/ROW]
[ROW][C][12000,12200[[/C][C]12100[/C][C]3[/C][C]0.035714[/C][C]0.97619[/C][C]0.000179[/C][/ROW]
[ROW][C][12200,12400[[/C][C]12300[/C][C]1[/C][C]0.011905[/C][C]0.988095[/C][C]6e-05[/C][/ROW]
[ROW][C][12400,12600][/C][C]12500[/C][C]1[/C][C]0.011905[/C][C]1[/C][C]6e-05[/C][/ROW]
[/TABLE]
Source: https://freestatistics.org/blog/index.php?pk=175169&T=1
Globally Unique Identifier (entire table): ba.freestatistics.org/blog/index.php?pk=175169&T=1
As an alternative you can also use a QR Code:
The GUIDs for individual cells are displayed in the table below:
| Frequency Table (Histogram) | | Bins | Midpoint | Abs. Frequency | Rel. Frequency | Cumul. Rel. Freq. | Density | | [4600,4800[ | 4700 | 1 | 0.011905 | 0.011905 | 6e-05 | | [4800,5000[ | 4900 | 1 | 0.011905 | 0.02381 | 6e-05 | | [5000,5200[ | 5100 | 1 | 0.011905 | 0.035714 | 6e-05 | | [5200,5400[ | 5300 | 3 | 0.035714 | 0.071429 | 0.000179 | | [5400,5600[ | 5500 | 3 | 0.035714 | 0.107143 | 0.000179 | | [5600,5800[ | 5700 | 5 | 0.059524 | 0.166667 | 0.000298 | | [5800,6000[ | 5900 | 7 | 0.083333 | 0.25 | 0.000417 | | [6000,6200[ | 6100 | 5 | 0.059524 | 0.309524 | 0.000298 | | [6200,6400[ | 6300 | 5 | 0.059524 | 0.369048 | 0.000298 | | [6400,6600[ | 6500 | 2 | 0.02381 | 0.392857 | 0.000119 | | [6600,6800[ | 6700 | 3 | 0.035714 | 0.428571 | 0.000179 | | [6800,7000[ | 6900 | 7 | 0.083333 | 0.511905 | 0.000417 | | [7000,7200[ | 7100 | 1 | 0.011905 | 0.52381 | 6e-05 | | [7200,7400[ | 7300 | 2 | 0.02381 | 0.547619 | 0.000119 | | [7400,7600[ | 7500 | 2 | 0.02381 | 0.571429 | 0.000119 | | [7600,7800[ | 7700 | 3 | 0.035714 | 0.607143 | 0.000179 | | [7800,8000[ | 7900 | 1 | 0.011905 | 0.619048 | 6e-05 | | [8000,8200[ | 8100 | 2 | 0.02381 | 0.642857 | 0.000119 | | [8200,8400[ | 8300 | 1 | 0.011905 | 0.654762 | 6e-05 | | [8400,8600[ | 8500 | 2 | 0.02381 | 0.678571 | 0.000119 | | [8600,8800[ | 8700 | 0 | 0 | 0.678571 | 0 | | [8800,9000[ | 8900 | 1 | 0.011905 | 0.690476 | 6e-05 | | [9000,9200[ | 9100 | 1 | 0.011905 | 0.702381 | 6e-05 | | [9200,9400[ | 9300 | 3 | 0.035714 | 0.738095 | 0.000179 | | [9400,9600[ | 9500 | 1 | 0.011905 | 0.75 | 6e-05 | | [9600,9800[ | 9700 | 0 | 0 | 0.75 | 0 | | [9800,10000[ | 9900 | 2 | 0.02381 | 0.77381 | 0.000119 | | [10000,10200[ | 10100 | 0 | 0 | 0.77381 | 0 | | [10200,10400[ | 10300 | 2 | 0.02381 | 0.797619 | 0.000119 | | [10400,10600[ | 10500 | 0 | 0 | 0.797619 | 0 | | [10600,10800[ | 10700 | 3 | 0.035714 | 0.833333 | 0.000179 | | [10800,11000[ | 10900 | 1 | 0.011905 | 0.845238 | 6e-05 | | [11000,11200[ | 11100 | 1 | 0.011905 | 0.857143 | 6e-05 | | [11200,11400[ | 11300 | 2 | 0.02381 | 0.880952 | 0.000119 | | [11400,11600[ | 11500 | 1 | 0.011905 | 0.892857 | 6e-05 | | [11600,11800[ | 11700 | 1 | 0.011905 | 0.904762 | 6e-05 | | [11800,12000[ | 11900 | 3 | 0.035714 | 0.940476 | 0.000179 | | [12000,12200[ | 12100 | 3 | 0.035714 | 0.97619 | 0.000179 | | [12200,12400[ | 12300 | 1 | 0.011905 | 0.988095 | 6e-05 | | [12400,12600] | 12500 | 1 | 0.011905 | 1 | 6e-05 |
If you paste this QR Code into your document, anyone with a smartphone or tablet will be able to scan it and view this table in a browser.
If you paste this QR Code into your document, anyone with a smartphone or tablet will be able to scan it and view this table in a browser.
If you paste this QR Code into your document, anyone with a smartphone or tablet will be able to scan it and view this table in a browser.
If you paste this QR Code into your document, anyone with a smartphone or tablet will be able to scan it and view this table in a browser.
If you paste this QR Code into your document, anyone with a smartphone or tablet will be able to scan it and view this table in a browser.
|