Free Statistics

of Irreproducible Research!

Author's title

Author*The author of this computation has been verified*
R Software Modulerwasp_autocorrelation.wasp
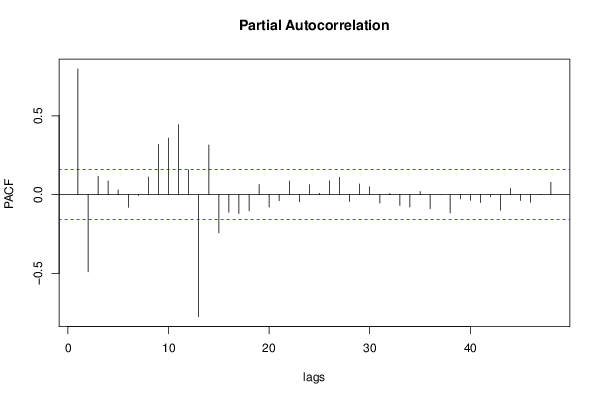
Title produced by software(Partial) Autocorrelation Function
Date of computationFri, 30 Nov 2012 09:05:17 -0500
Cite this page as followsStatistical Computations at FreeStatistics.org, Office for Research Development and Education, URL https://freestatistics.org/blog/index.php?v=date/2012/Nov/30/t1354284335n5i97x3d6btp2l1.htm/, Retrieved Fri, 03 May 2024 15:37:35 +0000
Statistical Computations at FreeStatistics.org, Office for Research Development and Education, URL https://freestatistics.org/blog/index.php?pk=195048, Retrieved Fri, 03 May 2024 15:37:35 +0000
QR Codes:

Original text written by user:
IsPrivate?No (this computation is public)
User-defined keywords
Estimated Impact78
Family? (F = Feedback message, R = changed R code, M = changed R Module, P = changed Parameters, D = changed Data)
-     [Univariate Data Series] [data set] [2008-12-01 19:54:57] [b98453cac15ba1066b407e146608df68]
- RMP   [(Partial) Autocorrelation Function] [Unemployment] [2010-11-29 09:09:37] [b98453cac15ba1066b407e146608df68]
- R  D    [(Partial) Autocorrelation Function] [Aantal werklozen ...] [2012-11-30 10:24:51] [3e2c7966ca4198d187b4c59e4eb5d004]
-   P         [(Partial) Autocorrelation Function] [Aantal werklozen ...] [2012-11-30 14:05:17] [7ac586d7aaad1f98cbd1d1bd98b37cf0] [Current]
Feedback Forum

Post a new message
Dataseries X:
116
111
104
100
93
91
119
139
134
124
113
109
109
106
101
98
93
91
122
139
140
132
117
114
113
110
107
103
98
98
137
148
147
139
130
128
127
123
118
114
108
111
151
159
158
148
138
137
136
133
126
120
114
116
153
162
161
149
139
135
130
127
122
117
112
113
149
157
157
147
137
132
125
123
117
114
111
112
144
150
149
134
123
116
117
111
105
102
95
93
124
130
124
115
106
105
105
101
95
93
84
87
116
120
117
109
105
107
109
109
108
107
99
103
131
137
135
124
118
121
121
118
113
107
100
102
130
136
133
120
112
109
110
106
102
98
92
92
120
127
124
114
108
106
111
110
104
100
96
98
122
134
133


Summary of computational transaction
Raw Inputview raw input (R code)
Raw Outputview raw output of R engine
Computing time3 seconds
R Server'Herman Ole Andreas Wold' @ wold.wessa.net

\begin{tabular}{lllllllll}
\hline
Summary of computational transaction \tabularnewline
Raw Input & view raw input (R code)  \tabularnewline
Raw Output & view raw output of R engine  \tabularnewline
Computing time & 3 seconds \tabularnewline
R Server & 'Herman Ole Andreas Wold' @ wold.wessa.net \tabularnewline
\hline
\end{tabular}
%Source: https://freestatistics.org/blog/index.php?pk=195048&T=0

[TABLE]
[ROW][C]Summary of computational transaction[/C][/ROW]
[ROW][C]Raw Input[/C][C]view raw input (R code) [/C][/ROW]
[ROW][C]Raw Output[/C][C]view raw output of R engine [/C][/ROW]
[ROW][C]Computing time[/C][C]3 seconds[/C][/ROW]
[ROW][C]R Server[/C][C]'Herman Ole Andreas Wold' @ wold.wessa.net[/C][/ROW]
[/TABLE]
Source: https://freestatistics.org/blog/index.php?pk=195048&T=0

Globally Unique Identifier (entire table): ba.freestatistics.org/blog/index.php?pk=195048&T=0

As an alternative you can also use a QR Code:  

The GUIDs for individual cells are displayed in the table below:

Summary of computational transaction
Raw Inputview raw input (R code)
Raw Outputview raw output of R engine
Computing time3 seconds
R Server'Herman Ole Andreas Wold' @ wold.wessa.net


Autocorrelation Function
Time lag kACF(k)T-STATP-value
10.7978259.86860
20.4588025.67510
30.1870542.31370.011007
40.0614050.75950.224349
50.0496450.61410.270038
60.0557030.6890.245929
70.0366550.45340.325452
80.0306650.37930.352494
90.1319571.63220.052345
100.3634874.49617e-06
110.6540168.08970
120.81239310.04870
130.6054437.48890
140.2805943.47080.000337
150.0175880.21750.414035
16-0.106666-1.31940.094506
17-0.126777-1.56810.059456
18-0.131102-1.62160.05347
19-0.152309-1.8840.030734
20-0.157292-1.94560.026768
21-0.060853-0.75270.226389
220.1548791.91580.028631
230.4221565.22180
240.5618946.95020
250.3715794.59624e-06
260.0828941.02530.153409
27-0.144548-1.7880.03788
28-0.243109-3.00710.001542
29-0.25135-3.1090.001119
30-0.247673-3.06360.001293
31-0.258472-3.19710.000843
32-0.254795-3.15160.000977
33-0.15792-1.95340.0263
340.0435480.53870.295452
350.2902783.59050.000222
360.4165435.15240
370.2460883.04390.001375
38-0.010664-0.13190.447614
39-0.210361-2.6020.005089
40-0.292841-3.62220.000198
41-0.297029-3.6740.000165
42-0.291694-3.60810.000209
43-0.302115-3.7370.000131
44-0.298717-3.69490.000153
45-0.209768-2.59470.005194
46-0.029556-0.36560.357589
470.1896372.34570.010138
480.3012053.72570.000137

\begin{tabular}{lllllllll}
\hline
Autocorrelation Function \tabularnewline
Time lag k & ACF(k) & T-STAT & P-value \tabularnewline
1 & 0.797825 & 9.8686 & 0 \tabularnewline
2 & 0.458802 & 5.6751 & 0 \tabularnewline
3 & 0.187054 & 2.3137 & 0.011007 \tabularnewline
4 & 0.061405 & 0.7595 & 0.224349 \tabularnewline
5 & 0.049645 & 0.6141 & 0.270038 \tabularnewline
6 & 0.055703 & 0.689 & 0.245929 \tabularnewline
7 & 0.036655 & 0.4534 & 0.325452 \tabularnewline
8 & 0.030665 & 0.3793 & 0.352494 \tabularnewline
9 & 0.131957 & 1.6322 & 0.052345 \tabularnewline
10 & 0.363487 & 4.4961 & 7e-06 \tabularnewline
11 & 0.654016 & 8.0897 & 0 \tabularnewline
12 & 0.812393 & 10.0487 & 0 \tabularnewline
13 & 0.605443 & 7.4889 & 0 \tabularnewline
14 & 0.280594 & 3.4708 & 0.000337 \tabularnewline
15 & 0.017588 & 0.2175 & 0.414035 \tabularnewline
16 & -0.106666 & -1.3194 & 0.094506 \tabularnewline
17 & -0.126777 & -1.5681 & 0.059456 \tabularnewline
18 & -0.131102 & -1.6216 & 0.05347 \tabularnewline
19 & -0.152309 & -1.884 & 0.030734 \tabularnewline
20 & -0.157292 & -1.9456 & 0.026768 \tabularnewline
21 & -0.060853 & -0.7527 & 0.226389 \tabularnewline
22 & 0.154879 & 1.9158 & 0.028631 \tabularnewline
23 & 0.422156 & 5.2218 & 0 \tabularnewline
24 & 0.561894 & 6.9502 & 0 \tabularnewline
25 & 0.371579 & 4.5962 & 4e-06 \tabularnewline
26 & 0.082894 & 1.0253 & 0.153409 \tabularnewline
27 & -0.144548 & -1.788 & 0.03788 \tabularnewline
28 & -0.243109 & -3.0071 & 0.001542 \tabularnewline
29 & -0.25135 & -3.109 & 0.001119 \tabularnewline
30 & -0.247673 & -3.0636 & 0.001293 \tabularnewline
31 & -0.258472 & -3.1971 & 0.000843 \tabularnewline
32 & -0.254795 & -3.1516 & 0.000977 \tabularnewline
33 & -0.15792 & -1.9534 & 0.0263 \tabularnewline
34 & 0.043548 & 0.5387 & 0.295452 \tabularnewline
35 & 0.290278 & 3.5905 & 0.000222 \tabularnewline
36 & 0.416543 & 5.1524 & 0 \tabularnewline
37 & 0.246088 & 3.0439 & 0.001375 \tabularnewline
38 & -0.010664 & -0.1319 & 0.447614 \tabularnewline
39 & -0.210361 & -2.602 & 0.005089 \tabularnewline
40 & -0.292841 & -3.6222 & 0.000198 \tabularnewline
41 & -0.297029 & -3.674 & 0.000165 \tabularnewline
42 & -0.291694 & -3.6081 & 0.000209 \tabularnewline
43 & -0.302115 & -3.737 & 0.000131 \tabularnewline
44 & -0.298717 & -3.6949 & 0.000153 \tabularnewline
45 & -0.209768 & -2.5947 & 0.005194 \tabularnewline
46 & -0.029556 & -0.3656 & 0.357589 \tabularnewline
47 & 0.189637 & 2.3457 & 0.010138 \tabularnewline
48 & 0.301205 & 3.7257 & 0.000137 \tabularnewline
\hline
\end{tabular}
%Source: https://freestatistics.org/blog/index.php?pk=195048&T=1

[TABLE]
[ROW][C]Autocorrelation Function[/C][/ROW]
[ROW][C]Time lag k[/C][C]ACF(k)[/C][C]T-STAT[/C][C]P-value[/C][/ROW]
[ROW][C]1[/C][C]0.797825[/C][C]9.8686[/C][C]0[/C][/ROW]
[ROW][C]2[/C][C]0.458802[/C][C]5.6751[/C][C]0[/C][/ROW]
[ROW][C]3[/C][C]0.187054[/C][C]2.3137[/C][C]0.011007[/C][/ROW]
[ROW][C]4[/C][C]0.061405[/C][C]0.7595[/C][C]0.224349[/C][/ROW]
[ROW][C]5[/C][C]0.049645[/C][C]0.6141[/C][C]0.270038[/C][/ROW]
[ROW][C]6[/C][C]0.055703[/C][C]0.689[/C][C]0.245929[/C][/ROW]
[ROW][C]7[/C][C]0.036655[/C][C]0.4534[/C][C]0.325452[/C][/ROW]
[ROW][C]8[/C][C]0.030665[/C][C]0.3793[/C][C]0.352494[/C][/ROW]
[ROW][C]9[/C][C]0.131957[/C][C]1.6322[/C][C]0.052345[/C][/ROW]
[ROW][C]10[/C][C]0.363487[/C][C]4.4961[/C][C]7e-06[/C][/ROW]
[ROW][C]11[/C][C]0.654016[/C][C]8.0897[/C][C]0[/C][/ROW]
[ROW][C]12[/C][C]0.812393[/C][C]10.0487[/C][C]0[/C][/ROW]
[ROW][C]13[/C][C]0.605443[/C][C]7.4889[/C][C]0[/C][/ROW]
[ROW][C]14[/C][C]0.280594[/C][C]3.4708[/C][C]0.000337[/C][/ROW]
[ROW][C]15[/C][C]0.017588[/C][C]0.2175[/C][C]0.414035[/C][/ROW]
[ROW][C]16[/C][C]-0.106666[/C][C]-1.3194[/C][C]0.094506[/C][/ROW]
[ROW][C]17[/C][C]-0.126777[/C][C]-1.5681[/C][C]0.059456[/C][/ROW]
[ROW][C]18[/C][C]-0.131102[/C][C]-1.6216[/C][C]0.05347[/C][/ROW]
[ROW][C]19[/C][C]-0.152309[/C][C]-1.884[/C][C]0.030734[/C][/ROW]
[ROW][C]20[/C][C]-0.157292[/C][C]-1.9456[/C][C]0.026768[/C][/ROW]
[ROW][C]21[/C][C]-0.060853[/C][C]-0.7527[/C][C]0.226389[/C][/ROW]
[ROW][C]22[/C][C]0.154879[/C][C]1.9158[/C][C]0.028631[/C][/ROW]
[ROW][C]23[/C][C]0.422156[/C][C]5.2218[/C][C]0[/C][/ROW]
[ROW][C]24[/C][C]0.561894[/C][C]6.9502[/C][C]0[/C][/ROW]
[ROW][C]25[/C][C]0.371579[/C][C]4.5962[/C][C]4e-06[/C][/ROW]
[ROW][C]26[/C][C]0.082894[/C][C]1.0253[/C][C]0.153409[/C][/ROW]
[ROW][C]27[/C][C]-0.144548[/C][C]-1.788[/C][C]0.03788[/C][/ROW]
[ROW][C]28[/C][C]-0.243109[/C][C]-3.0071[/C][C]0.001542[/C][/ROW]
[ROW][C]29[/C][C]-0.25135[/C][C]-3.109[/C][C]0.001119[/C][/ROW]
[ROW][C]30[/C][C]-0.247673[/C][C]-3.0636[/C][C]0.001293[/C][/ROW]
[ROW][C]31[/C][C]-0.258472[/C][C]-3.1971[/C][C]0.000843[/C][/ROW]
[ROW][C]32[/C][C]-0.254795[/C][C]-3.1516[/C][C]0.000977[/C][/ROW]
[ROW][C]33[/C][C]-0.15792[/C][C]-1.9534[/C][C]0.0263[/C][/ROW]
[ROW][C]34[/C][C]0.043548[/C][C]0.5387[/C][C]0.295452[/C][/ROW]
[ROW][C]35[/C][C]0.290278[/C][C]3.5905[/C][C]0.000222[/C][/ROW]
[ROW][C]36[/C][C]0.416543[/C][C]5.1524[/C][C]0[/C][/ROW]
[ROW][C]37[/C][C]0.246088[/C][C]3.0439[/C][C]0.001375[/C][/ROW]
[ROW][C]38[/C][C]-0.010664[/C][C]-0.1319[/C][C]0.447614[/C][/ROW]
[ROW][C]39[/C][C]-0.210361[/C][C]-2.602[/C][C]0.005089[/C][/ROW]
[ROW][C]40[/C][C]-0.292841[/C][C]-3.6222[/C][C]0.000198[/C][/ROW]
[ROW][C]41[/C][C]-0.297029[/C][C]-3.674[/C][C]0.000165[/C][/ROW]
[ROW][C]42[/C][C]-0.291694[/C][C]-3.6081[/C][C]0.000209[/C][/ROW]
[ROW][C]43[/C][C]-0.302115[/C][C]-3.737[/C][C]0.000131[/C][/ROW]
[ROW][C]44[/C][C]-0.298717[/C][C]-3.6949[/C][C]0.000153[/C][/ROW]
[ROW][C]45[/C][C]-0.209768[/C][C]-2.5947[/C][C]0.005194[/C][/ROW]
[ROW][C]46[/C][C]-0.029556[/C][C]-0.3656[/C][C]0.357589[/C][/ROW]
[ROW][C]47[/C][C]0.189637[/C][C]2.3457[/C][C]0.010138[/C][/ROW]
[ROW][C]48[/C][C]0.301205[/C][C]3.7257[/C][C]0.000137[/C][/ROW]
[/TABLE]
Source: https://freestatistics.org/blog/index.php?pk=195048&T=1

Globally Unique Identifier (entire table): ba.freestatistics.org/blog/index.php?pk=195048&T=1

As an alternative you can also use a QR Code:  

The GUIDs for individual cells are displayed in the table below:

Autocorrelation Function
Time lag kACF(k)T-STATP-value
10.7978259.86860
20.4588025.67510
30.1870542.31370.011007
40.0614050.75950.224349
50.0496450.61410.270038
60.0557030.6890.245929
70.0366550.45340.325452
80.0306650.37930.352494
90.1319571.63220.052345
100.3634874.49617e-06
110.6540168.08970
120.81239310.04870
130.6054437.48890
140.2805943.47080.000337
150.0175880.21750.414035
16-0.106666-1.31940.094506
17-0.126777-1.56810.059456
18-0.131102-1.62160.05347
19-0.152309-1.8840.030734
20-0.157292-1.94560.026768
21-0.060853-0.75270.226389
220.1548791.91580.028631
230.4221565.22180
240.5618946.95020
250.3715794.59624e-06
260.0828941.02530.153409
27-0.144548-1.7880.03788
28-0.243109-3.00710.001542
29-0.25135-3.1090.001119
30-0.247673-3.06360.001293
31-0.258472-3.19710.000843
32-0.254795-3.15160.000977
33-0.15792-1.95340.0263
340.0435480.53870.295452
350.2902783.59050.000222
360.4165435.15240
370.2460883.04390.001375
38-0.010664-0.13190.447614
39-0.210361-2.6020.005089
40-0.292841-3.62220.000198
41-0.297029-3.6740.000165
42-0.291694-3.60810.000209
43-0.302115-3.7370.000131
44-0.298717-3.69490.000153
45-0.209768-2.59470.005194
46-0.029556-0.36560.357589
470.1896372.34570.010138
480.3012053.72570.000137


Partial Autocorrelation Function
Time lag kPACF(k)T-STATP-value
10.7978259.86860
2-0.488954-6.0480
30.1161731.4370.076383
40.0862721.06710.143797
50.0299960.3710.355565
6-0.080021-0.98980.161917
7-0.005068-0.06270.475047
80.111081.3740.085729
90.3191933.94826e-05
100.3590224.44099e-06
110.4439125.49090
120.1572291.94480.026815
13-0.774402-9.57880
140.3150133.89657.3e-05
15-0.241831-2.99130.00162
16-0.112019-1.38560.083943
17-0.119502-1.47820.070711
18-0.102738-1.27080.102865
190.0649580.80350.211472
20-0.078591-0.97210.166262
21-0.038144-0.47180.318866
220.0872061.07870.141215
23-0.04465-0.55230.290779
240.0627430.77610.219446
250.0081550.10090.459895
260.0873621.08060.140786
270.1096931.35680.088417
28-0.043604-0.53940.295214
290.0679770.84080.200876
300.0500160.61870.268529
31-0.053431-0.66090.254835
320.00680.08410.466539
33-0.068293-0.84470.199787
34-0.078156-0.96670.167599
350.0194990.24120.404864
36-0.088949-1.10020.136479
37-0.00013-0.00160.499358
38-0.115677-1.43080.077257
39-0.027116-0.33540.36889
40-0.036475-0.45120.326253
41-0.049823-0.61630.269315
42-0.012862-0.15910.436901
43-0.099238-1.22750.11076
440.0406470.50280.307921
45-0.037076-0.45860.323585
46-0.048589-0.6010.274361
470.0018240.02260.491016
480.0790450.97770.164875

\begin{tabular}{lllllllll}
\hline
Partial Autocorrelation Function \tabularnewline
Time lag k & PACF(k) & T-STAT & P-value \tabularnewline
1 & 0.797825 & 9.8686 & 0 \tabularnewline
2 & -0.488954 & -6.048 & 0 \tabularnewline
3 & 0.116173 & 1.437 & 0.076383 \tabularnewline
4 & 0.086272 & 1.0671 & 0.143797 \tabularnewline
5 & 0.029996 & 0.371 & 0.355565 \tabularnewline
6 & -0.080021 & -0.9898 & 0.161917 \tabularnewline
7 & -0.005068 & -0.0627 & 0.475047 \tabularnewline
8 & 0.11108 & 1.374 & 0.085729 \tabularnewline
9 & 0.319193 & 3.9482 & 6e-05 \tabularnewline
10 & 0.359022 & 4.4409 & 9e-06 \tabularnewline
11 & 0.443912 & 5.4909 & 0 \tabularnewline
12 & 0.157229 & 1.9448 & 0.026815 \tabularnewline
13 & -0.774402 & -9.5788 & 0 \tabularnewline
14 & 0.315013 & 3.8965 & 7.3e-05 \tabularnewline
15 & -0.241831 & -2.9913 & 0.00162 \tabularnewline
16 & -0.112019 & -1.3856 & 0.083943 \tabularnewline
17 & -0.119502 & -1.4782 & 0.070711 \tabularnewline
18 & -0.102738 & -1.2708 & 0.102865 \tabularnewline
19 & 0.064958 & 0.8035 & 0.211472 \tabularnewline
20 & -0.078591 & -0.9721 & 0.166262 \tabularnewline
21 & -0.038144 & -0.4718 & 0.318866 \tabularnewline
22 & 0.087206 & 1.0787 & 0.141215 \tabularnewline
23 & -0.04465 & -0.5523 & 0.290779 \tabularnewline
24 & 0.062743 & 0.7761 & 0.219446 \tabularnewline
25 & 0.008155 & 0.1009 & 0.459895 \tabularnewline
26 & 0.087362 & 1.0806 & 0.140786 \tabularnewline
27 & 0.109693 & 1.3568 & 0.088417 \tabularnewline
28 & -0.043604 & -0.5394 & 0.295214 \tabularnewline
29 & 0.067977 & 0.8408 & 0.200876 \tabularnewline
30 & 0.050016 & 0.6187 & 0.268529 \tabularnewline
31 & -0.053431 & -0.6609 & 0.254835 \tabularnewline
32 & 0.0068 & 0.0841 & 0.466539 \tabularnewline
33 & -0.068293 & -0.8447 & 0.199787 \tabularnewline
34 & -0.078156 & -0.9667 & 0.167599 \tabularnewline
35 & 0.019499 & 0.2412 & 0.404864 \tabularnewline
36 & -0.088949 & -1.1002 & 0.136479 \tabularnewline
37 & -0.00013 & -0.0016 & 0.499358 \tabularnewline
38 & -0.115677 & -1.4308 & 0.077257 \tabularnewline
39 & -0.027116 & -0.3354 & 0.36889 \tabularnewline
40 & -0.036475 & -0.4512 & 0.326253 \tabularnewline
41 & -0.049823 & -0.6163 & 0.269315 \tabularnewline
42 & -0.012862 & -0.1591 & 0.436901 \tabularnewline
43 & -0.099238 & -1.2275 & 0.11076 \tabularnewline
44 & 0.040647 & 0.5028 & 0.307921 \tabularnewline
45 & -0.037076 & -0.4586 & 0.323585 \tabularnewline
46 & -0.048589 & -0.601 & 0.274361 \tabularnewline
47 & 0.001824 & 0.0226 & 0.491016 \tabularnewline
48 & 0.079045 & 0.9777 & 0.164875 \tabularnewline
\hline
\end{tabular}
%Source: https://freestatistics.org/blog/index.php?pk=195048&T=2

[TABLE]
[ROW][C]Partial Autocorrelation Function[/C][/ROW]
[ROW][C]Time lag k[/C][C]PACF(k)[/C][C]T-STAT[/C][C]P-value[/C][/ROW]
[ROW][C]1[/C][C]0.797825[/C][C]9.8686[/C][C]0[/C][/ROW]
[ROW][C]2[/C][C]-0.488954[/C][C]-6.048[/C][C]0[/C][/ROW]
[ROW][C]3[/C][C]0.116173[/C][C]1.437[/C][C]0.076383[/C][/ROW]
[ROW][C]4[/C][C]0.086272[/C][C]1.0671[/C][C]0.143797[/C][/ROW]
[ROW][C]5[/C][C]0.029996[/C][C]0.371[/C][C]0.355565[/C][/ROW]
[ROW][C]6[/C][C]-0.080021[/C][C]-0.9898[/C][C]0.161917[/C][/ROW]
[ROW][C]7[/C][C]-0.005068[/C][C]-0.0627[/C][C]0.475047[/C][/ROW]
[ROW][C]8[/C][C]0.11108[/C][C]1.374[/C][C]0.085729[/C][/ROW]
[ROW][C]9[/C][C]0.319193[/C][C]3.9482[/C][C]6e-05[/C][/ROW]
[ROW][C]10[/C][C]0.359022[/C][C]4.4409[/C][C]9e-06[/C][/ROW]
[ROW][C]11[/C][C]0.443912[/C][C]5.4909[/C][C]0[/C][/ROW]
[ROW][C]12[/C][C]0.157229[/C][C]1.9448[/C][C]0.026815[/C][/ROW]
[ROW][C]13[/C][C]-0.774402[/C][C]-9.5788[/C][C]0[/C][/ROW]
[ROW][C]14[/C][C]0.315013[/C][C]3.8965[/C][C]7.3e-05[/C][/ROW]
[ROW][C]15[/C][C]-0.241831[/C][C]-2.9913[/C][C]0.00162[/C][/ROW]
[ROW][C]16[/C][C]-0.112019[/C][C]-1.3856[/C][C]0.083943[/C][/ROW]
[ROW][C]17[/C][C]-0.119502[/C][C]-1.4782[/C][C]0.070711[/C][/ROW]
[ROW][C]18[/C][C]-0.102738[/C][C]-1.2708[/C][C]0.102865[/C][/ROW]
[ROW][C]19[/C][C]0.064958[/C][C]0.8035[/C][C]0.211472[/C][/ROW]
[ROW][C]20[/C][C]-0.078591[/C][C]-0.9721[/C][C]0.166262[/C][/ROW]
[ROW][C]21[/C][C]-0.038144[/C][C]-0.4718[/C][C]0.318866[/C][/ROW]
[ROW][C]22[/C][C]0.087206[/C][C]1.0787[/C][C]0.141215[/C][/ROW]
[ROW][C]23[/C][C]-0.04465[/C][C]-0.5523[/C][C]0.290779[/C][/ROW]
[ROW][C]24[/C][C]0.062743[/C][C]0.7761[/C][C]0.219446[/C][/ROW]
[ROW][C]25[/C][C]0.008155[/C][C]0.1009[/C][C]0.459895[/C][/ROW]
[ROW][C]26[/C][C]0.087362[/C][C]1.0806[/C][C]0.140786[/C][/ROW]
[ROW][C]27[/C][C]0.109693[/C][C]1.3568[/C][C]0.088417[/C][/ROW]
[ROW][C]28[/C][C]-0.043604[/C][C]-0.5394[/C][C]0.295214[/C][/ROW]
[ROW][C]29[/C][C]0.067977[/C][C]0.8408[/C][C]0.200876[/C][/ROW]
[ROW][C]30[/C][C]0.050016[/C][C]0.6187[/C][C]0.268529[/C][/ROW]
[ROW][C]31[/C][C]-0.053431[/C][C]-0.6609[/C][C]0.254835[/C][/ROW]
[ROW][C]32[/C][C]0.0068[/C][C]0.0841[/C][C]0.466539[/C][/ROW]
[ROW][C]33[/C][C]-0.068293[/C][C]-0.8447[/C][C]0.199787[/C][/ROW]
[ROW][C]34[/C][C]-0.078156[/C][C]-0.9667[/C][C]0.167599[/C][/ROW]
[ROW][C]35[/C][C]0.019499[/C][C]0.2412[/C][C]0.404864[/C][/ROW]
[ROW][C]36[/C][C]-0.088949[/C][C]-1.1002[/C][C]0.136479[/C][/ROW]
[ROW][C]37[/C][C]-0.00013[/C][C]-0.0016[/C][C]0.499358[/C][/ROW]
[ROW][C]38[/C][C]-0.115677[/C][C]-1.4308[/C][C]0.077257[/C][/ROW]
[ROW][C]39[/C][C]-0.027116[/C][C]-0.3354[/C][C]0.36889[/C][/ROW]
[ROW][C]40[/C][C]-0.036475[/C][C]-0.4512[/C][C]0.326253[/C][/ROW]
[ROW][C]41[/C][C]-0.049823[/C][C]-0.6163[/C][C]0.269315[/C][/ROW]
[ROW][C]42[/C][C]-0.012862[/C][C]-0.1591[/C][C]0.436901[/C][/ROW]
[ROW][C]43[/C][C]-0.099238[/C][C]-1.2275[/C][C]0.11076[/C][/ROW]
[ROW][C]44[/C][C]0.040647[/C][C]0.5028[/C][C]0.307921[/C][/ROW]
[ROW][C]45[/C][C]-0.037076[/C][C]-0.4586[/C][C]0.323585[/C][/ROW]
[ROW][C]46[/C][C]-0.048589[/C][C]-0.601[/C][C]0.274361[/C][/ROW]
[ROW][C]47[/C][C]0.001824[/C][C]0.0226[/C][C]0.491016[/C][/ROW]
[ROW][C]48[/C][C]0.079045[/C][C]0.9777[/C][C]0.164875[/C][/ROW]
[/TABLE]
Source: https://freestatistics.org/blog/index.php?pk=195048&T=2

Globally Unique Identifier (entire table): ba.freestatistics.org/blog/index.php?pk=195048&T=2

As an alternative you can also use a QR Code:  

The GUIDs for individual cells are displayed in the table below:

Partial Autocorrelation Function
Time lag kPACF(k)T-STATP-value
10.7978259.86860
2-0.488954-6.0480
30.1161731.4370.076383
40.0862721.06710.143797
50.0299960.3710.355565
6-0.080021-0.98980.161917
7-0.005068-0.06270.475047
80.111081.3740.085729
90.3191933.94826e-05
100.3590224.44099e-06
110.4439125.49090
120.1572291.94480.026815
13-0.774402-9.57880
140.3150133.89657.3e-05
15-0.241831-2.99130.00162
16-0.112019-1.38560.083943
17-0.119502-1.47820.070711
18-0.102738-1.27080.102865
190.0649580.80350.211472
20-0.078591-0.97210.166262
21-0.038144-0.47180.318866
220.0872061.07870.141215
23-0.04465-0.55230.290779
240.0627430.77610.219446
250.0081550.10090.459895
260.0873621.08060.140786
270.1096931.35680.088417
28-0.043604-0.53940.295214
290.0679770.84080.200876
300.0500160.61870.268529
31-0.053431-0.66090.254835
320.00680.08410.466539
33-0.068293-0.84470.199787
34-0.078156-0.96670.167599
350.0194990.24120.404864
36-0.088949-1.10020.136479
37-0.00013-0.00160.499358
38-0.115677-1.43080.077257
39-0.027116-0.33540.36889
40-0.036475-0.45120.326253
41-0.049823-0.61630.269315
42-0.012862-0.15910.436901
43-0.099238-1.22750.11076
440.0406470.50280.307921
45-0.037076-0.45860.323585
46-0.048589-0.6010.274361
470.0018240.02260.491016
480.0790450.97770.164875


Parameters (Session):
par1 = 48 ; par2 = 1 ; par3 = 0 ; par4 = 0 ; par5 = 12 ; par6 = White Noise ; par7 = 0.95 ;
Parameters (R input):
par1 = 48 ; par2 = 1 ; par3 = 0 ; par4 = 0 ; par5 = 12 ; par6 = White Noise ; par7 = 0.95 ; par8 = ;
R code (references can be found in the software module):
if (par1 == 'Default') {
par1 = 10*log10(length(x))
} else {
par1 <- as.numeric(par1)
}
par2 <- as.numeric(par2)
par3 <- as.numeric(par3)
par4 <- as.numeric(par4)
par5 <- as.numeric(par5)
if (par6 == 'White Noise') par6 <- 'white' else par6 <- 'ma'
par7 <- as.numeric(par7)
if (par2 == 0) {
x <- log(x)
} else {
x <- (x ^ par2 - 1) / par2
}
if (par3 > 0) x <- diff(x,lag=1,difference=par3)
if (par4 > 0) x <- diff(x,lag=par5,difference=par4)
bitmap(file='pic1.png')
racf <- acf(x, par1, main='Autocorrelation', xlab='time lag', ylab='ACF', ci.type=par6, ci=par7, sub=paste('(lambda=',par2,', d=',par3,', D=',par4,', CI=', par7, ', CI type=',par6,')',sep=''))
dev.off()
bitmap(file='pic2.png')
rpacf <- pacf(x,par1,main='Partial Autocorrelation',xlab='lags',ylab='PACF')
dev.off()
(myacf <- c(racf$acf))
(mypacf <- c(rpacf$acf))
lengthx <- length(x)
sqrtn <- sqrt(lengthx)
load(file='createtable')
a<-table.start()
a<-table.row.start(a)
a<-table.element(a,'Autocorrelation Function',4,TRUE)
a<-table.row.end(a)
a<-table.row.start(a)
a<-table.element(a,'Time lag k',header=TRUE)
a<-table.element(a,hyperlink('basics.htm','ACF(k)','click here for more information about the Autocorrelation Function'),header=TRUE)
a<-table.element(a,'T-STAT',header=TRUE)
a<-table.element(a,'P-value',header=TRUE)
a<-table.row.end(a)
for (i in 2:(par1+1)) {
a<-table.row.start(a)
a<-table.element(a,i-1,header=TRUE)
a<-table.element(a,round(myacf[i],6))
mytstat <- myacf[i]*sqrtn
a<-table.element(a,round(mytstat,4))
a<-table.element(a,round(1-pt(abs(mytstat),lengthx),6))
a<-table.row.end(a)
}
a<-table.end(a)
table.save(a,file='mytable.tab')
a<-table.start()
a<-table.row.start(a)
a<-table.element(a,'Partial Autocorrelation Function',4,TRUE)
a<-table.row.end(a)
a<-table.row.start(a)
a<-table.element(a,'Time lag k',header=TRUE)
a<-table.element(a,hyperlink('basics.htm','PACF(k)','click here for more information about the Partial Autocorrelation Function'),header=TRUE)
a<-table.element(a,'T-STAT',header=TRUE)
a<-table.element(a,'P-value',header=TRUE)
a<-table.row.end(a)
for (i in 1:par1) {
a<-table.row.start(a)
a<-table.element(a,i,header=TRUE)
a<-table.element(a,round(mypacf[i],6))
mytstat <- mypacf[i]*sqrtn
a<-table.element(a,round(mytstat,4))
a<-table.element(a,round(1-pt(abs(mytstat),lengthx),6))
a<-table.row.end(a)
}
a<-table.end(a)
table.save(a,file='mytable1.tab')